. 2025 Jan 15;8(1):55.
doi: 10.1038/s42003-024-07432-7.

Loss of correlated proteasomal subunit expression selectively promotes the 20SHigh state which underlies luminal breast tumorigenicity

Affiliations

Loss of correlated proteasomal subunit expression selectively promotes the 20SHigh state which underlies luminal breast tumorigenicity

Rangapriya Sundararajan et al. Commun Biol. .

Abstract

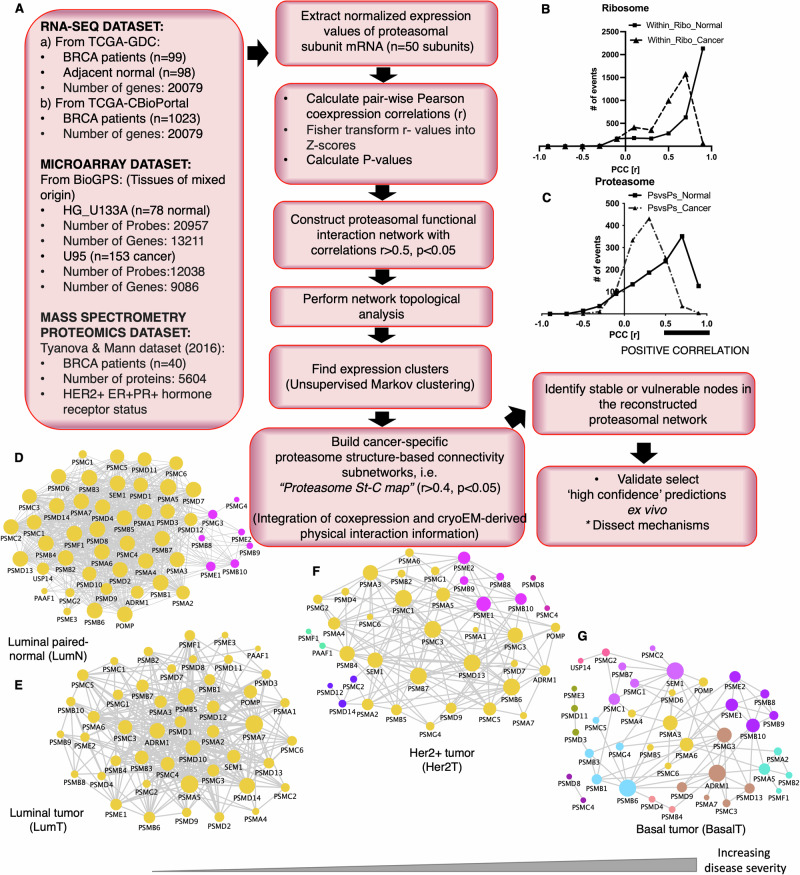
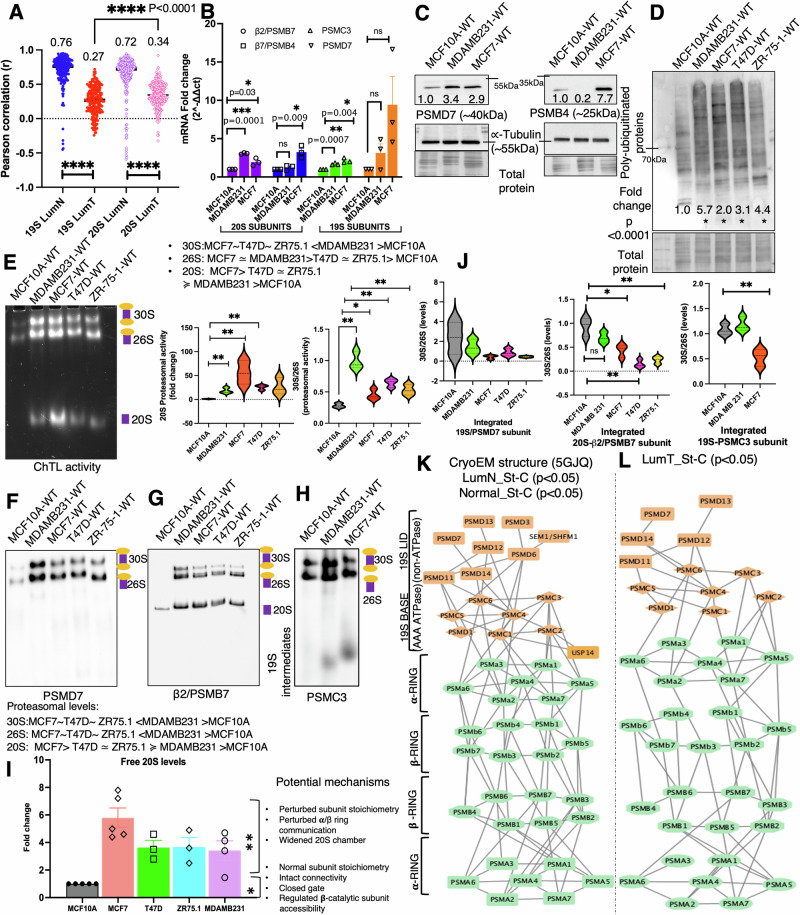
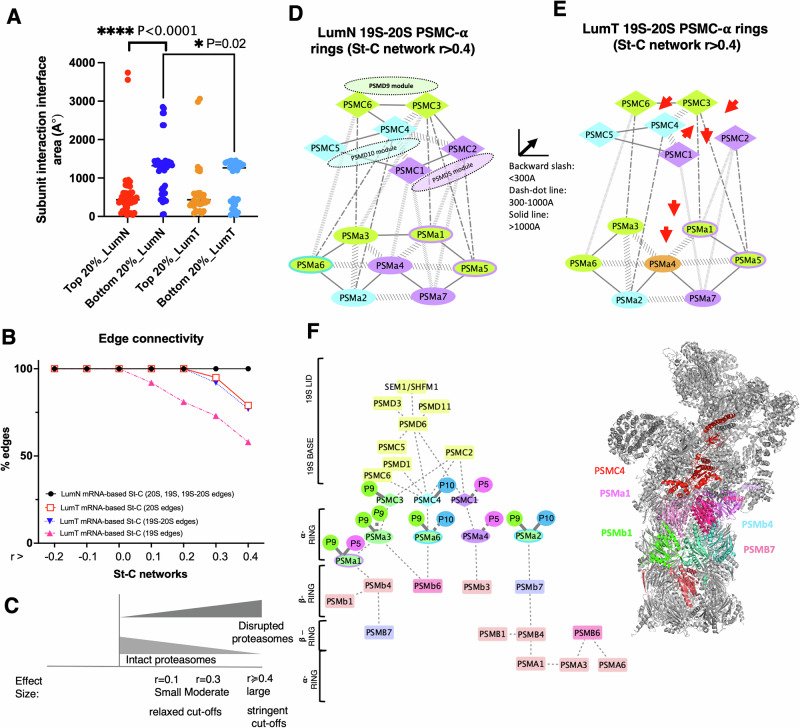
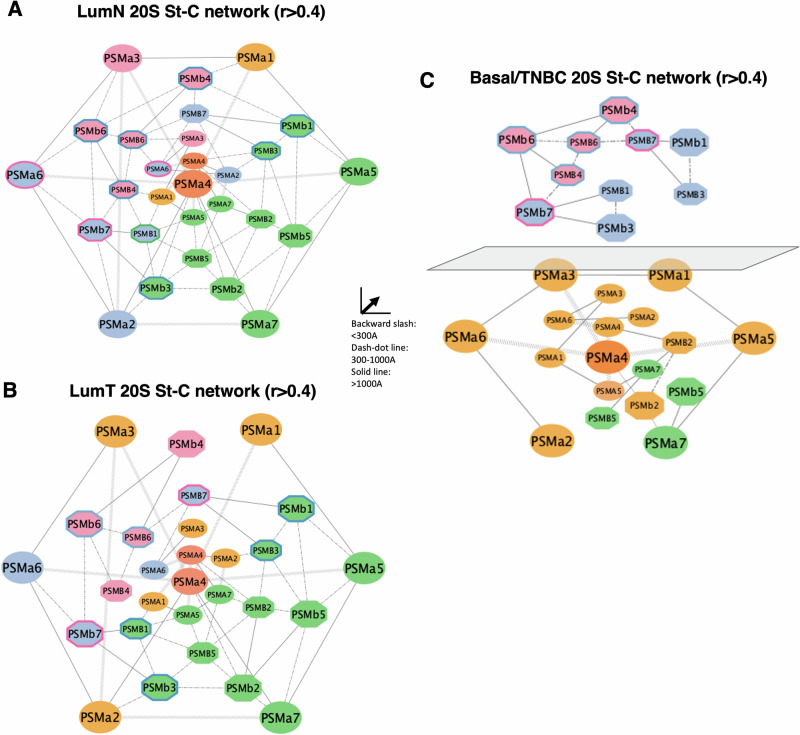
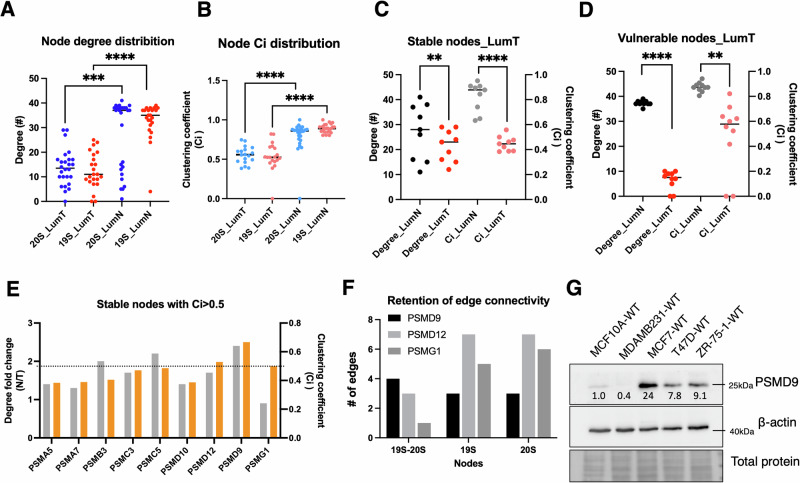
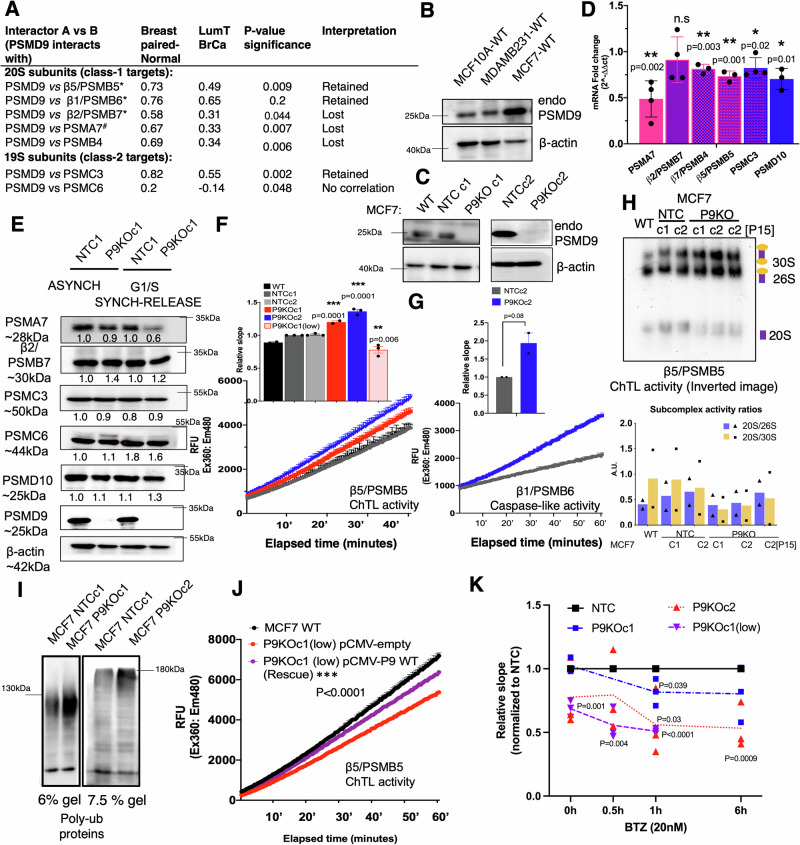
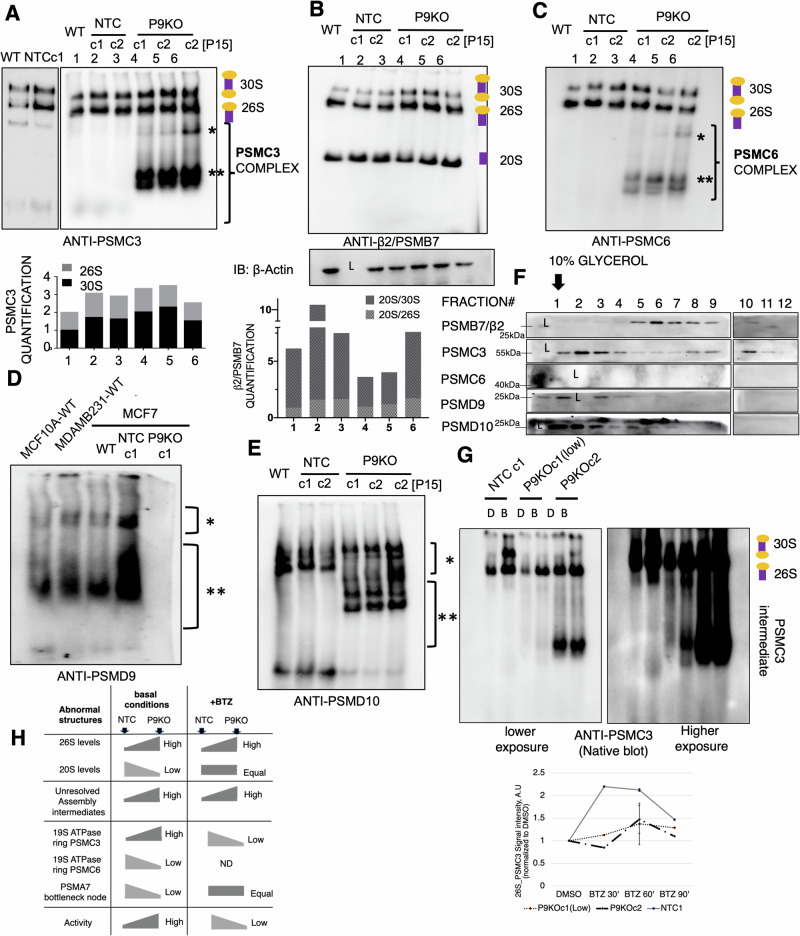
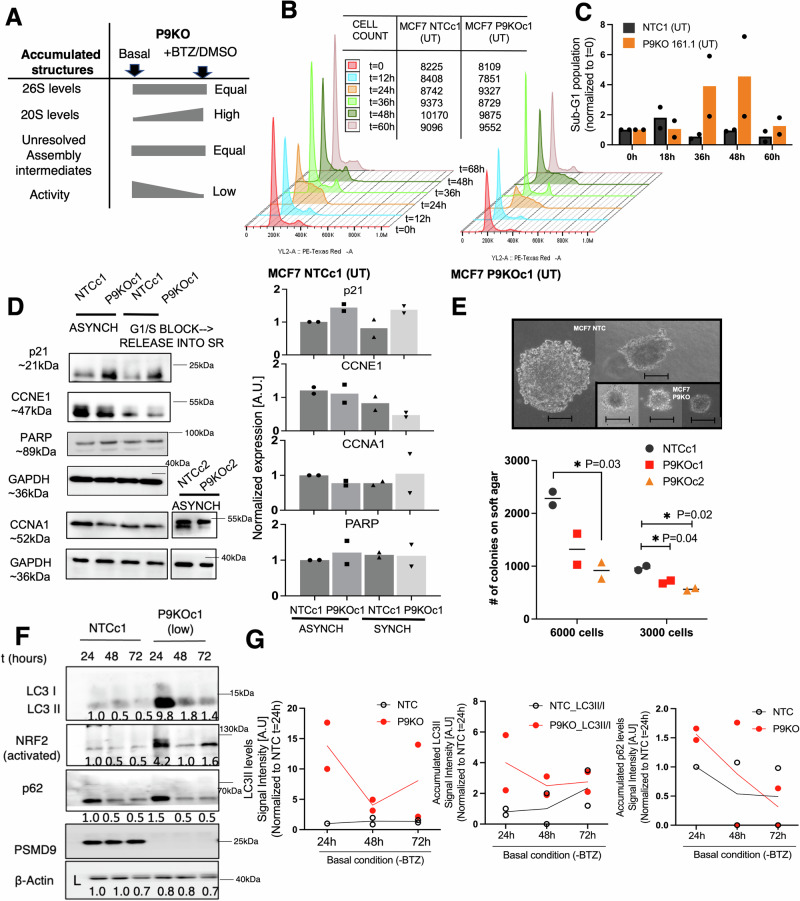
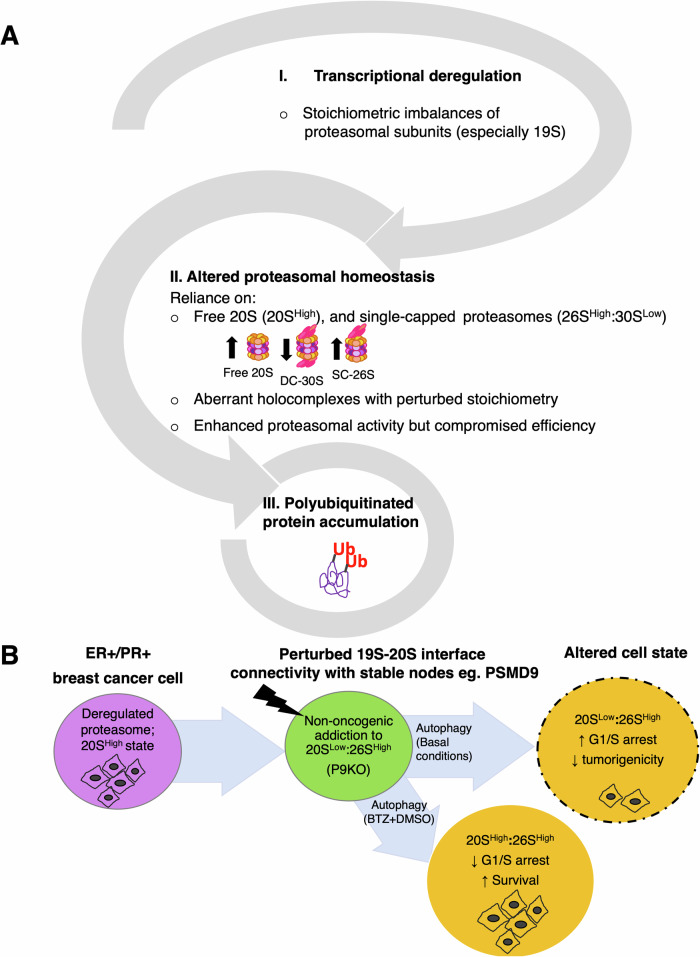
Why cancer cells disproportionately accumulate polyubiquitinated proteotoxic proteins despite high proteasomal activity is an outstanding question. While mis-regulated ubiquitination is a contributing factor, here we show that a structurally-perturbed and sub-optimally functioning proteasome is at the core of altered proteostasis in tumors. By integrating the gene coexpression signatures of proteasomal subunits in breast cancer (BrCa) patient tissues with the atomistic details of 26S holocomplex, we find that the transcriptional deregulation induced-stoichiometric imbalances perpetuate with disease severity. As seen in luminal BrCa cell lines, this imbalance limits the number of double-capped 19S-20S-19S holocomplexes (30S) formed and promotes free 20S catalytic core accumulation that is widely-believed to confer survival advantage to tumors. By retaining connectivity with key tumor 19S:20S interface nodes, the PSMD9 19S subunit chaperone emerges as a crucial regulator of 26S/30S:20S ratios sustaining tumor cell proteasome function. Disrupting this connectivity by depleting PSMD9 in MCF7 cells introduces structural anomalies in the proteasome, and shifts dependence from 20SHigh to a deregulated 26SHigh state invoking anti-tumor responses which opens up clinically-relevant therapeutic possibilities.


Conflict of interest statement

Competing interests: The authors declare no competing interests.

Figures

Fig. 1
Fig. 1. Functional networks of the proteasome in breast cancer and paired-normal tissues.
A Coexpression analysis pipeline. Pearson correlation distributions of ribosome (B) and proteasome (C) subunit pairs. Pairwise Pearson mRNA correlation values (PCC, r) ranging from −1 to +1 are binned into 10 bins. PCC correlations of r ≽ +0.5 are considered as interactions; r = 0 represents no correlation. Other macromolecular complex correlations represented in Supplementary Fig. 1A, B. n = 99 human BrCa patient and n = 98 adjacent-normal tissues. DG Undirected graphs represent proteasome functional coexpression networks of BrCa molecular subtypes with increasing disease severity that are delineated by hormone receptor status: luminal-A and -B (lumT, ER+;PR±;HER2−, n = 69, E), Her2+T (ER−/PR−, n = 60, F), and TNBC (ER−/PR−/HER2−, n = 139 BrCa patient tissues, G) and compared with luminal adjacent-normal tissues (lumN, n = 69 tissues, D). Node clusters derived from MCL hierarchical clustering represented in different colors. Larger bubble indicates nodes with high degree centrality that exhibit hub-like behavior and are critical for network stability (degree = number of edges/interactions of a node). Edges represent either physical, regulatory or functional interactions that are potentially physiologically relevant. List of proteasomal subunits included in Supplementary Table 1. Network concepts briefly described in Supplementary Note 2. Confirmation of dataset robustness described in “Methods”.
Fig. 2
Fig. 2. Proteasomal status in normal and BrCa subtype-specific patient tissues and cell lines.
A PCC distribution of 19S-RP (PSMC and PSMD) and 20S-CP (PSMA and PSMB) proteasomal subunit pairs that experience significant changes in lumT BrCa patient tissues (n = 69) relative to lumN normal (n = 69). Median r values indicated; Statistical significance by unpaired two-tailed t-test. mRNA (B) and protein expression (C) of 20S (β2/PSMB7, β7/PSMB4) and 19S (PSMC3, PSMD7) subunits normalized to GAPDH and α-tubulin, respectively. Error bars represent ±SEM; p < 0.05 by unpaired, two-tailed t-test, n = 3 independent experiments. DH Representative western blots showing polyubiquitinated protein levels (D, n = 3 experiments); in-gel chymotrypsin-like (ChTL) activity of the 20S-β5/PSMB5 catalytic subunit with fluorogenic Suc-LLVY-AMC tetrapeptide substrate (E, n = 3 experiments); Quantified ChTL activities of native 26S/30S holocomplexes and free catalytic 20S-CP are represented with violin plots. Representative blots showing levels of integrated 19S:20S interface nodes 19S-PSMD7 (F, n = 3 experiments), and 19S-PSMC3 (H, n = 3 experiments) or 20S-β2/PSMB7 (G, n = 5 experiments) into the BrCa double-capped and single-capped proteasomes. Quantified 30S:26S ratios or 20S levels represented in (J) and (I, based on integrated β2/PSMB7), respectively. Proposed events leading to a dual population of perturbed (**) or intact (*) free 20S within the lumT ER+/PR+ BrCa indicated. Breast normal-like MCF10A-WT included as control. Loading control = Fast Green FCF dye-stained total protein. Statistical significance determined by unpaired, two-tailed t-test (*p < 0.05, **p < 0.01). Data in (B, H) or (CG) obtained using the same lysates. K, L Integrated mRNA-based structure-connectivity networks, St-C (r > 0.4, p < 0.05, unpaired two-tailed t-test) representing the probable EM structures of patient-derived luminal adjacent-normal and tumor tissue proteasomes. Identical connectivity in the paired adjacent luminal normal (n = 69), unpaired normal tissues (n = 99) and the CryoEM structure (5GJQ). Connectivity status of the 26SS/30S holocomplex, 19S and 20S subcomplexes derived using active, potentially physiologically-relevant edges r > 0.4, p < 0.05 that are overlaid onto protein-protein interactions (PPI) found in the cryoEM structure, 5GJQ. Criteria for PPI edge inclusion into the connectivity networks listed in Network logic table (Supplementary Table 2). Missing edges represent interactions that are susceptible to stoichiometric imbalances in the final unit proteasome structure. The proteasome St-C network only harbors subunit connectivity and topological information unlike the cryo-EM structures which contain additional structural information. Therefore, node positions in the proteasome St-C network were manually adjusted to reflect their internal positions within the cryoEM structure. Probable structures of the Her2T, TN BrCa proteasomes represented in Supplementary Fig. 5.
Fig. 3
Fig. 3. Characteristics of the mRNA-based proteasomal St-C subnetworks of lumT BrCa patient tissues (r > 0.4, p < 0.05, unpaired t-test).
A Distribution of subunit interaction interface areas with high or low edge betweenness in lumN and lumT proteasomes. Nodes with top 20% edge betweenness are potentially critical for information flow within the network whereas nodes with low edge betweenness (bottom 20%) but with larger interaction interface areas offer structural stability. Node interaction interface areas in tumor are assumed to be similar to normal. Unpaired t-test used to determine statistical significance (p < 0.05). B, C Extent of relaxation required to accommodate 19S, 20S or 19S-20S edges into the lumT proteasomal subnetworks. x-axis represents networks constructed with edges within the indicated r cut-offs (>0.5, >0.4, >0.3, >0.2, >0.1) and y-axis represents their frequencies (B). Effect size (small, moderate, or large) indicated in (C). 19S-20S interface connectivity of lumN (D, n = 69 adjacent-normal tissues) and lumT St-C networks (E, n = 69 lumT tissues). The PSMD10, PSMD9 and PSMD5 chaperone assembly modules (indicated as oval) and their associated nodes are represented in teal, green, and purple colors. Edge losses in the lumT interface indicated by arrows. Edges represented as backward slash, dash-dot or solid lines engage in subunit-subunit interaction interface areas of <300 Å, 300-1000 Å, or >1000 Å, respectively. F The vulnerable face of lumT proteasome comprises of edges spanning the 19S PSMD non-ATPase, 19S PSMC ATPase, 20S α, and β-rings that are lost in tumor. This is represented in an mRNA-based BrCa proteasome St-C structure-connectivity graph (hatched lines) that is modeled on the CryoEM structure 5GJQ; vulnerable nodes in the 5GJQ structure are highlighted in red, pink, green, teal, and lavender colors. The 19S-20S interface nodes that retain connectivity with the 19S chaperone assembly modules PSMD9 (P9), PSMD10 (P10), and PSMD5 (P5) are represented in green, blue, and pink colors, respectively.
Fig. 4
Fig. 4. mRNA-based St-C networks (r > 0.4, p < 0.05) of the 20S lumN, lumT, and TNBC proteasomes.
Radial view of the αββα arrangement of the 20S α- and β-rings of the LumN (A), LumT (B), and basal/TNBC proteasomes (C). The 20S CP comprises of PSMB (octagonal shape) and PSMA (oval shape) nodes. Green nodes are connected to the ChTL-like subunit (β5/PSMB5), pink nodes are connected to the caspase-like subunit (β1/PSMB6), and gray nodes are connected to the trypsin-like subunit (β2/PSMB7). Nodes sharing connectivity with two catalytic subunits are indicated by respective fill and margin colors. Edges represent first-neighbor direct interactions within and across α/β-rings in normal. Many such edges are lost in the lumT and TNBC BrCa proteasomes. Edges are denoted by their interaction strengths derived from interaction interface areas between subunits: backward slash (<300 Å2), dash-dashed (300 Å2 < 1000 Å2) or solid lines (>1000 Å2). The discontinuous α- and β-rings of TNBC 20S proteasome are represented in separate planes (C). Individual α-, β-, and inter-α/β ring connectivity are separately represented in Supplementary Fig. 11.
Fig. 5
Fig. 5. Characteristics of the lumN and lumT proteasome functional networks (PCC r > 0.5, p < 0.05) and their connectivity regulators.
Degree (A) and Ci (B) distribution of 19S and 20S nodes in the lumN (n = 69 adjacent-normal tissues) and lumT (n = 69 tissues) proteasome functional networks. Degree = # of edge connections each node makes with neighboring nodes in its network. Ci measures the tendency of a node to be a hub while maintaining proximity with other network nodes. CF Degree and Ci distribution of top 20% stable (C)and vulnerable nodes (D). Stable nodes experience minimum or no changes, i.e., <1.5 fold degree loss between normal and tumor and contribute >10 degrees to the tumor network. Vulnerable nodes experience the most degree change, i.e., ≥1.5 fold losses between normal and tumor with ≤10 degrees retained in the tumor network. Stable nodes with Ci > 0.5 that experience least degree changes between normal and tumor networks are graphed in (E). Among these, stable nodes with the most edge connectivity with the tumor 19S-20S interface, 19S-RP or 20S-CP nodes are represented (F). G Protein levels of the PSMD9 connectivity regulator in cell lines belonging to the distinct BrCa sybtypes. Total protein stained using Fast green FCF. Actin-normalized PSMD9 signal intensities were used to calculate fold change values. n = 3 independent experiments.
Fig. 6
Fig. 6. Proteasomal subunit levels, activity, and polyubiquitination status of the ER+/PR+ MCF7 strain harboring the CRISPR-CAS9 knockout of PSMD9(P9KO) under basal condition or upon bortezomib inhibition.
A Table lists PSMD9 connectivity status (retained or lost) with 20S and 19S nodes in lumT BrCa patient tissues (n = 69). B, C Endogenous PSMD9 protein levels in BrCa cell lines and MCF7 harboring the CRISPR-CAS9 PSMD9 knockout (100%) or non-targeting controls as determined by immunoblotting (n = 3 experiments). Steady-state mRNA (D, qPCR, n = 2 independent experiments performed in duplicates; data normalized to NTCc1 control) and protein levels (E western blotting, n = 2 experiments) of select 19S and 20S subunits in P9KO cells normalized to GAPDH or β-actin reference locus under basal condition. Error bars represent SEM. Two-tailed p values from unpaired t-test. In-solution kinetic measurements of β5/PSMB5 chymotrypsin-like (ChTL, F, J, K) and β1/PSMB6 caspase-like proteasomal activities (G) under basal conditions or upon BTZ-induced proteasomal inhibition. F Normalized to NTCc1, n = 3 experiments; G normalized to NTCc2, n = 2 experiments; J Rescue of P9KOc1(low) clone with transient expression of pCMV P9-WT. Representative curves from a single experiment. Activities of P9KOc1(low):pCMV-empty vector and MCF7 strains included for comparison (n = 3 experiments). K Proteasomal activity of P9KO clones exposed to 20 nM BTZ are normalized to NTCc1 (n = 3 experiments); DMSO = 0.002%; Error bars represent ±SEM; statistical significance represents p values from two-tailed unpaired t-test. Refer to Supplementary Note 4 for kinetics of proteasome biogenesis and 30S, 26S and 20S subcomplex levels upon BTZ exposure. H Inverted image and quantification of in-gel ChTL-like proteasomal activities of resolved 20S, 26S, and 30S native assemblies. n = 3 experiments. I Accumulation of poly-ubiquitinated proteins in MCF7 P9KO strains by immunoblotting; n = 3 experiments.
Fig. 7
Fig. 7. Assembly status and de novo biogenesis of native 20S, 26S and 30S constitutive proteasomes in MCF7 BrCa cell line lacking PSMD9.
Immunoblots of native 20S and 26S/30S proteasomal assemblies containing A PSMC3/19S ATPase (n = 3 experiments, densitometric quantification included), B β2/PSMB7 constitutive catalytic subunit contributing trypsin-like activity (n = 3 experiments, quantification included), C PSMC6/19S ATPase; n = 2 experiments; PSMC6 required higher exposure times for detection than PSMC3; D PSMD9 and E PSMD10 chaperones (n = 2 experiments each) are included. Where indicated, MCF10A-WT normal-like and MDAMB231-WT strains are included as controls. Slow-moving higher molecular weight (*) and fast-moving lower molecular weight (**) indicate PSMC3-, PSMC6-, PSMD9-, or PSMD10-containing 19S base intermediates in P9KOc1 and P9KOc2 clones (lanes 4–6, A, C, E or lanes 1–4 in D). β-actin = loading control. “L” indicates ladder. IB = immunoblot of protein resolved on SDS-PAGE. Data in AE obtained using the same lysates. F Representative blots of MCF7-WT native proteasomal subcomplexes fractionated using glycerol density gradients in the presence of 1 mM ATP probed with 20S (β2/PSMB7), 19S ATPase (PSMC3, PSMC6- faint trace), and 19S non-ATPase (PSMD9, PSMD10) subunits separated on a denaturing SDS-PAGE. “L” represents ladder, n = 2 experiments. De novo incorporation kinetics of PSMC3 (G) and β2/PSMB7 (Supplementary Note 4A) into native 20S and 26S/30S proteasomes during biogenesis upon exposure to 20 nM BTZ for t = 60’; DMSO (0.002%); n = 2 experiments. Densitometric quantification included with error bar representing ±SEM. Normalization performed with respective DMSO controls; Same lysates used in (G) and Supplementary Note 4A. H Accumulated proteasomal structures in P9KO cells relative to NTC. Level and activity relationships of steady-state or newly-assembled P9KO proteasomes under basal conditions or upon BTZ treatment. “High”, “Low” or “Equal” indicate proteasome levels or activity status in P9KO cells relative to NTC. ND = no data.
Fig. 8
Fig. 8. Consequences of PSMD9/19S deregulation by depletion on sub-G1 accumulation, breast tumorigenicity and stress responses under basal conditions.
A Accumulated structures found in P9KO cells under basal conditions or BTZ-induced proteasomal inhibition and proteotoxic stress. B, C Cell cycle profile and sub-G1 accumulation of P9KOc1 cells at defined timepoints as determined by FACS; UT = untreated; n = 2 independent experiments. Error bars = ±SEM. D Status of G1/S cyclins (CCNE1, CCNA1), p21 CDK inhibitor and apoptosis proteins (PARP) in asynchronous cells or G1-synchronized P9KO cells, n = 2 independent experiments. Densitometric quantification included. E Soft agar assay to determine anchorage-independent growth of MCF7 P9KO cells. (n = ~3000 or ~6000 colonies); n = 2 independent experiments. Scale bar represents 100 μm (C); *p < 0.05 in unpaired, two-tailed t-test. F, G LC3 I→II conversion dynamics coincides with p62 degradation. Accumulation dynamics of autophagy markers SQSTM1/p62, a linking adapter and LC3B autophagic receptor, a 20S substrate in P9KO cells monitored for up to t = 72 h by immunoblotting. +DMSO (-BTZ) condition reflects ongoing basal autophagy; Accumulated LC3-II is an indicator of autophagosome formation and autophagy initiation. LC3-II/I ratio is an indicator of LC3 conversion rates. Degraded p62 is an indicator of ongoing autophagy. Signal intensities normalized to β-actin and relative to NTC (24 h, -BTZ) represented. LC3: n = 3 independent experiments, NRF2 and p62: n = 2 independent experiments. Data in (F, G) obtained using same lysates and blots were processed in parallel.
Fig. 9
Fig. 9. Modeled events leading up to the signature features of lumT BrCa unit proteasome, its perturbation and reversal of luminal MCF7 breast tumorigenicity.
A Transcriptional deregulation of the luminal 19S-RP (I), especially PSMD subunits, would discourage BrCa 30S holocomplex formation, lead to the accumulation of cancer-specific 19S structures and skew proteasomal ratios towards 20S (II). This would reduce the overall dependency on 30S holocomplex and enhance reliance on the free 20S. Additionally, deregulation of select 20S-CP edges occurs in a manner that could widen the 20S chamber, enhance substrate accessibility to the β-active sites and elevate 20S activity. This feature is however countered by a perturbed inter-α/β ring that likely hampers communication between the α-gate and β-active sites thereby impacting substrate processing efficiency, and leading to the accumulation of proteotoxic polyubiquitinated proteins (III). B PSMD9 status impacts BrCa cell survival. Under basal conditions, PSMD9 prevents the accumulation of cancer-specific “aberrant” holocomplexes and 19S intermediate structures while appearing to sustain the deregulated 20S through its moderate connectivity. With the acquired non-oncogenic addiction to the 20SLow:26SHigh state, P9KO cells experience growth arrest through p21 accumulation and LC3II-mediated autophagy thereby reducing MCF7 breast tumorigenicity (altered cell state). Upon BTZ-mediated proteasomal inhibition, P9KO cells show faster NRF2 activation, robust compensatory upregulation of proteasomal subunits, and cellular resistance through stress-induced LC3II autophagy. Collectively, stoichiometric imbalances of the proteasomal subunits and PSMD9 status have a cascading effect on the luminal MCF7 breast cancer cell state.

Similar articles

References

    1. Glickman, M. H. & Ciechanover, A. The ubiquitin-proteasome proteolytic pathway: destruction for the sake of construction. Physiol. Rev.82, 373–428 (2002). - PubMed
    1. Gupta, I., Singh, K., Varshney, N. K. & Khan, S. Delineating crosstalk mechanisms of the ubiquitin proteasome system that regulate apoptosis. Front. Cell Dev. Biol.6, 1–25 (2018). - PMC - PubMed
    1. Marshall, R. S. & Vierstra, R. D. Dynamic regulation of the 26S proteasome: from synthesis to degradation. Front. Mol. Biosci.6, 40 (2019). - PMC - PubMed
    1. Davies, K. J. A. Degradation of oxidized proteins by the 20S proteasome. Biochimie83, 301–310 (2001). - PubMed
    1. Deshmukh, F. K., Yaffe, D., Olshina, M. A., Ben-Nissan, G. & Sharon, M. The contribution of the 20s proteasome to proteostasis. Biomolecules9, 190 (2019). - PMC - PubMed

MeSH terms

Substances