. 2025 Jan 15;8(1):56.
doi: 10.1038/s42003-025-07463-8.

Dissection of the long-range circuit of the mouse intermediate retrosplenial cortex

Affiliations

Dissection of the long-range circuit of the mouse intermediate retrosplenial cortex

Yuxiao Li et al. Commun Biol. .

Abstract

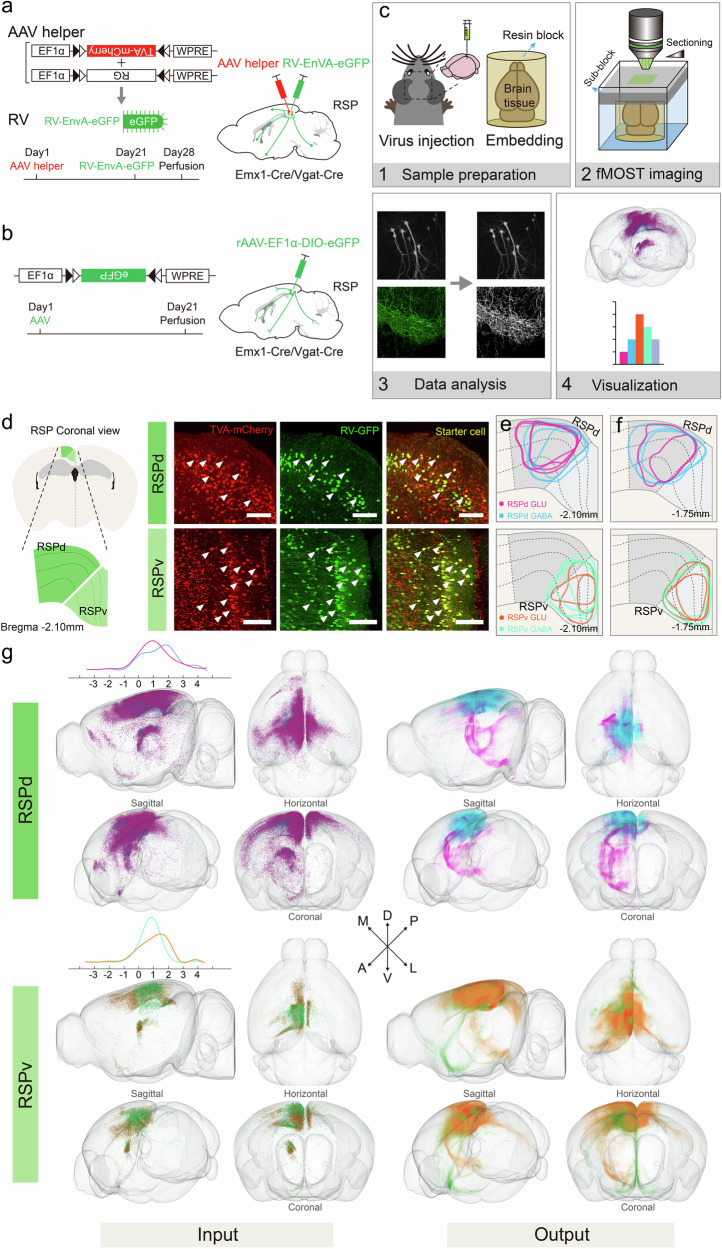
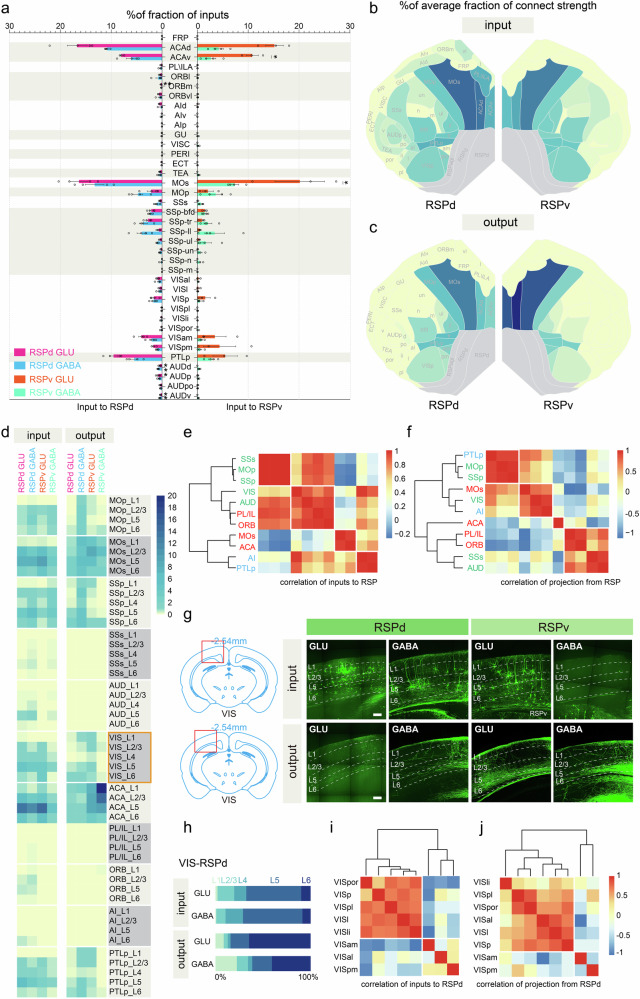
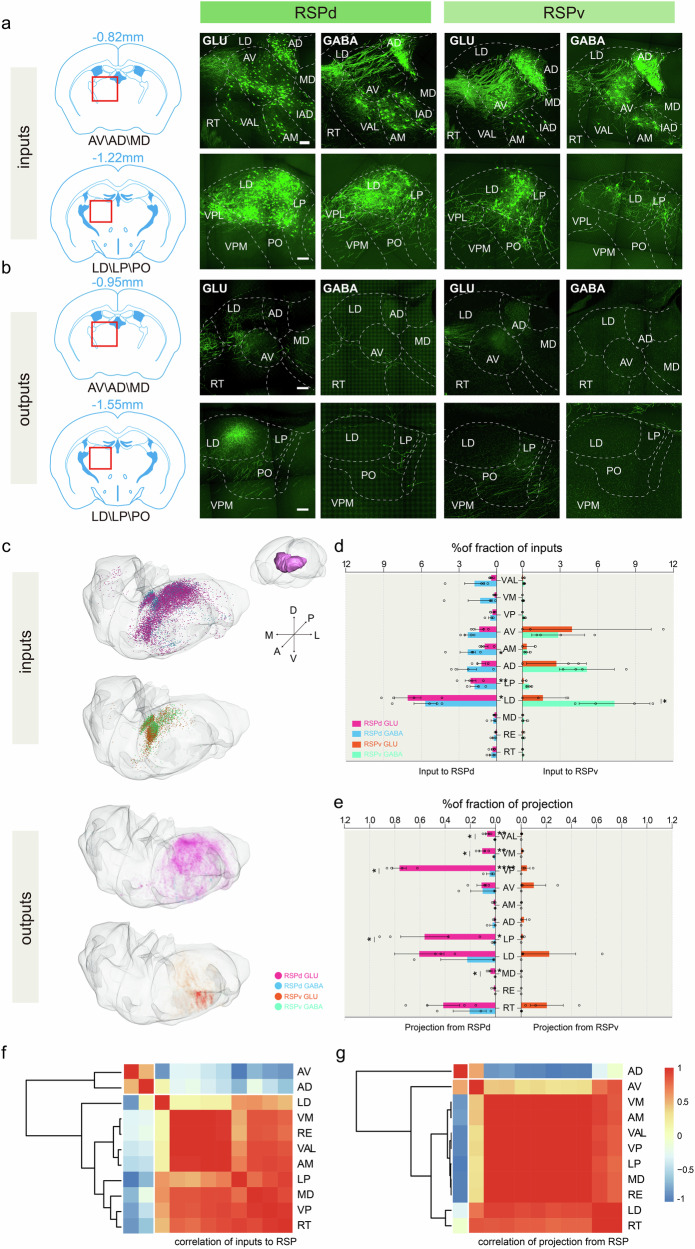
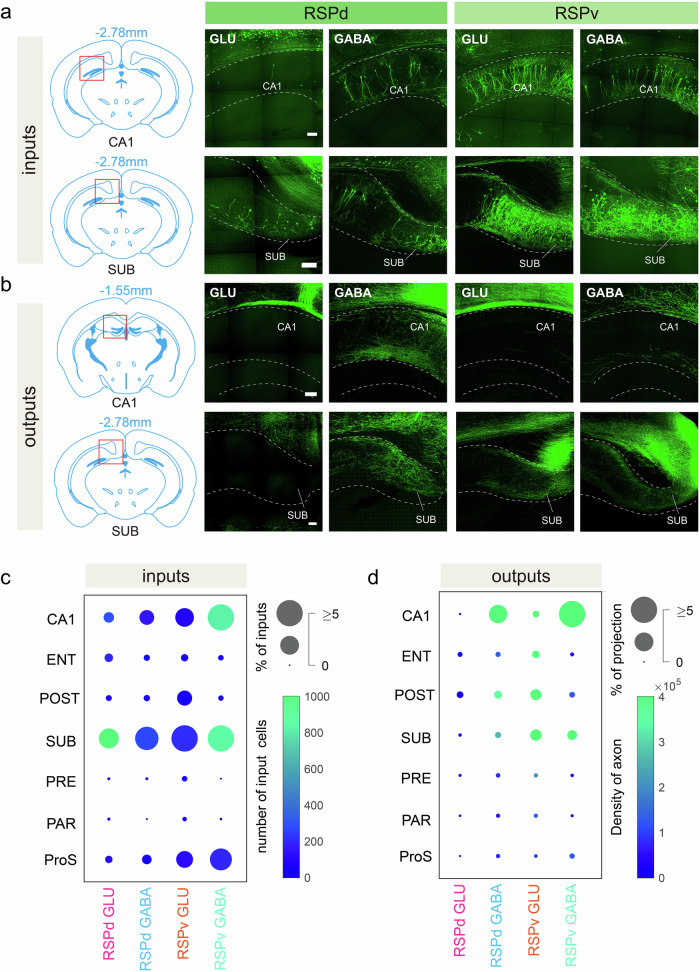
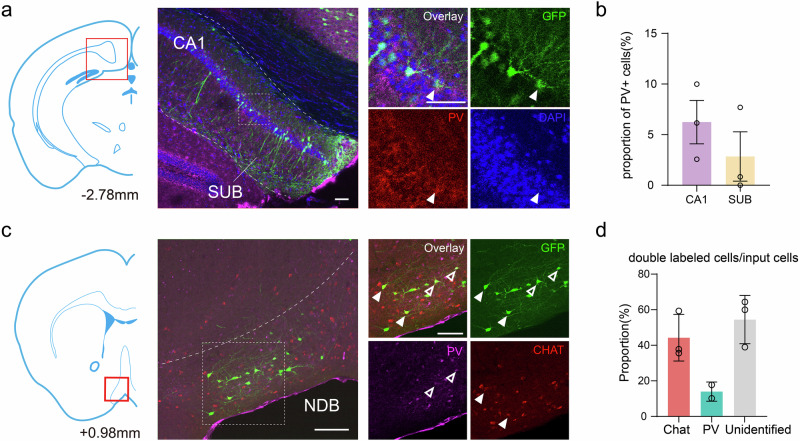
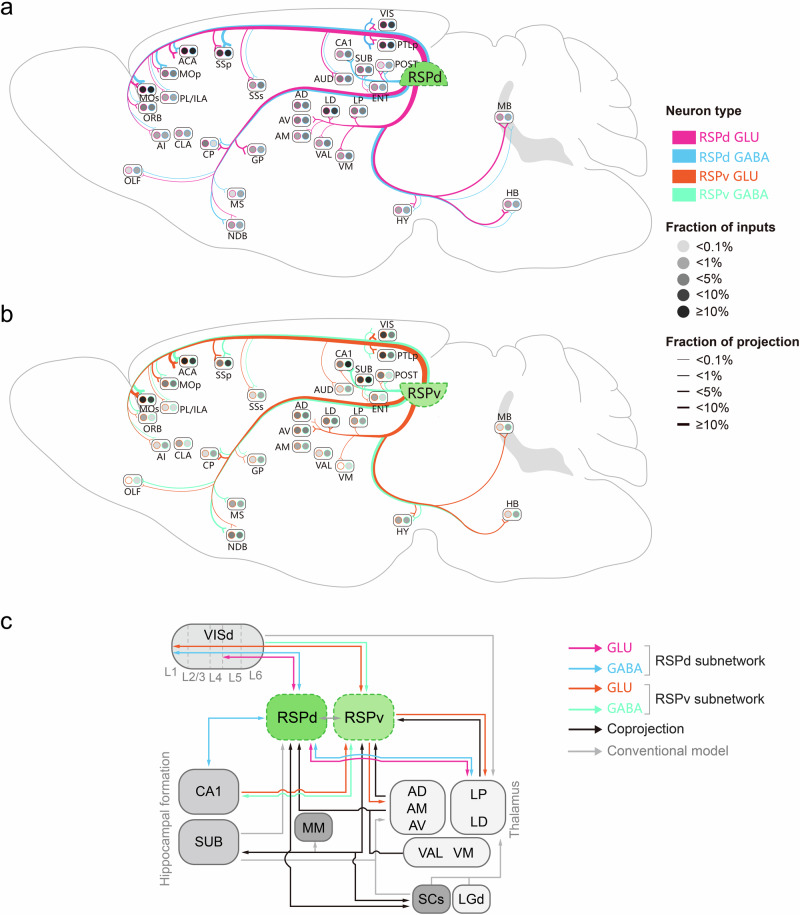
The retrosplenial cortex (RSP) is a complex brain region with multiple interconnected subregions that plays crucial roles in various cognitive functions, including memory, spatial navigation, and emotion. Understanding the afferent and efferent connectivity of the RSP is essential for comprehending the underlying mechanisms of its functions. Here, via viral tracing and fluorescence micro-optical sectioning tomography (fMOST), we systematically investigated the anatomical organisation of the upstream and downstream circuits of glutamatergic and GABAergic neurons in the dorsal and ventral RSP. The cortical connections of the RSP show laminar organisation in which the input neurons are distributed more in the deeper layers of the upstream cortex. Although different types of neurons have similar upstream circuits, GABAergic neurons show bidirectional connections with the hippocampus, whereas glutamatergic neurons only show unidirectional connections. Moreover, GABAergic neurons receive more inputs from the primary sensory cortex than from the prefrontal cortex and association cortex. The dorsal and ventral subregions have preferred circuits such that the dorsal RSP exhibits spatially topological connections with the dorsal visual cortex and lateral thalamus. The systematic study on long-range connections across RSP subregions and cell types may provide useful information for future revealing of RSP working mechanisms.


Conflict of interest statement

Competing interests: The authors declare no competing interests. Ethical approval: All animal experiments were approved by the Animal Ethics Committee of Hainan University.

Figures

Fig. 1
Fig. 1. The connectome of distinct RSP subregions.
a, b Schematic illustrating the viral tracing for input (a) and output (b) circuits to type-specific neurons in RSP. c Schematic of whole-brain mapping and data processing. Step 1: viral tracing and sample preparation; Step 2: fMOST imaging; Step 3: data processing including soma identification (upper) and axonal fibre analysis (bottom); Step 4: 3D visualisation and quantitative statistics. d Anatomical location of injection sites in two subregions of RSP. The coronal section showed the labelled neurons with mCherry and eGFP. Scale bar: 100 μm. e, f Location of all injection sites corresponding panels of the reference atlas. e represents input inject sites; f represents output inject sites. Different colours represent different RSP subregions and neuron types. g Three-dimensional visualisation depicting input cells and axonal projection of both glutamatergic and GABAergic neurons in RSPd and RSPv in representative samples. The graph in the upper left represents the proportion of cells corresponding to the bregma position. The x-axis represents the bregma position, and the y-axis represents the proportion of cells. Colours indicate input cells or fibres from different types of neurons: RSPd GLU, pink; RSPd GABA, blue; RSPv GLU, orange; RSPv GABA, green.
Fig. 2
Fig. 2. Identification of input cells and axon projection in two RSP subregions.
a Matrix displaying the brain regions projecting to RSP subregions. b The axonal projections from glutamatergic and GABAergic neurons. Each row represents the mean fraction of total inputs or projection signals per structure in each sample. c, d Comparison of inputs (c) and projection (d) between glutamatergic and GABAergic neurons within the same target region and between different target regions. Each point represents the proportion of neuronal inputs or outputs for each subregion or specific type of neuron. The red line indicates a 95% confidence interval.
Fig. 3
Fig. 3. Isocortex-RSP connectivity.
a The 39 subregions in the isocortex projects to RSPd (left) and RSPv (right). Two colours represent inputs to glutamatergic and GABAergic neurons, respectively. One-way ANOVA followed by Tukey’s post hoc tests. *p < 0.05, **p < 0.01, ****p < 0.0001. Mean ± SEM. RSPd GLU, n = 4; RSPd GABA, n = 4; RSPv GLU, n = 3; RSPv GABA, n = 4. b, c Topographic distribution of isocortex-RSP inputs (b) and axonal projections (c) to RSP subregions. The shade of the colour indicates the mean fraction of connection strength. d The connectivity between RSP and layer distribution of the whole isocortex. e, f Correlation and hierarchical clustering analysis depicting the similarities and variances in isocortex-RSP connectivity between RSP subregions. The heatmap represents Pearson’s correlation coefficient matrix. g Representative images of input cells (upper) and projecting axons (bottom) from RSP subregions to the visual area (100 μm thick coronal slice). Scale bar: 100 μm. h The connectivity between RSPd and layer distribution of the VIS. i, j Correlation and hierarchical clustering illustrating the variances in brain regions connected with inputs (i) and projections (j) in VIS.
Fig. 4
Fig. 4. The connectivity between the thalamus and RSP.
a, b Representative images of input cells (a) and projecting axons (b) from RSP subregions to the thalamus (100 μm thick coronal slice). Left: anatomical position of subregions. Right: RV-eGFP-labelled input cells in the thalamus. Scale bar: 100 μm. c Three-dimensional visualisation of the thalamus depicting input cells and axonal projection of both glutamatergic and GABAergic neurons in RSP subregions in representative samples. d, e The 11 subregions in thalamus input to RSP subregions (d) and project from RSP subregions (e). Different colours represent different RSP subregions and neuron types. One-way ANOVA followed by Tukey’s post hoc tests. *p < 0.05, **p < 0.01, ****p <  0.0001. Mean ± SEM. Input: RSPd GLU, n = 4; RSPd GABA, n = 4; RSPv GLU, n = 3; RSPv GABA, n = 4. Output: RSPd GLU, n = 4; RSPd GABA, n = 3; RSPv GLU, n = 3; RSPv GABA, n = 3. f, g Correlation and hierarchical clustering showing the variances in brain regions connected with inputs (f) and projections (g) in the thalamus. The heatmap represents Pearson’s correlation coefficient matrix.
Fig. 5
Fig. 5. Hippocampal formation-RSP circuit.
a, b Representative images of input cells (a) and projection axons (b) from RSP subregions to the HPF (100 μm thick coronal slice). Left: position of the images on the right. Right: RV-eGFP-labelled input cells in the HPF. Scale bar: 100 μm. c, d Mean proportion of HPF inputs (c) and axonal projections (d) to RSP subregions, where different colours represent connection strength. Input: RSPd GLU, n = 4; RSPd GABA, n = 4; RSPv GLU, n = 3; RSPv GABA, n = 4. Output: RSPd GLU, n = 4; RSPd GABA, n = 3; RSPv GLU, n = 3; RSPv GABA, n = 3.
Fig. 6
Fig. 6. Modulation of GABAergic neurons in the RSPv by multiple neurotransmitters.
a Immunohistochemical staining of PV+ neurons input from CA1 and SUB to RSPv, respectively. A three-panel present RV, anti-PV, and overlay. The arrows point out PV+ input cells. Scale bar: 200 μm (CA1, n = 3; SUB, n = 3). b Proportion of PV+ neurons among RV-eGFP-labelled neurons in CA1 and SUB. c Both PV+ neurons and cholinergic neurons in the NDB form monosynaptic inputs to GABAergic neurons in RSP. Scale bar: 200 μm (Chat, n = 3; PV+, n = 3). d Quantification of eGFP-labelled neurons that are cholinergic and PV+.
Fig. 7
Fig. 7. Connectome schematic of the glutamatergic and GABAergic neurons in the distinct RSP subregions.
a, b Whole-brain schematic of the inputs and projection of glutamatergic and GABAergic neurons in the RSPd (a) and RSPv (b). The colour of the outline of the point represents two targeted cell types. The points represent the inputs in each brain region, where colours reflect connectivity strength. The lines represent projection in each brain area, where the line thickness reflects the connectivity strength. The demarcations and annotations of brain regions are based on the Allen Reference Atlas. c Refined connectivity model of the RSPd and RSPv subnetworks. RSPd and RSPv mediated circuits are shown in different colours, the coprojections are shown in black, and the known circuits are shown in grey.

References

    1. Vann, S. D., Aggleton, J. P. & Maguire, E. A. What does the retrosplenial cortex do? Nat. Rev. Neurosci.10, 792–802 (2009). - PubMed
    1. Valenstein, E. et al. Retrosplenial amnesia. Brain110, 1631–1646 (1987). - PubMed
    1. Morris, R., Pandya, D. N. & Petrides, M. Fiber system linking the mid-dorsolateral frontal cortex with the retrosplenial/presubicular region in the rhesus monkey. J. Comp. Neurol.407, 183-192 (1999). - PubMed
    1. Mitchell, A. S., Czajkowski, R., Zhang, N., Jeffery, K. & Nelson, A. J. D. Retrosplenial cortex and its role in spatial cognition. Brain Neurosci. Adv.2, 2398212818757098 (2018). - PMC - PubMed
    1. Keshavarzi, S. et al. Multisensory coding of angular head velocity in the retrosplenial cortex. Neuron110, 532–543.e539 (2022). - PMC - PubMed

LinkOut - more resources