. 2025 Mar;32(3):520-530.
doi: 10.1038/s41594-024-01457-6. Epub 2025 Jan 15.

Dynamic PRC1-CBX8 stabilizes a porous structure of chromatin condensates

Affiliations

Dynamic PRC1-CBX8 stabilizes a porous structure of chromatin condensates

Michael Uckelmann et al. Nat Struct Mol Biol. 2025 Mar.

Abstract

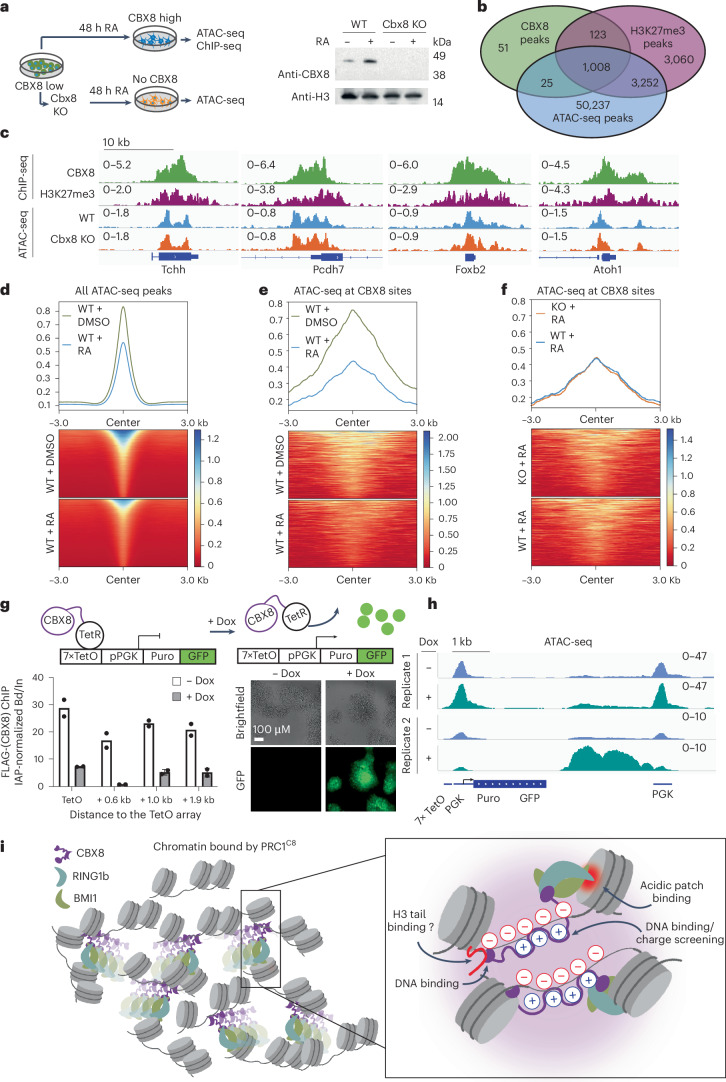
The compaction of chromatin is a prevalent paradigm in gene repression. Chromatin compaction is commonly thought to repress transcription by restricting chromatin accessibility. However, the spatial organization and dynamics of chromatin compacted by gene-repressing factors are unknown. Here, using cryo-electron tomography, we solved the three-dimensional structure of chromatin condensed by the polycomb repressive complex 1 (PRC1) in a complex with CBX8. PRC1-condensed chromatin is porous and stabilized through multivalent dynamic interactions of PRC1 with chromatin. Mechanistically, positively charged residues on the internally disordered regions of CBX8 mask negative charges on the DNA to stabilize the condensed state of chromatin. Within condensates, PRC1 remains dynamic while maintaining a static chromatin structure. In differentiated mouse embryonic stem cells, CBX8-bound chromatin remains accessible. These findings challenge the idea of rigidly compacted polycomb domains and instead provide a mechanistic framework for dynamic and accessible PRC1-chromatin condensates.


Conflict of interest statement

Competing interests: The authors declare no conflicts of interest.

Figures

Fig. 1
Fig. 1. The molecular structure of PRC1–chromatin condensates is porous and accessible to macromolecules.
a, Schematics introducing the workflow. b, SDS–PAGE of the purified PRC1C8 complex that includes RING1b-, BMI1- and MBP-tagged CBX8. c, Size exclusion chromatography of the purified PRC1C8. d, An in vitro ubiquitylation assay comparing PRC1C8 with a RING1b–BMI1 heterodimer. Samples in lanes 2 and 3 included E1, E2, ubiquitin and ATP. Ubiquitylation is detected by western blot using an anti-H2A antibody. Representative of two independent repeats. e, Chromatin condensates induced by the PRC1C8 complex and the individual proteins, visualized by confocal (left and center) and phase contrast (right, from independent experiments) microscopy. CBX8 is GFP labeled, and chromatin is Cy5 labeled. Representative results of three repeats. f, Cryo-confocal microscopy of vitrified PRC1C8–chromatin condensates. Representative of two independent repeats. g, Cryo-ET of a PRC1C8–chromatin condensate. Shown is a central slice through the reconstruction (left image) and subtomogram averages (center, bottom) placed in a volume the size of the tomographic slice, at the determined position and orientation (right image). See Supplementary Table 1 for a list of cross-correlation peaks. h, A surface representation of the volume of a subset of the PRC1C8–chromatin condensate structure that is inaccessible to probes of given radii. i, Inaccessible volumes for given probe radii are plotted, with exemplary molecules indicated (in gray) and selected probes colored as in h. For the indicated complexes, the hydrodynamic radius was estimated using resolved domains from published structures (see Methods for PDB accessions) as a minimum size estimate. j, As in g but without PRC1C8. See Supplementary Table 2 for a list of cross-correlation peaks. k, Pairwise distances of each individual nucleosome to its nearest three neighboring nucleosomes in three-dimensional space in tomograms with and without PRC1C8. Only unique pairs are plotted from two tomograms with (+PRC1) and three tomograms without (−PRC1). Box boundaries extend from the 25th to the 75th percentile, the center line indicates the median, and whiskers extend from the 5th to the 95th percentiles. All points are plotted. Significance was tested using a one-way Brown–Forsythe analysis of variance with a Games–Howell post hoc test. ****P < 0.0001 (P values: first <0.0000000000001, second 0.0000000000017 and third 0.0000000000099). Source data
Fig. 2
Fig. 2. PRC1C8 is mobile while chromatin is static within PRC1–chromatin condensates.
a, Titration of chromatin against PRC1C8. Condensates were assessed with a fluorescence widefield microscope imaging a Cy5 label on the chromatin. Presented are representative micrographs of three replicates, including two with MBP-tagged PRC1C8 (presented) and one with GFP-tagged PRC1C8. b, Representative micrographs of FRAP recorded in PRC1C8–chromatin condensates. CBX8 is GFP labeled, and chromatin is Cy5 labeled. The mean fluorescence intensity of the bleached area, normalized to prebleach mean signal, is plotted for every time point. The error bars show the standard deviation from n = 7 (GFP) and n = 8 (Cy5) FRAP measurements recorded from two independent experiments. The GFP signal recovery was fit with an exponential association model, and best-fit values for plateau and fluorescence recovery half time (T1/2) are shown with standard error. n.d., non-determined. c, A schematic representation of the FRAP experiment. Scale bars, 10 μm (a) and 2 μm (b). Source data
Fig. 3
Fig. 3. Multivalent interactions between PRC1C8 and chromatin.
a, Chromatin condensation in response to the whole PRC1C8 complex (RING1b, BMI1 and CBX8) or the individual components CBX8 and the RING1b–BMI1 heterodimer. Representative images from two replicates. b, Intramolecular (purple lines) and intermolecular (green lines) protein–protein interactions mapped within PRC1–chromatin condensates using XL-MS. The data are from three independent replicates. c, PRC1C8 or PRC1 core binding to a fluorescein-labeled 24 bp DNA probe measured by fluorescence polarization. The data points show the mean (baseline subtracted) of three independent replicates, and the error bars indicate the standard error. The continuous line represents the fit to a Hill binding model, when applicable. Kd, dissociation constant. d, Titration of PRC1C8 to unmodified chromatin (top) and H3K27me3-MLA chromatin (bottom) at an identical chromatin concentration (50 ng μl−1 DNA) and 150 mM KCl. The micrographs are representative of two independent replicates. Scale bars, 5 μm. Source data
Fig. 4
Fig. 4. Positive charges in the CBX8 IDRs are required for DNA binding and phase separation.
a, Schematics depicting the different CBX8 mutants used, drawn to scale. b, PRC1C8–chromatin condensates in the context of different CBX8 mutants. Varying concentrations of PRC1C8 were titrated to a constant concentration of C5-labeled reconstituted chromatin (50 ng μl−1). Widefield fluorescence and DIC micrographs are representative of three replicates. c, Quantification of the total area covered by condensates per micrograph for different PRC1C8 mutants and concentrations. The bars represent the means from three independent replicates, and the error bars represent the standard deviation. Scale bar, 5 μm. d, A fluorescence polarization assay measuring the affinity of different PRC1C8 mutants for a fluorescein-labeled 24 bp DNA probe. The data points are the mean (baseline subtracted) of three independent replicates, and the error bars indicate the standard error. The continuous line represents the fit to a Hill binding model, when applicable. e, Model for chromatin condensation by PRC1C8: electrostatic interaction between the CBX8 IDR with DNA provides charge screening and promotes phase separation. Source data
Fig. 5
Fig. 5. CBX8-binding sites on chromatin in mES cells are accessible.
a, Schematics of the experimental setup (left) and anti-CBX8 western blot (right) of wild-type and Cbx8-KO mES cells after 48 h of RA treatment. Representative of two independent replicates. b, Overlap of ATAC-seq peaks and CBX8 and H3K27me3 ChIP-seq peaks. ATAC-seq peaks are defined from two biological replicates. c, ChIP-seq traces for H3K27me3 and CBX8 in wild-type mES cells and representative ATAC-seq traces at four genes in wild-type and CBX8-KO mES cells after 48 h of RA treatment. d, Accessibility changes at all ATAC-seq peaks in wild-type (WT) mES cells, in response to RA treatment. e, Accessibility changes at all CBX8-target sites in wild-type mES cells, in response to RA treatment. f, A comparison of accessibility at CBX8-target sites between wild-type and Cbx8-KO cells after RA treatment. g, Top: schematic representation of the chromosome-integrated reporter. Left: ChIP–qPCR using FLAG antibody (CBX8 is FLAG tagged) at indicated distances from the TetO array, in the presence and absence of Dox treatment for 6 h. The bars represent the mean bound over input (Bd/In) normalized to intracisternal A particle retrotransposon (IAP), and the points represent two replicates. See Extended Data Fig. 8a for ChIP–qPCR using additional antibodies. Right: brightfield and GFP-fluorescence images of the mECS cells before and after Dox treatment. h, ATAC-seq signal reporting accessibility of the integrated locus before and after Dox treatment for 6 days. From left to right: annotated are the TetO array and its proximal PGK promoter that controls the puromycin–GFP reporter gene, and the distal PGK promoter. i, A model in which PRC1 forms multivalent interactions with chromatin, thereby stabilizing chromatin condensates potentially through charge screening of negatively charged DNA by positive charges in the CBX8 IDR. These interactions dynamically change as PRC1 diffuses through condensates. Source data
Extended Data Fig. 1
Extended Data Fig. 1. Quality control of chromatin and protein constructs.
a, MNase digestion of reconstituted Chromatin and a naked DNA (same sequence as used for chromatin reconstitution). DNA fragments post digestion are resolved on a 1.2 % Agarose gel. Protected bands indicating mono- and di-nucleosome core particles (NCP and diNCP) are indicated by the arrows. b, 3 ug of each protein complex used in this study resolved on a 4–12% SDS-PAGE gel stained with Coomassie. c, Ubiquitylation activity of each protein complex used in this study visualized on a western blot. All samples include UBA1, UBCH5C, Ubiquitin, ATP and 1 μM chromatin (nucleosome concentration). Blot is representative of two independent experiments. d, Phase separation experiment comparing chromatin condensation activity of PRC1C8 with MBP-tagged CBX8 to PRC1C8 with the tag cleaved. Source data
Extended Data Fig. 2
Extended Data Fig. 2. PRC1 complexes used in this study are monodispersed.
HPLC elution profiles from a Shim-pack Bio Diol 200 HPLC column for each of the purified protein complexes, as indicated.
Extended Data Fig. 3
Extended Data Fig. 3. Nucleosomes in PRC1C8-chromatin condensates show no orientation bias towards neighbouring nucleosomes.
a, Low-magnification micrograph showing examples of dense regions suspected to be condensates (dashed circles). Tomograms were collected at the borders of regions such as these. Micrographs are from the same gird from which tomograms were collected. Scale bar = 500 nm. b, Structures of the template used for template matching (left), the averaged structure after template matching (middle) and the final structure after the subtomogram averaging routine (right) with the related Fourier shell correlation curve (bottom). c, Orientations of nucleosomes towards neighbouring nucleosomes within a cut-off of 20 nm. Individual points represent nucleosomes and lines between points are coloured according to the relative orientation of neighbouring nucleosomes as indicated in the colour key (left). d, Distribution of nucleosome-nucleosome orientation for the three nearest neighbours and the 150th neighbour of each nucleosome in tomogram #1. Colours correspond to the same respective orientations as in c. Source data
Extended Data Fig. 4
a, Representative low-magnification cryo-EM micrograph of a grid square with vitrified chromatin in absence of PRC1. Micrographs from one experiment. Scale bar = 10 μm. b, Same as (a) but with PRC1. Black arrows indicate presumed condensates. Red crosses relate to stage movement and do not indicate features in the context of this figure. c, The same cryo-tomogram as in Fig. 1j, of chromatin in the absence of PRC1, with dense regions highlighted. d, Distances to the three nearest neighbouring nucleosomes, where +PRC1 as in Fig. 1k and -PRC1 shows distances for the highlighted dense region in c. Box boundaries extend from 25th to 75th percentile, whiskers from 5–95%. Centre line indicates the mean. All points are plotted. Source data
Extended Data Fig. 5
Extended Data Fig. 5. PRC1C8 is mobile while chromatin is static within PRC1–chromatin condensates.
a Chromatin condensation in response to variations in salt and PRC1 concentration measured by confocal microscopy using Cy5-labelled chromatin at a constant concentration of 50 ng/μl DNA (approximately 400 nM nucleosomes). Micrographs from one experiment. b, Representative micrographs of FRAP recorded in PRC1C8-chromatin condensates, where within this complex CBX8 is untagged. PRC1C8 is labelled with ATTO488 and chromatin is Cy5 labelled. The mean fluorescence intensity of the bleached area, normalised to the pre-bleach mean signal, is plotted for every time point. Error bars show standard deviation from n = 6 (ATTO488) and n = 7 (Cy5) FRAP measurements that were recorded from four independent experiments that were carried out on different days. The ATTO488 signal recovery was fit with an exponential association model, best fit values for Plateau and fluorescence recovery half time (T1/2) are shown. The lower limits of the 95% confidence interval are presented in parentheses (the upper boundaries could not be determined confidently). c, Representative micrographs of FRAP recorded in PRC1C8-chromatin condensates, where within this complex CBX8 includes an N-terminal MBP-tag. PRC1C8 is labelled with ATTO488 and chromatin is Cy5 labelled. The mean fluorescence intensity of the bleached area, normalised to the pre-bleach mean signal, is plotted for every time point. Error bars show standard deviation from n = 7 (ATTO488) and n = 6 (Cy5) FRAP measurements recorded from four independent experiments that were carried out on different days. The ATTO488 signal recovery was fit with an exponential association model, best fit values for Plateau and fluorescence recovery half time (T1/2) are shown with SEM. d, Images of PRC1C8-chromatin condensates, where CBX8 is MBP-tagged. Transmitted light (greyscale), Cy5 fluorescence (magenta, chromatin) and ATTO488 fluorescence (green, PRC1C8 are shown. The PRC1C8-chromatin condensates were imaged in radical scavenger buffer (top) and in chromatin condensation buffer (bottom). e, FRAP as in (c) using a radical scavenger buffer. Means represent the average signal over 3 and 5 replicates of chromatin and PRC1C8 FRAP, respectively, and error bars represent SEM. The recovery curve was fitted with an exponential association model, best fit values for Plateau and fluorescence recovery half time (T1/2) are shown. f, As in (e) but using PRC1C8 with no MBP tag on CBX8. Scale bars in all panels are 5 μm. Source data
Extended Data Fig. 6
Extended Data Fig. 6. Condensates can be detected at physiologically relevant PRC1C8 concentrations.
a, An illustration of single molecule confocal microscopy. Individual condensates (in grey) are detected when diffusing through the confocal volume (in blue) and emitting GFP fluorescence (in green). b, Top: representative trace tracking GFP signal over time for samples with 500 nM GFP-labelled PRC1C8 and chromatin (200 nM nucleosome concentration). Traces show a 5 min window from a 20 min experiment. Blue lines show the raw GFP signal and orange lines show the GFP signal after low-pass filtering using a Butterworth filter. Green dots indicate the maxima of the detected peaks. Bottom: same as the top plot, but in the absence of chromatin. c, GFP peak counts at different PRC1C8 concentrations. Data from two replicates are shown. Bars indicate the mean of two independent replicates that were carried out on different days and individual data points are presented. d, Same experiment as in Fig. 3b, but without chromatin. Source data
Extended Data Fig. 7
Extended Data Fig. 7. The nucleosome acidic patch is required for efficient PRC1-chromatin phase separation.
a, Phase separation of X. laevis wildtype and acidic patch mutant chromatin in response to increasing concentrations of PRC1C8 wildtype. DIC micrographs are representative of two replicates. b, Same as (a), but with the PRC1C8KR21A mutant. c, Same as (a) but with the PRC1C8ΔChromo mutant. All scale bars = 10 μm.
Extended Data Fig. 8
Extended Data Fig. 8. CBX8-binding sites on chromatin in mES cells are accessible.
a, A GFP reporter system, where in the absence of doxycycline (Dox), the TetR-CBX8 fusion is recruited to the TetO array, but not in the presence of Dox. ChIP-qPCR in the presence and absence of Dox treatment using RING1B antibody at indicated distances from a chromosome-integrated TetO array (left), at control genes (right) and using FLAG (CBX8) antibodies at control genes (middle). Bars represented the bound over input (Bd/In) normalised to the IAP gene and the dots represent individual data points. b, ATAC-seq signal at the HoxA locus of the reporter-integrated mECS cell line before and after dox treatment. Two independent replicates are shown. Source data

Update of

References

    1. Misteli, T. The self-organizing genome: principles of genome architecture and function. Cell183, 28–45 (2020). - PMC - PubMed
    1. Schuettengruber, B., Bourbon, H.-M., Di Croce, L. & Cavalli, G. Genome regulation by polycomb and trithorax: 70 years and counting. Cell171, 34–57 (2017). - PubMed
    1. Blackledge, N. P., Rose, N. R. & Klose, R. J. Targeting Polycomb systems to regulate gene expression: modifications to a complex story. Nat. Rev. Mol. Cell Biol.16, 643–649 (2015). - PMC - PubMed
    1. Eskeland, R. et al. Ring1B compacts chromatin structure and represses gene expression independent of histone ubiquitination. Mol. Cell38, 452–464 (2010). - PMC - PubMed
    1. Francis, N. J., Kingston, R. E. & Woodcock, C. L. Chromatin compaction by a polycomb group protein complex. Science306, 1574–1577 (2004). - PubMed

LinkOut - more resources