

doi: 10.1038/s41375-024-02511-4.
Epub 2025 Jan 15.
Multi-omic analysis of chronic myelomonocytic leukemia monocytes reveals metabolic and immune dysregulation leading to altered macrophage polarization
Affiliations
- PMID: 39815051
- PMCID: PMC11879862
- DOI: 10.1038/s41375-024-02511-4
Item in Clipboard
Multi-omic analysis of chronic myelomonocytic leukemia monocytes reveals metabolic and immune dysregulation leading to altered macrophage polarization
Leukemia.
2025 Mar.
No abstract available
Conflict of interest statement
Competing interests: The authors declare no competing interests. Ethics approval and consent to participate: PBMNC samples were obtained from CMML patients treated at The Christie NHS Foundation Trust (Manchester, UK) recruited to the Manchester Cancer Research Centre Tissue Biobank (initiated with the approval of South Manchester Research Ethics Committee). PBMNCs from age-matched Healthy volunteers were used as controls. All patients and controls gave informed consent according to the Declaration of Helsinki. The study was approved by the UK Health Research Authority (REC: 19/LO/0564).
Figures
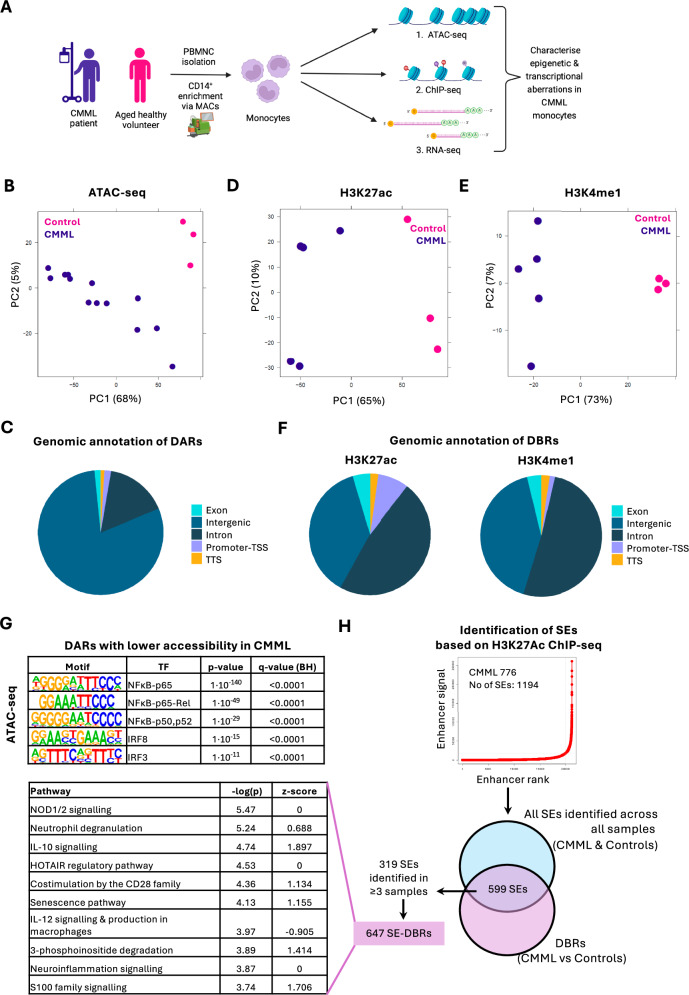
A Schematic outline of the study investigating altered epigenetic and transcriptional networks involved in CMML monocytes. B Principal component analysis (PCA) of ATAC-Seq data. C Genomic annotation of differentially accessible regions (DARs). D, E PCA of H3K27ac (D) and H3K4me1 (E) ChIP-seq data. F Genomic annotation of H3K27ac (left) and H3K4me1 (right) differentially bound regions (DBRs). G Motifs were most significantly enriched in DARs with lower accessibility in CMML compared to healthy controls. TF transcription factor, BH Benjamini–Hochberg correction. H Diagram illustrating Super Enhancer (SE) analysis workflow. SEs were called with the ROSE algorithm (CMML sample 776 shown as an example) and filtered for overlap with H3K27ac DBRs (599 SEs). Then, we focused on SEs overlapping DBRs found in ≥3 samples (319 SEs). The H3K27ac DBRs (647, SE-DBRs) that were part of 319 SEs were then mapped to genes. Pathway analysis performed (shown on the left) on genes that SE-DBRs mapped to, performed with ingenuity pathway analysis (IPA).
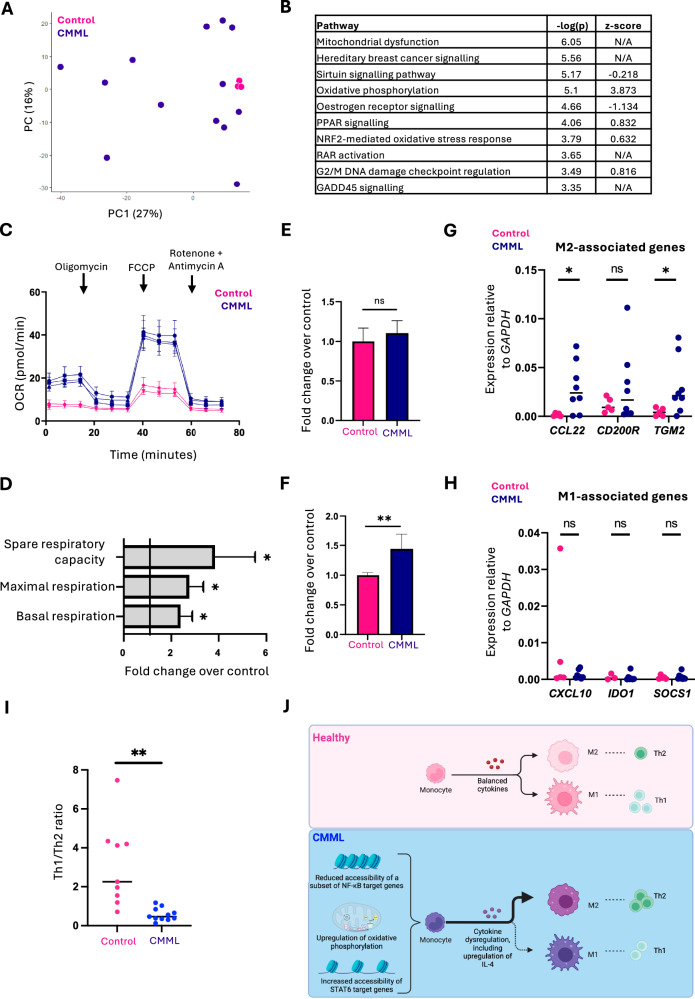
A PCA of RNA-seq data. B Pathway analysis of RNA-seq data, performed with IPA. Top ten pathways (based on p value) are shown. C Oxygen consumption rate (OCR) data for mitochondrial stress test. Representative graph shown (see also Supplementary Fig. 4). Data were normalized using DNA content as determined by CyQUANT assay and multiplied by a scale factor. D Change in selected respiratory parameters in CMML monocytes relative to healthy monocytes, as determined by mitochondrial stress tests (N = 7, CMML; N = 4, Controls). *p < 0.05. E, F MitoTracker Green FM (E) and MitoTracker Red CMXRos (F) fluorescence in CMML and control monocytes, as determined by flow cytometry. Data were plotted as fold change in mean fluorescence intensity over average signal in healthy controls (N = 7, CMML; N = 4, Controls). **p < 0.01. G, H Quantitation of expression levels of genes associated with the M2 (G) or M1 (H) phenotype in day 5 M0 monocyte-derived macrophages (MDMs) by qRT-PCR. I Th1/Th2 ratio in control and CMML PBMNCs at day 0, as determined by flow cytometry. **p < 0.01. J Working model: Healthy monocytes can differentiate towards either M2 (“anti-inflammatory”) or M1 (“proinflammatory”) macrophages, which is regulated by cytokine milieu. CMML monocytes exhibit an innate bias towards an M2 macrophage phenotype, which is presumably mediated by the cytokine imbalance observed in CMML plasma and cell-intrinsic features. This bias towards M2 macrophages then translates into a relative increase in Th2 cells at the expense of Th1 cells.
References
-
- Itzykson R, Kosmider O, Renneville A, Morabito M, Preudhomme C, Berthon C, et al. Clonal architecture of chronic myelomonocytic leukemias. Blood. 2013;121:2186–98. - PubMed
Grants and funding
LinkOut - more resources
Full Text Sources
Molecular Biology Databases
