

TOM40 as a prognostic oncogene for oral squamous cell carcinoma prognosis
- PMID: 39815211
- PMCID: PMC11737269
- DOI: 10.1186/s12885-024-13417-w
TOM40 as a prognostic oncogene for oral squamous cell carcinoma prognosis
Abstract
Background: To investigate the role of the translocase of the outer mitochondrial membrane 40 (TOM40) in oral squamous cell carcinoma (OSCC) with the aim of identifying new biomarkers or potential therapeutic targets.
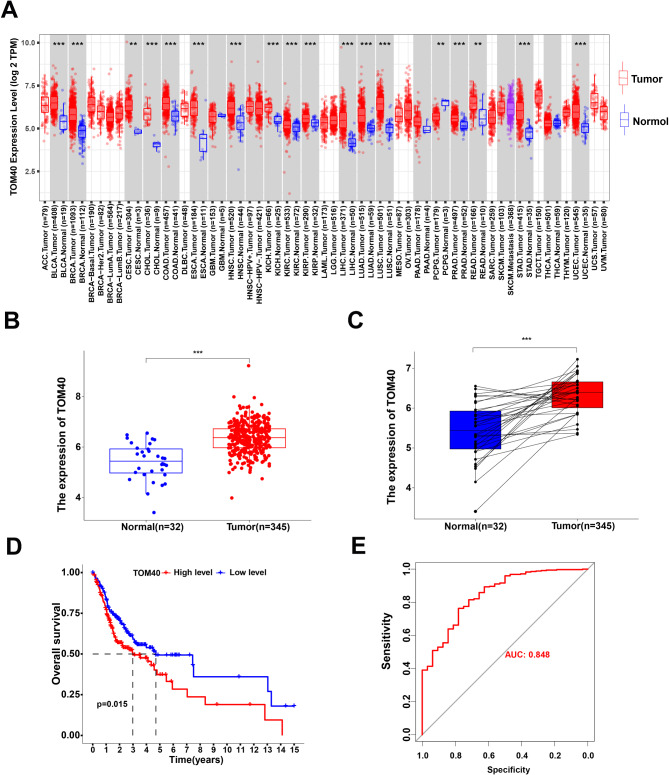
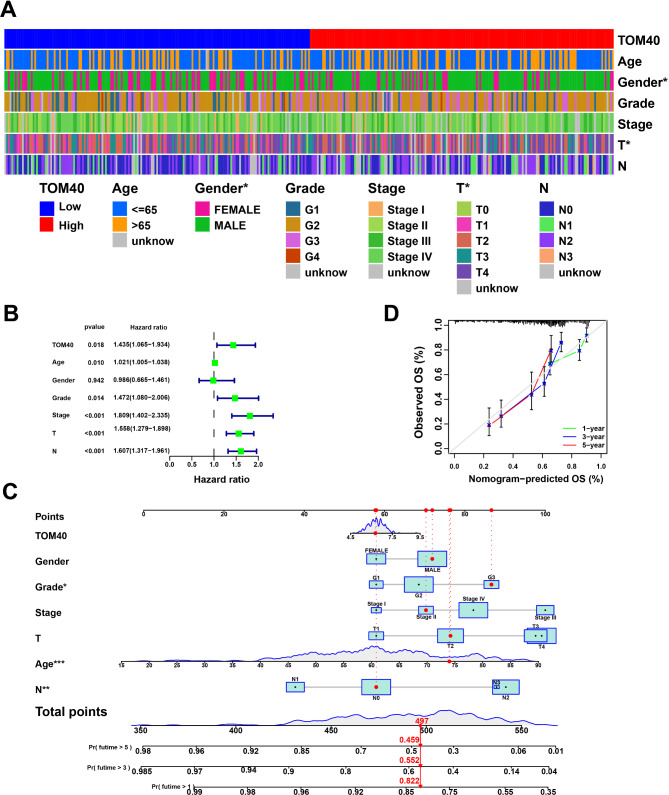
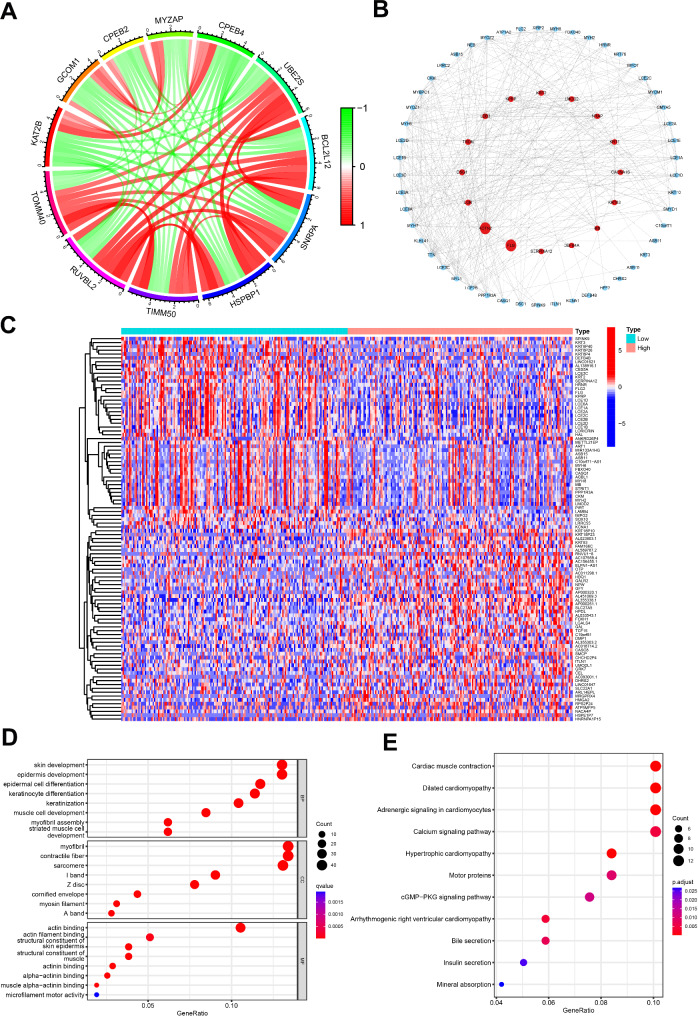
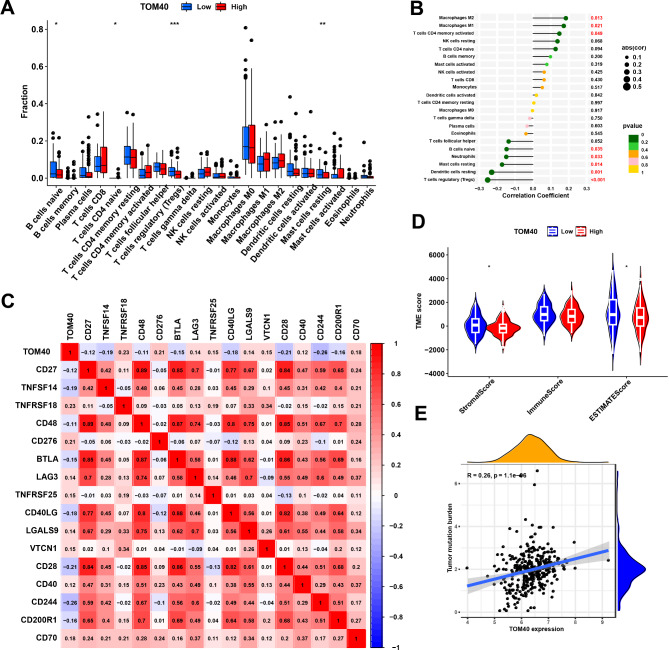
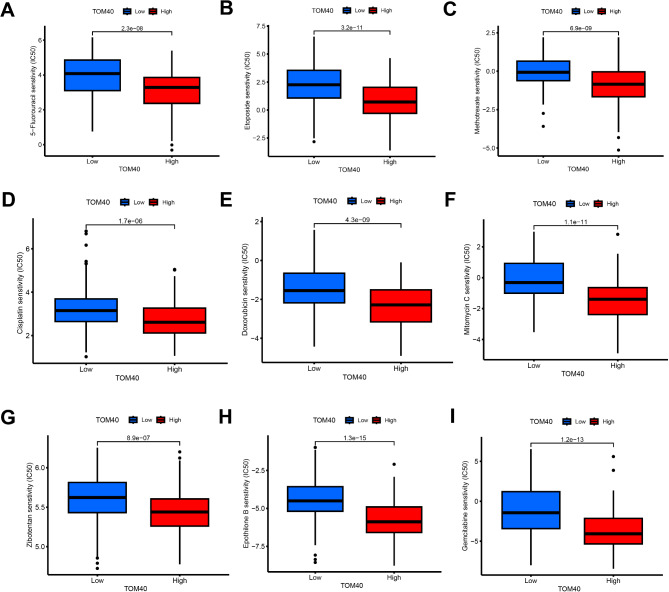
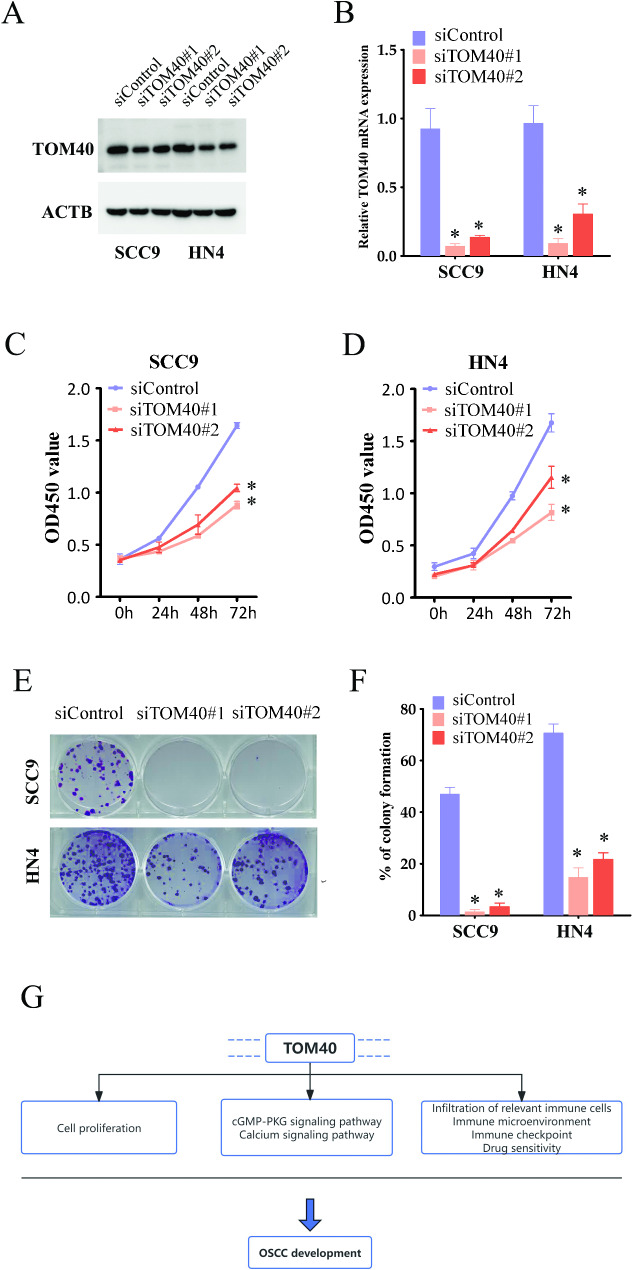
Methods: TOM40 expression level in OSCC was evaluated using datasets downloaded from The Cancer Genome Atlas (TCGA), as well as clinical data. The correlation between TOM40 expression level and the clinicopathological parameters and survival were analyzed in TCGA. The signaling pathways associated with TOM40 were identified through gene set enrichment analysis. A network of genes co-expressed with TOM40 was constructed and functionally annotated by gene ontology (GO) and Kyoto Encyclopedia of Genes and Genomes (KEGG) pathway enrichment analyses. The immune infiltration pattern in OSCC was analyzed in the TCGA-OSCC cohort using the CIBERSORT algorithm. Clinically significant factors of OSCC were screened through the expression levels of TOM40 and a clinically relevant nomogram was constructed. The TCGA-OSCC cohort was divided into the TOM40high and TOM40low groups and the correlation between TOM40 expression level and the sensitivity to frequently used chemotherapeutic drugs was evaluated. CCK-8 and colony formation assays were applied to determine the cell growth.
Results: TOM40 was highly expressed in OSCC tissues and correlated negatively with the overall survival (P < 0.05). Patients with high TOM40 expression level showed worse prognosis. Furthermore, GO and KEGG enrichment analyses of the differentially expressed genes related to TOM40 showed that these genes are mainly associated with immunity and tumorigenesis. Immunological infiltration analysis has found that the expression levels of TOM40 are correlated with the proportions of several immune cells. Moreover, we found that TOM40 knockdown inhibited cell growth in OSCC cell lines.
Conclusions: Our results uncovered that TOM40 is a reliable prognostic marker and therapeutic target in OSCC.
Keywords: Cell growth; OSCC; Prognostic marker; TOM40; Therapeutic target.
© 2024. The Author(s).
Conflict of interest statement
Declarations. Ethics approval and consent to participate: No ethical approval nor informed consent was required in this study due to the public availability of data in the TCGA databases. Consent for publication: Not applicable. Competing interests: The authors declare no competing interests.
Figures
Similar articles
-
IGF2BP2 maybe a novel prognostic biomarker in oral squamous cell carcinoma.Biosci Rep. 2022 Feb 25;42(2):BSR20212119. doi: 10.1042/BSR20212119. Biosci Rep. 2022. PMID: 35129592 Free PMC article.
-
Screening and identification of autophagy-related biomarkers for oral squamous cell carcinoma (OSCC) via integrated bioinformatics analysis.J Cell Mol Med. 2021 May;25(9):4444-4454. doi: 10.1111/jcmm.16512. Epub 2021 Apr 9. J Cell Mol Med. 2021. PMID: 33837652 Free PMC article.
-
Identification of a Gene Prognostic Signature for Oral Squamous Cell Carcinoma by RNA Sequencing and Bioinformatics.Biomed Res Int. 2021 Apr 1;2021:6657767. doi: 10.1155/2021/6657767. eCollection 2021. Biomed Res Int. 2021. PMID: 33869632 Free PMC article.
-
Exploring Renin-angiotensin System Genes as Novel Prognostic Biomarkers for Oral Squamous Cell Carcinoma.Int J Med Sci. 2025 Apr 28;22(10):2470-2487. doi: 10.7150/ijms.112735. eCollection 2025. Int J Med Sci. 2025. PMID: 40386053 Free PMC article.
-
Prognosis, Controversies and Assessment of Bone Erosion or Invasion of Oral Squamous Cell Carcinoma.Diagnostics (Basel). 2025 Jan 4;15(1):104. doi: 10.3390/diagnostics15010104. Diagnostics (Basel). 2025. PMID: 39795632 Free PMC article. Review.
References
-
- Sarode G, Maniyar N, Sarode SC, Jafer M, Patil S, Awan KH. Epidemiologic aspects of oral cancer. DM-DIS MON. 2020;66(12):100988. - PubMed
-
- Sung H, Ferlay J, Siegel RL, Laversanne M, Soerjomataram I, Jemal A, Bray F. Global Cancer statistics 2020: GLOBOCAN estimates of incidence and Mortality Worldwide for 36 cancers in 185 countries. CA-CANCER J CLIN. 2021;71(3):209–49. - PubMed
-
- Chamoli A, Gosavi AS, Shirwadkar UP, Wangdale KV, Behera SK, Kurrey NK, Kalia K, Mandoli A. Overview of oral cavity squamous cell carcinoma: risk factors, mechanisms, and diagnostics. ORAL ONCOL. 2021;121:105451. - PubMed
MeSH terms
Substances
Grants and funding
LinkOut - more resources
Full Text Sources
Medical
