

Causal analysis for multivariate integrated clinical and environmental exposures data
- PMID: 39815256
- PMCID: PMC11736916
- DOI: 10.1186/s12911-025-02849-4
Causal analysis for multivariate integrated clinical and environmental exposures data
Erratum in
-
Correction: Causal analysis for multivariate integrated clinical and environmental exposures data.BMC Med Inform Decis Mak. 2025 Feb 13;25(1):78. doi: 10.1186/s12911-025-02911-1. BMC Med Inform Decis Mak. 2025. PMID: 39948606 Free PMC article. No abstract available.
Abstract
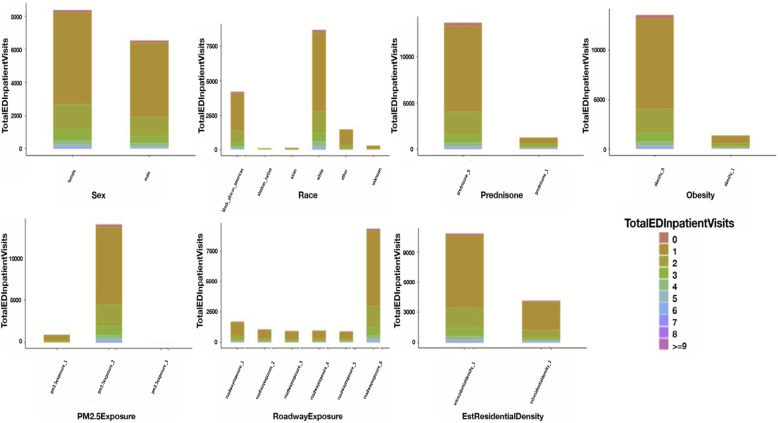
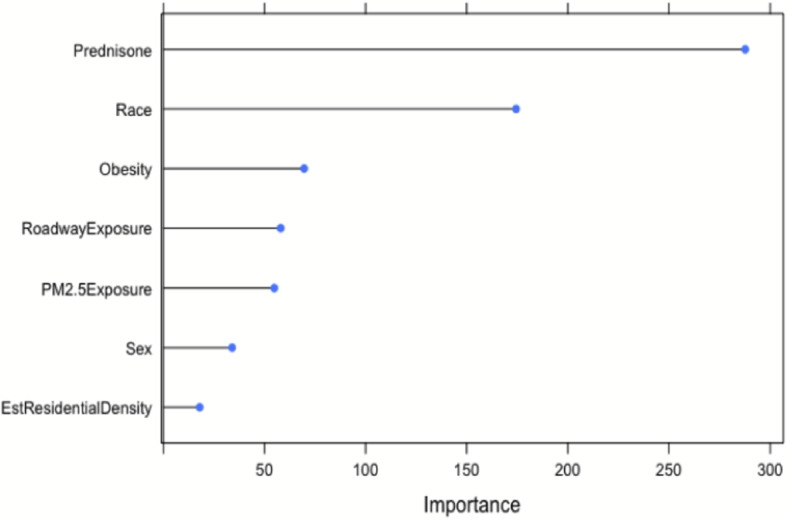
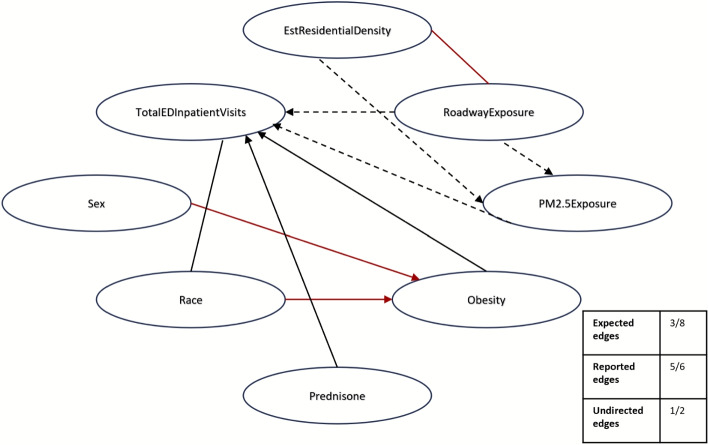
Electronic health records (EHRs) provide a rich source of observational patient data that can be explored to infer underlying causal relationships. These causal relationships can be applied to augment medical decision-making or suggest hypotheses for healthcare research. In this study, we explored a large-scale EHR dataset on patients with asthma or related conditions (N = 14,937). The dataset included integrated data on features representing demographic factors, clinical measures, and environmental exposures. The data were accessed via a service named the Integrated Clinical and Environmental Service (ICEES). We estimated underlying causal relationships from the data to identify significant predictors of asthma attacks. We also performed simulated interventions on the inferred causal network to detect the causal effects, in terms of shifts in probability distribution for asthma attacks.
Keywords: Asthma; Causal inference; Open clinical data; Structure learning.
© 2025. The Author(s).
Conflict of interest statement
Declarations. Ethics approval and consent to participate: A waiver of informed consent for research [45 CFR 46.116(d)] and a waiver of HIPAA authorization [45 CFR 164.512(i)(2)(ii)] were granted by the Institutional Review Board at the University of North Carolina at Chapel Hill (protocol 16-2978). Consent for publication: Not applicable. Competing interests: The authors declare no competing interests.
Figures

References
-
- Pearl J. Causality: models, reasoning, and inference. Economet Theor. 2003;19(675–685):46.
-
- Pearl J. Causal diagrams for empirical research. Biometrika. 1995;82:669–710. 10.1093/biomet/82.4.669.
-
- Pearl J. Causality: models, reasoning, and inference. 2nd ed. New York: Cambridge University Press; 2000. p. 2009.
-
- Rizzi DA. Causal reasoning and the diagnostic process. Theoret Med. 1994;15(3):315–33. - PubMed
-
- Rubin D. Estimating causal effects of treatments in randomized and non randomized studies. J Educ Psychol. 1974;66:688–701. 10.1037/h0037350.
MeSH terms
Grants and funding
LinkOut - more resources
Full Text Sources
Medical
