

Metabolomic in severe traumatic brain injury: exploring primary, secondary injuries, diagnosis, and severity
- PMID: 39815318
- PMCID: PMC11737060
- DOI: 10.1186/s13054-025-05258-1
Metabolomic in severe traumatic brain injury: exploring primary, secondary injuries, diagnosis, and severity
Abstract
Background: Traumatic brain injury (TBI) is a major public health concern worldwide, contributing to high rates of injury-related death and disability. Severe traumatic brain injury (sTBI), although it accounts for only 10% of all TBI cases, results in a mortality rate of 30-40% and a significant burden of disability in those that survive. This study explored the potential of metabolomics in the diagnosis of sTBI and explored the potential of metabolomics to examine probable primary and secondary brain injury in sTBI.
Methods: Serum samples from 59 adult patients with sTBI and 35 age- and sex-matched orthopedic injury controls were subjected to quantitative metabolomics, including proton nuclear magnetic resonance (1H-NMR) and direct infusion/liquid chromatography-tandem mass spectrometry (DI/LC-MS/MS), to identify and quantify metabolites on days 1 and 4 post-injury. In addition, we used advanced analytical methods to discover metabo-patterns associated with sTBI diagnosis and those related to probable primary and secondary brain injury.
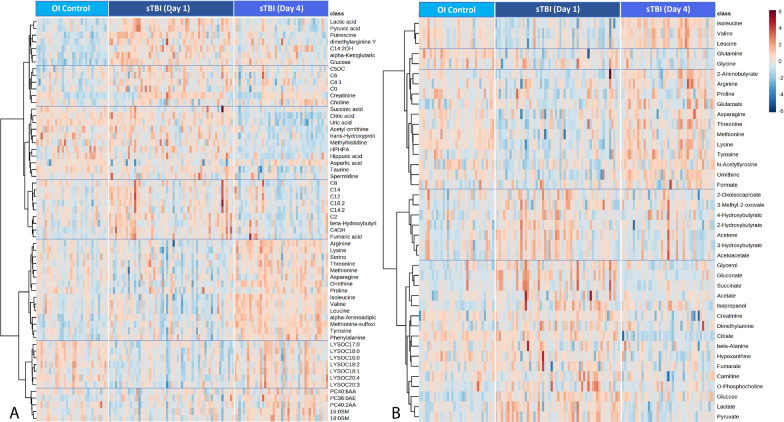
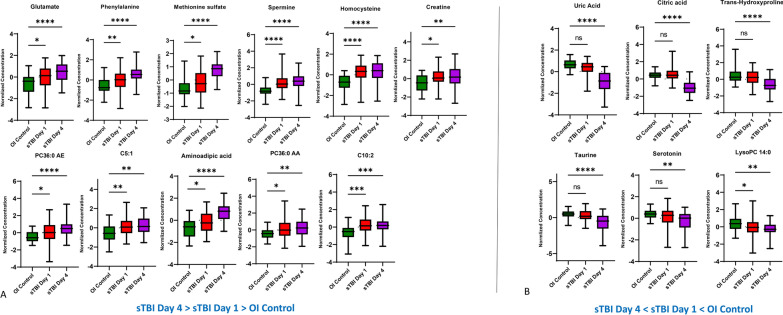
Results: Our results showed different serum metabolic profiles between sTBI and orthopedic injury (OI) controls, with significant changes in measured metabolites on day 1 and day 4 post-brain injury. The number of altered metabolites and the extent of their change were more pronounced on day 4 as compared to day 1 post-injury, suggesting an evolution of mechanisms from primary to secondary brain injury. Data showed high sensitivity and specificity in separating sTBI from OI controls for diagnosis. Energy-related metabolites such as glucose, pyruvate, lactate, mannose, and polyamine metabolism metabolites (spermine and putrescine), as well as increased acylcarnitines and sphingomyelins, occurred mainly on day 1 post-injury. Metabolites of neurotransmission, catecholamine, and excitotoxicity mechanisms such as glutamate, phenylalanine, tyrosine, and branched-chain amino acids (BCAAs) increased to a greater degree on day 4. Further, there was an association of multiple metabolites, including acylcarnitines (ACs), lysophosphatidylcholines (LysoPCs), glutamate, and phenylalanine, with injury severity at day 4, while lactate, glucose, and pyruvate correlated with injury severity on day 1.
Conclusion: The results demonstrate that serum metabolomics has diagnostic potential for sTBI and may reflect molecular mechanisms of primary and secondary brain injuries when comparing metabolite profiles between day 1 and day 4 post-injury. These early changes in serum metabolites may provide insight into molecular pathways or mechanisms of primary injury and ongoing secondary injuries, revealing potential therapeutic targets for sTBI. This work also highlights the need for further research and validation of sTBI metabolite biomarkers in a larger cohort.
Keywords: Metabolites; Metabolomics; Primary and secondary injury; sTBI.
© 2025. The Author(s).
Conflict of interest statement
Declarations. Competing interests: The authors declare no competing interests. Consent for publication: Not applicable. Ethics approval and consent to participate: The study protocol was approved by the Conjoint Health Research Ethics Board at the University of Calgary, Canada. Written informed consent was obtained from all patients or their surrogates.
Figures


References
-
- Hyder AA, Wunderlich CA, Puvanachandra P, Gururaj G, Kobusingye OC. The impact of traumatic brain injuries: a global perspective. NeuroRehabilitation. 2007;22(5):341–53. - PubMed
-
- Majdan M, Plancikova D, Brazinova A, Rusnak M, Nieboer D, Feigin V, Maas A. Epidemiology of traumatic brain injuries in Europe: a cross-sectional analysis. Lancet Public Health. 2016;1(2):e76–83. - PubMed
-
- Green REA, Dabek MK, Changoor A, Rybkina J, Monette GA, Colella B. Moderate-severe TBI as a progressive disorder: patterns and predictors of cognitive declines in the chronic stages of injury. Neurorehabil Neural Repair. 2023;37(11–12):799–809. - PubMed
MeSH terms
Substances
LinkOut - more resources
Full Text Sources
Medical
