. 2025 Dec;17(1):2452250.
doi: 10.1080/19490976.2025.2452250. Epub 2025 Jan 15.

Single-cell microbiota phenotyping reveals distinct disease and therapy-associated signatures in Crohn's disease

Affiliations

Single-cell microbiota phenotyping reveals distinct disease and therapy-associated signatures in Crohn's disease

Lisa Budzinski et al. Gut Microbes. 2025 Dec.

Abstract

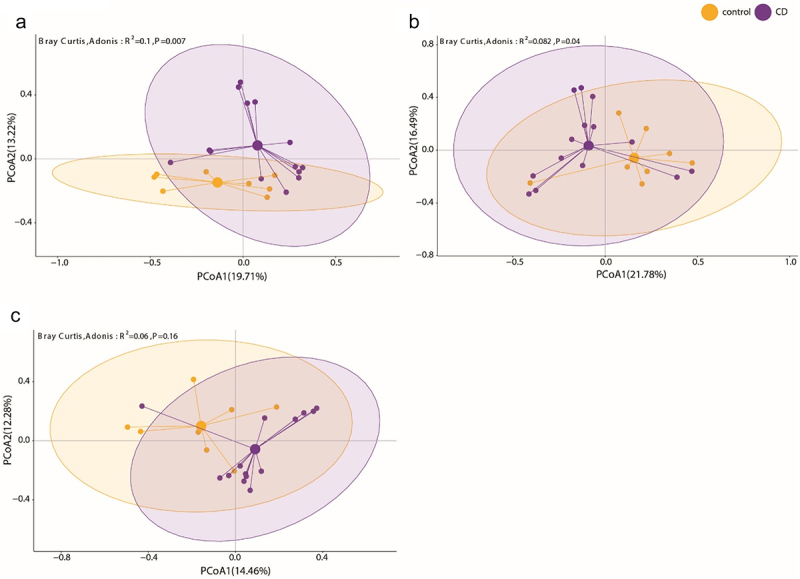
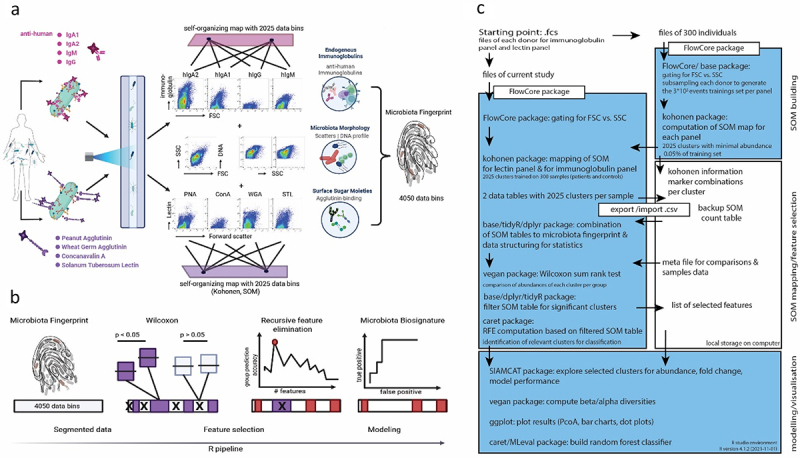
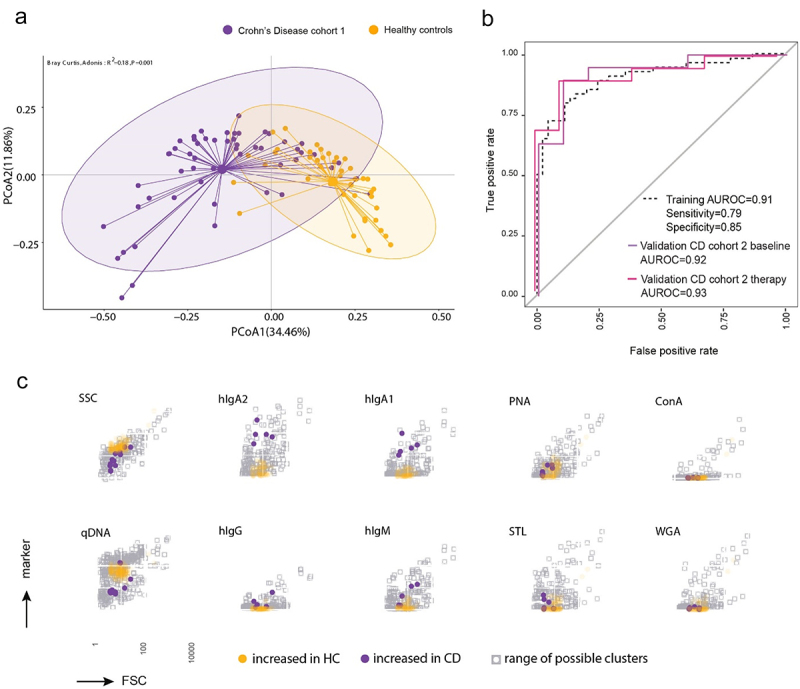
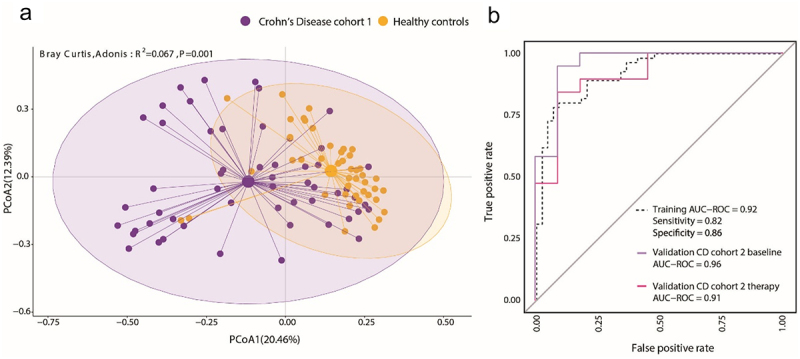
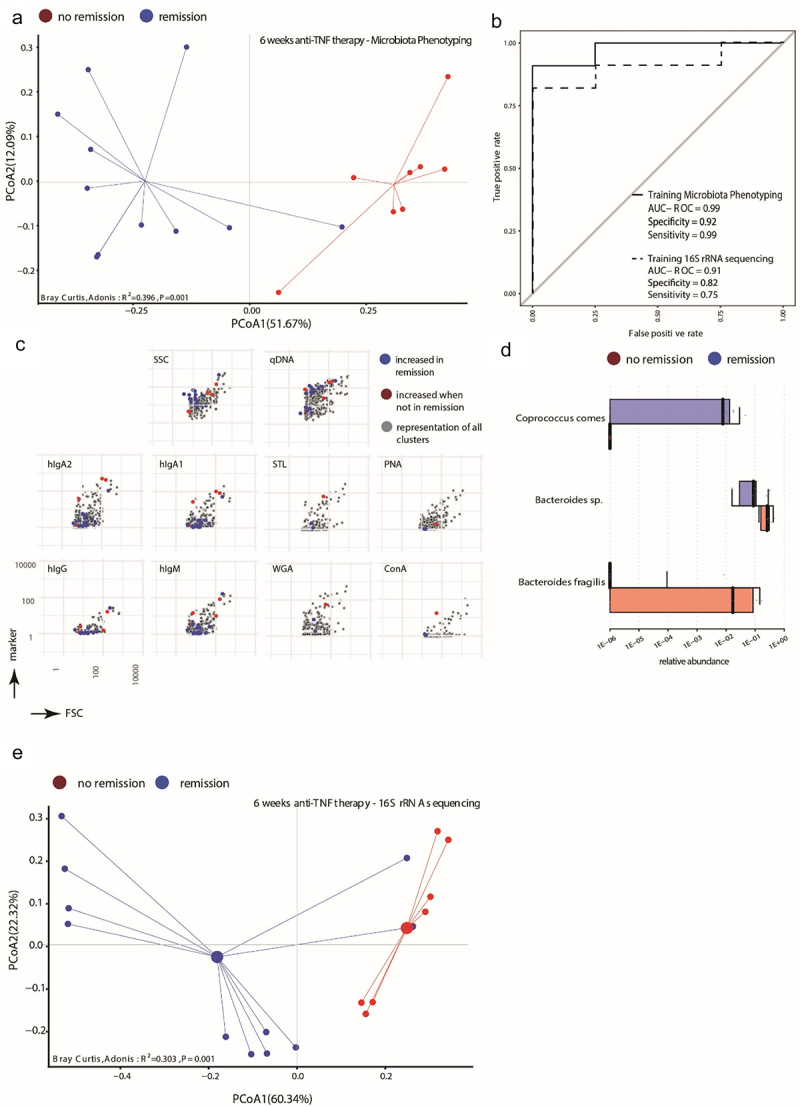
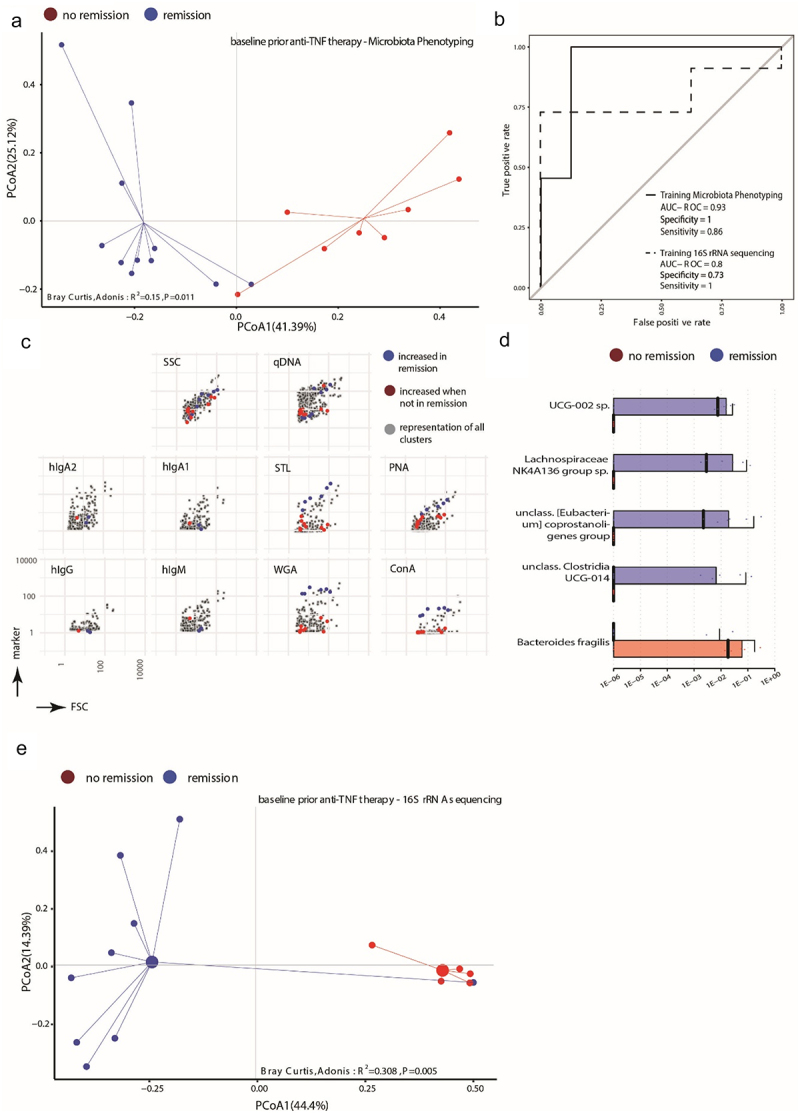
IgA-coated fractions of the intestinal microbiota of Crohn's disease (CD) patients have been shown to contain taxa that hallmark the compositional dysbiosis in CD microbiomes. However, the correlation between other cellular properties of intestinal bacteria and disease has not been explored further, especially for features that are not directly driven by the host immune-system, e.g. the expression of surface sugars by bacteria. By sorting and sequencing IgA-coated and lectin-stained fractions from CD patients microbiota and healthy controls, we found that lectin-stained bacteria were distinct from IgA-coated bacteria, but still displayed specific differences between CD and healthy controls. To exploit the discriminatory potential of both, immunoglobulin coated bacteria and the altered surface sugar expression of bacteria in CD, we developed a multiplexed single cell-based analysis approach for intestinal microbiota. By multi-parameter microbiota flow cytometry (mMFC) we characterized the intestinal microbiota of 55 CD patients and 44 healthy controls for 11-parameters in total, comprising host-immunoglobulin coating and the presence of distinct surface sugar moieties. The data were analyzed by machine-learning to assess disease-specific marker patterns in the microbiota phenotype. mMFC captured detailed characteristics of CD microbiota and identified patterns to classify CD patients. In addition, we identified phenotypic signatures in the CD microbiota which not only reflected remission after 6 weeks of anti-TNF treatment, but were also able to predict remission before the start of an adalimumab treatment course in a pilot study. We here present the proof-of-concept demonstrating that multi-parameter single-cell bacterial phenotyping by mMFC could be a novel tool with high translational potential to expand current microbiome investigations by phenotyping of bacteria to identify disease- and therapy-associated cellular alterations and to reveal novel target properties of bacteria for functional assays and therapeutic approaches.

Keywords: Single-cell analysis; microbiota flow cytometry; microbiota phenotyping.


Conflict of interest statement

No potential conflict of interest was reported by the author(s).

Figures

Figure 1.
Figure 1.
IgA-seq and lectin-seq potentially reveal functionally distinct bacterial taxa. Bacteria from CD patients (n = 14, purple) and healthy donors (n = 8, orange) were isolated by fluorescence activated cell sorting (FACS) according to (a) IgA-coating, (b) staining with wheat germ agglutinin (WGA) and (c) staining with peanut agglutinin (PNA) and submitted to full-length 16S rRNA gene sequencing. (a, b, c) the principal coordinate projection represent the Bray-Curtis dissimilarity of the taxonomic composition of the respective sorted fractions of CD and healthy donor samples.
Figure 2.
Figure 2.
Microbiota phenotyping by flow cytometry and machine learning to identify specific biosignatures in human stool samples. (a) Human intestinal bacteria from stool samples were stained with monoclonal antibodies specific for the human immunoglobulins IgA1, IgA2, IgM and IgG and with the lectins peanut agglutinin (PNA), wheat germ agglutinin (WGA), Solanum tuberosum lectin (STL) and concanavalin a (ConA). Each staining panel also included the cell wall/membrane-permeable DNA dye hoechst 33,342. After data acquisition in a flow cytometer, the cells of each staining panel were clustered according to a previously defined self-organizing map (SOM) into 2025 clusters. The abundance of cells per cluster in the total of 4050 clusters represented the overall microbiota phenotype of a sample. (b) The clusters were filtered by Wilcoxon statistical evaluation and recursive feature elimination to select the significant and most relevant clusters defining the specific microbiota biosignature for random forest model-based classification of disease and comparison of samples by Bray-Curtis dissimilarity (β-diversity) projection. (c) Outline of all relevant data processing steps and used packages (R) for computing a microbiota phenotype.
Figure 3.
Figure 3.
Microbiota phenotyping reveals a specific cytometric biosignatures of Crohn’s disease. Samples of CD patients from cohort 1 (n = 55) and healthy controls (n = 44) were stained for host immunoglobulins and surface sugars. Following SOM clustering and cluster selection, 187 clusters were identified. (a) Principal coordinate projection representing the Bray-Curtis dissimilarity between samples of CD cohort 1 and healthy controls according to the 187 selected clusters. (b) The 187 clusters were used to train a random forest model classifying between CD patients and healthy controls. The model was validated with 19 patients from an independent CD cohort, sampled at two time points: before therapy (baseline) and after 6 weeks of anti-tnf therapy (therapy) and 10 new healthy donors. The performance of the binary classifier model is illustrated by the AUROC curves. (c) Projection of the selected clusters containing increased abundance of bacterial cells in either CD patients or healthy controls visualizing the mean fluorescence intensity in each stained parameter in relation to all clusters.
Figure 4.
Figure 4.
The microbiome composition is altered in Crohn’s disease patients. Samples of CD patients from cohort 1 (n = 55) and healthy controls (n = 44) were analyzed by 16S rRNA V3/V4 amplicon sequencing. Identified genus level taxa also underwent selection as described resulting in 82 selected taxa. (a) Principal coordinate projection representing the Bray-Curtis dissimilarity between samples of CD cohort 1 and healthy controls according to the 82 selected taxa. (b) A random forest model classifier to distinguish between CD patients and healthy controls was trained with the 82 taxa. The model was validated with the 19 patients from CD cohort 2, sampled at two time points: before therapy (baseline) and after 6 weeks of anti-tnf therapy (therapy) and with the 10 new healthy donors. The performance of the taxonomy-based binary classifier model is illustrated by the AUROC curves.
Figure 5.
Figure 5.
Phenotypic properties of the microbiota and several taxa correlate with therapy success for Crohn’s disease patients after 6 weeks of anti-tnf therapy. 19 CD patients (CD cohort 2) were sampled before initiation of treatment with adalimumab and 6 weeks later, at which timepoint the patients were stratified into those achieving remission (Harvey-Bradshaw-index, HBI < 5, n = 11) and those not achieving remission criteria (HBI ≥5, n = 8) (a) Principal coordinate projection representing the Bray-Curtis dissimilarity between samples of remission (blue) and no remission (red) according to 24 selected cluster 6 weeks after initiation of adalimumab treatment. (b) A random forest model classifier to distinguish between CD patients in remission and patients not in remission after 6 weeks of adalimumab treatment was trained with the 24 selected phenotypic clusters (solid line) or with 3 taxa (dotted line) identified by 16S rRNA amplicon sequencing. The performance of the respective classifier model is illustrated by the AUROC curves. (c) Projection of the selected clusters containing increased abundance of bacterial cells in CD patients in remission or not in remission visualizing the mean fluorescence intensity in each stained parameter in relation to all clusters. (d) Abundance of the bacterial taxa significantly differentially abundant between patients in remission or not in remission following 6 weeks of adalimumab treatment. Indicated are the median abundance, 95% confidence interval and coefficient of variation. (e) Principal coordinate projection representing the Bray-Curtis dissimilarity between samples of remission (blue) and no remission (red) according to the 3 taxa 6 weeks after initiation of adalimumab treatment.
Figure 6.
Figure 6.
The baseline microbial signature can predict the achievement of remission induced by anti-tnf therapy in Crohn’s disease patients. (a) Principal coordinate projection representing the Bray-Curtis dissimilarity between patients at baseline before initiation of adalimumab treatment stratified into those reaching remission (blue) and those not-fulfilling remission criteria (red) according to 18 cluster selected from the baseline samples. (b) A random forest model classifier to stratify CD patients at baseline into those reaching remission and patients not reaching remission after 6 weeks of adalimumab treatment was trained with 18 selected cluster (solid line) or with 5 taxa (dotted line) identified by 16S rRNA amplicon sequencing. The performance of the respective classifier model is illustrated by the AUROC curves. (c) Projection of the selected clusters containing increased abundance of bacterial cells in CD patients reaching remission or not of the baseline analysis visualizing the mean fluorescence intensity in each stained parameter in relation to all clusters. (d) Abundance of the bacterial taxa significantly differentially abundant between patients reaching remission or not before initiation of adalimumab treatment. Indicated are the median abundance, 95% confidence interval and coefficient of variation. (e) Principal coordinate projection representing the Bray-Curtis dissimilarity between samples of remission (blue) and no remission (red) according to the 5 taxa at baseline before initiation of adalimumab treatment.

References

    1. Clemente JC, Ursell LK, Parfrey LW, Knight R.. The impact of the gut microbiota on human health: an integrative view. Cell. 2012;148(6):1258–20. doi:10.1016/j.cell.2012.01.035. - DOI - PMC - PubMed
    1. Duvallet C, Gibbons SM, Gurry T, Irizarry RA, Alm EJ. Meta-analysis of gut microbiome studies identifies disease-specific and shared responses. Nat Commun. 2017;8(1):1784. doi:10.1038/s41467-017-01973-8. [published Online First: 20171205]. - DOI - PMC - PubMed
    1. Durack J, Lynch SV. The gut microbiome: relationships with disease and opportunities for therapy. J Exp Med. 2019;216(1):20–40. doi:10.1084/jem.20180448. [published Online First: 20181015]. - DOI - PMC - PubMed
    1. Knox NC, Forbes JD, Van Domselaar G, Bernstein CN. The gut microbiome as a target for IBD treatment: are we there yet? Curr Treat Options Gastroenterol. 2019;17(1):115–126. doi:10.1007/s11938-019-00221-w. - DOI - PubMed
    1. Human Microbiome Project C. Structure, function and diversity of the healthy human microbiome. Nature. 2012;486(7402):207–214. doi:10.1038/nature11234. [published Online First: 20120613]. - DOI - PMC - PubMed

Substances

LinkOut - more resources