

Cochlear implantation in adults with acquired single-sided deafness improves cortical processing and comprehension of speech presented to the non-implanted ears: a longitudinal EEG study
- PMID: 39816191
- PMCID: PMC11733687
- DOI: 10.1093/braincomms/fcaf001
Cochlear implantation in adults with acquired single-sided deafness improves cortical processing and comprehension of speech presented to the non-implanted ears: a longitudinal EEG study
Abstract
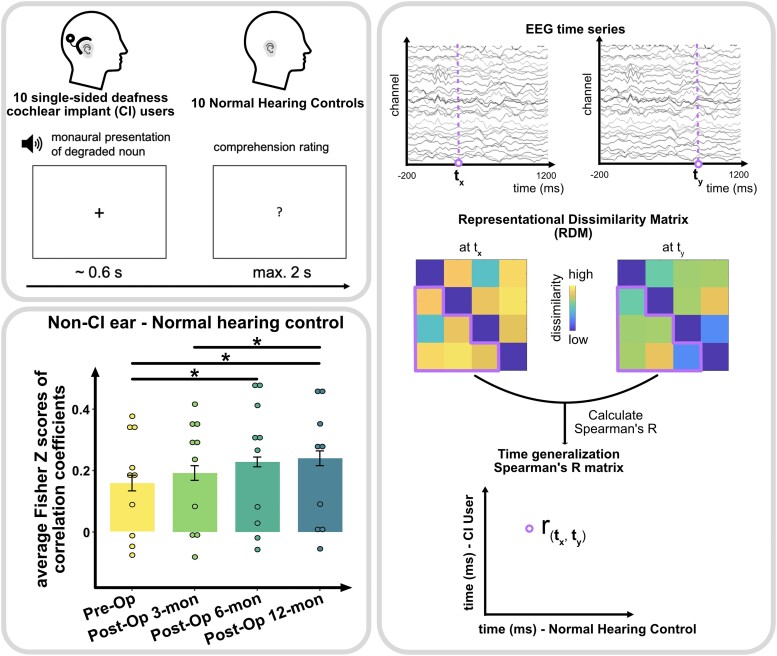
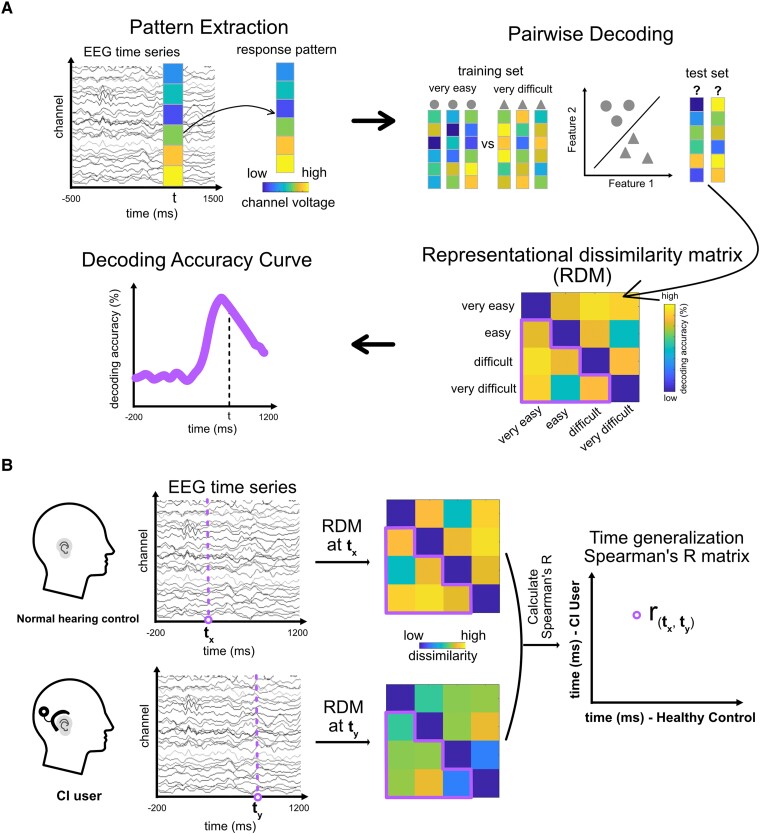
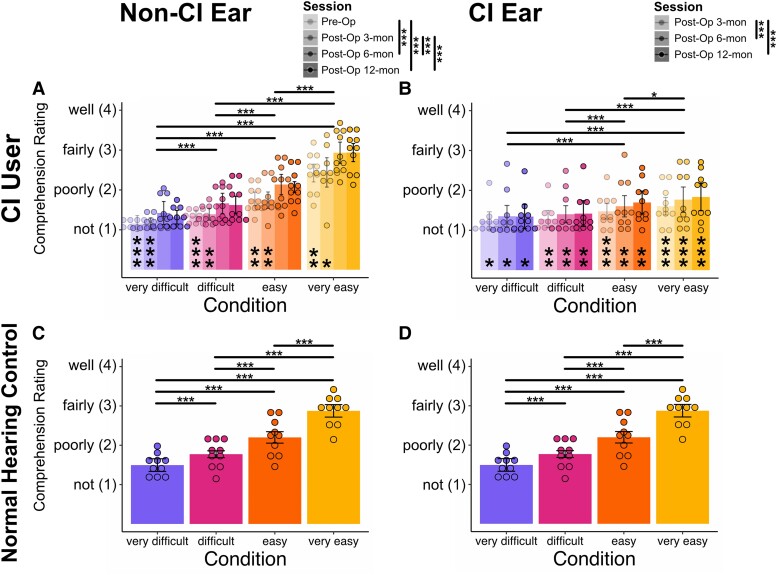
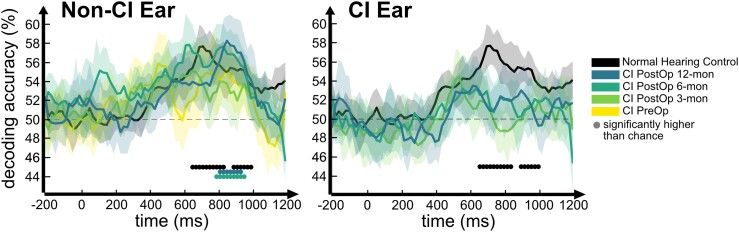
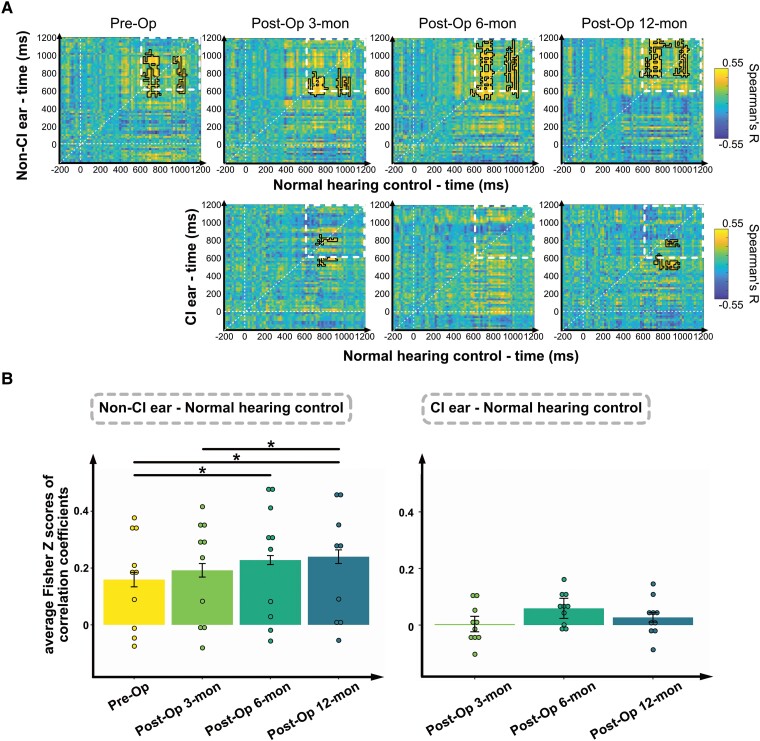
Former studies have established that individuals with a cochlear implant (CI) for treating single-sided deafness experience improved speech processing after implantation. However, it is not clear how each ear contributes separately to improve speech perception over time at the behavioural and neural level. In this longitudinal EEG study with four different time points, we measured neural activity in response to various temporally and spectrally degraded spoken words presented monaurally to the CI and non-CI ears (5 left and 5 right ears) in 10 single-sided CI users and 10 age- and sex-matched individuals with normal hearing. Subjective comprehension ratings for each word were also recorded. Data from single-sided CI participants were collected pre-CI implantation, and at 3, 6 and 12 months after implantation. We conducted a time-resolved representational similarity analysis on the EEG data to quantify whether and how neural patterns became more similar to those of normal hearing individuals. At 6 months after implantation, the speech comprehension ratings for the degraded words improved in both ears. Notably, the improvement was more pronounced for the non-CI ears than the CI ears. Furthermore, the enhancement in the non-CI ears was paralleled by increased similarity to neural representational patterns of the normal hearing control group. The maximum of this effect coincided with peak decoding accuracy for spoken-word comprehension (600-1200 ms after stimulus onset). The present data demonstrate that cortical processing gradually normalizes within months after CI implantation for speech presented to the non-CI ear. CI enables the deaf ear to provide afferent input, which, according to our results, complements the input of the non-CI ear, gradually improving its function. These novel findings underscore the feasibility of tracking neural recovery after auditory input restoration using advanced multivariate analysis methods, such as representational similarity analysis.
Keywords: EEG; cochlear implant; representational similarity analysis; single-sided deafness; speech comprehension.
© The Author(s) 2025. Published by Oxford University Press on behalf of the Guarantors of Brain.
Conflict of interest statement
The authors report no competing interests.
Figures
Similar articles
-
Side-of-Implantation Effect on Functional Asymmetry in the Auditory Cortex of Single-Sided Deaf Cochlear-Implant Users.Brain Topogr. 2022 Jul;35(4):431-452. doi: 10.1007/s10548-022-00902-3. Epub 2022 Jun 7. Brain Topogr. 2022. PMID: 35668310 Free PMC article.
-
Cortical reorganization after cochlear implantation for adults with single-sided deafness.PLoS One. 2018 Sep 24;13(9):e0204402. doi: 10.1371/journal.pone.0204402. eCollection 2018. PLoS One. 2018. PMID: 30248131 Free PMC article.
-
Speech intelligibility and subjective benefit in single-sided deaf adults after cochlear implantation.Hear Res. 2017 May;348:112-119. doi: 10.1016/j.heares.2017.03.002. Epub 2017 Mar 10. Hear Res. 2017. PMID: 28286233
-
Implantable Devices for Single-Sided Deafness and Conductive or Mixed Hearing Loss: A Health Technology Assessment.Ont Health Technol Assess Ser. 2020 Mar 6;20(1):1-165. eCollection 2020. Ont Health Technol Assess Ser. 2020. PMID: 32194878 Free PMC article.
-
Duration of unilateral auditory deprivation is associated with reduced speech perception after cochlear implantation: A single-sided deafness study.Cochlear Implants Int. 2019 Mar;20(2):51-56. doi: 10.1080/14670100.2018.1550469. Epub 2018 Nov 28. Cochlear Implants Int. 2019. PMID: 30486762 Free PMC article.
References
-
- van Wieringen A, Boudewyns A, Sangen A, Wouters J, Desloovere C. Unilateral congenital hearing loss in children: Challenges and potentials. Hear Res. 2019;372:29–41. - PubMed
-
- Bilecen D, Seifritz E, Radü EW, et al. . Cortical reorganization after acute unilateral hearing loss traced by fMRI. Neurology. 2000;54:765–767. - PubMed
LinkOut - more resources
Full Text Sources