. 2024 Dec 4:18:16-30.
doi: 10.1016/j.ibneur.2024.12.002. eCollection 2025 Jun.

Effect of metabolic disorders on reactive gliosis and glial scarring at the early subacute phase of stroke in a mouse model of diabetes and obesity

Affiliations

Effect of metabolic disorders on reactive gliosis and glial scarring at the early subacute phase of stroke in a mouse model of diabetes and obesity

Julien Clain et al. IBRO Neurosci Rep. .

Abstract

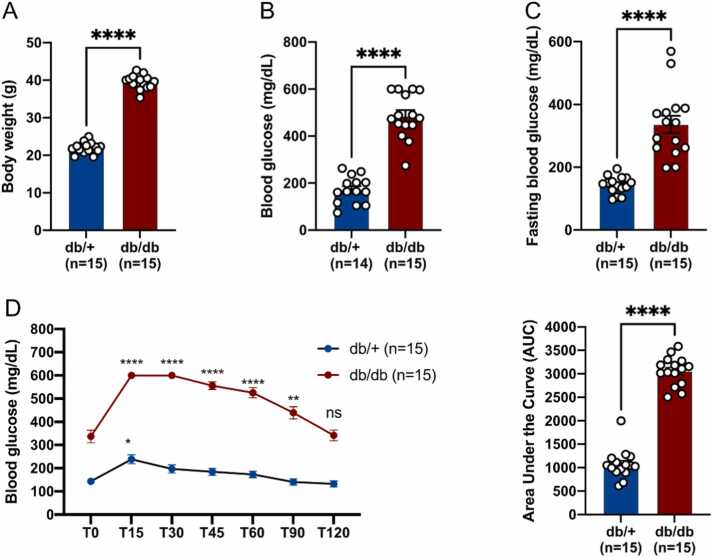
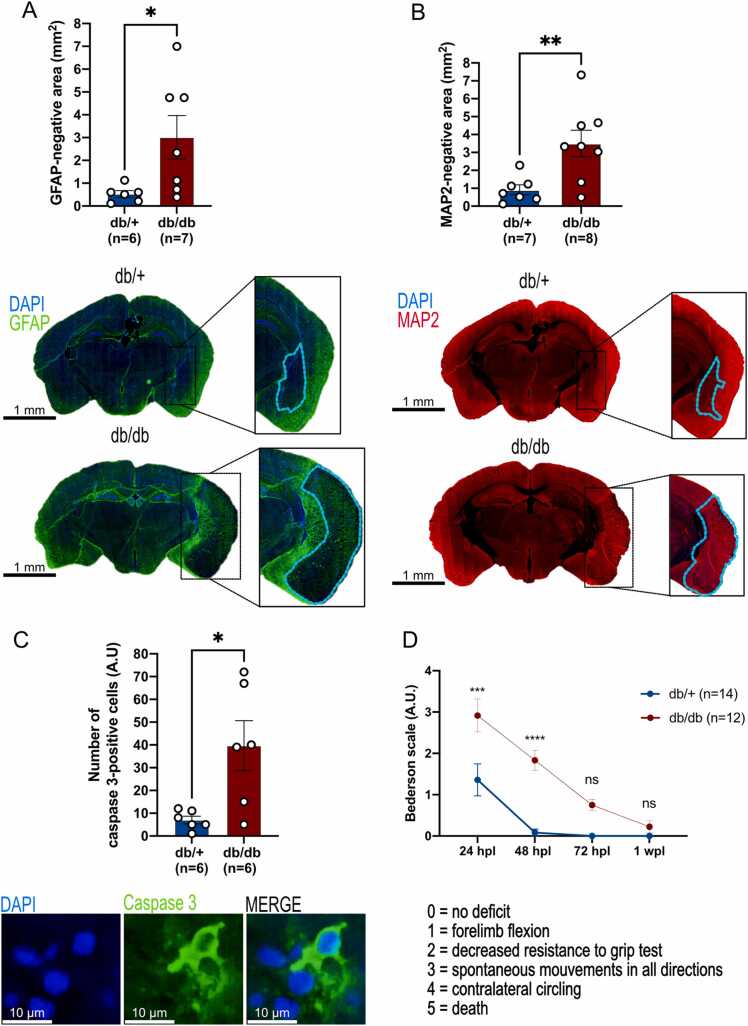
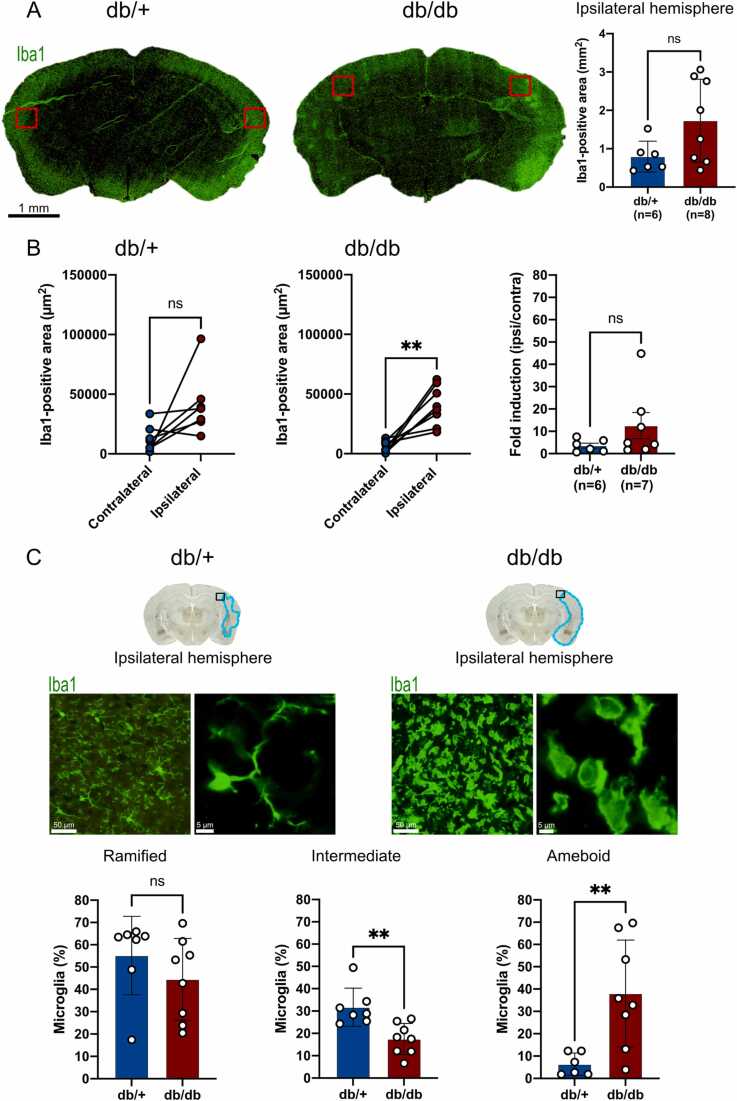
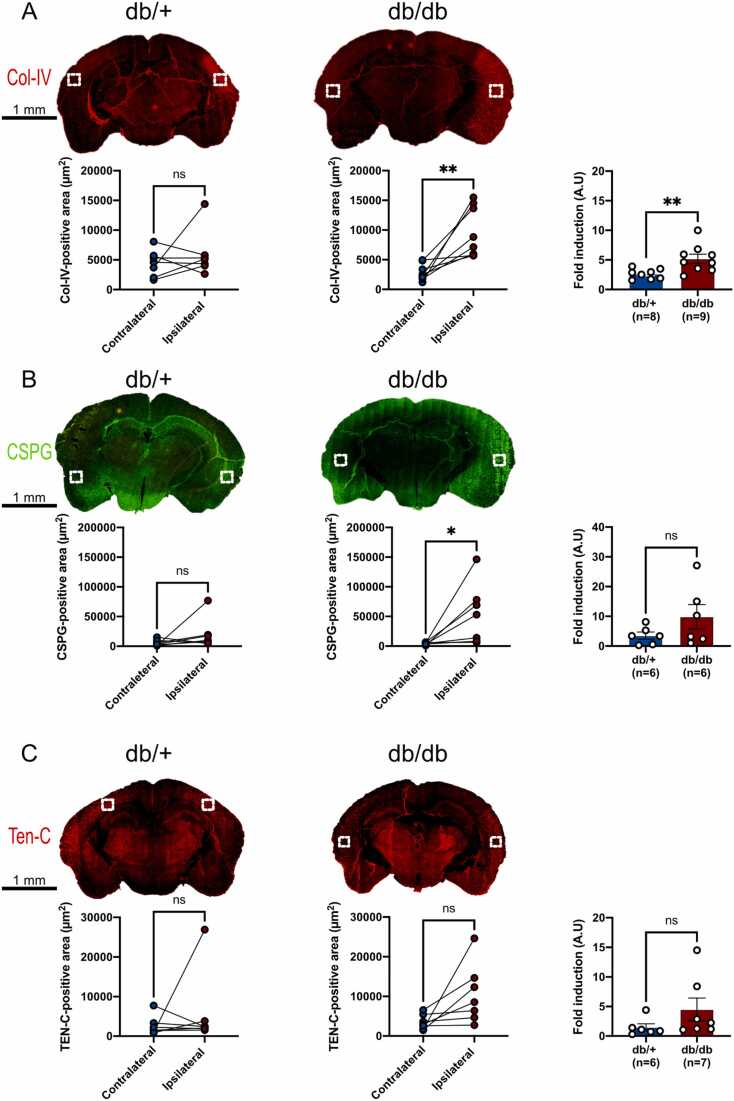
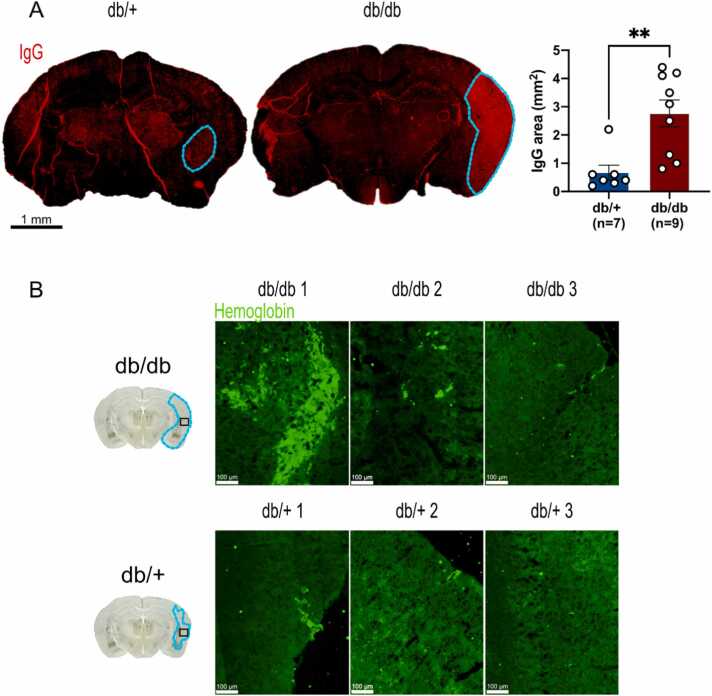
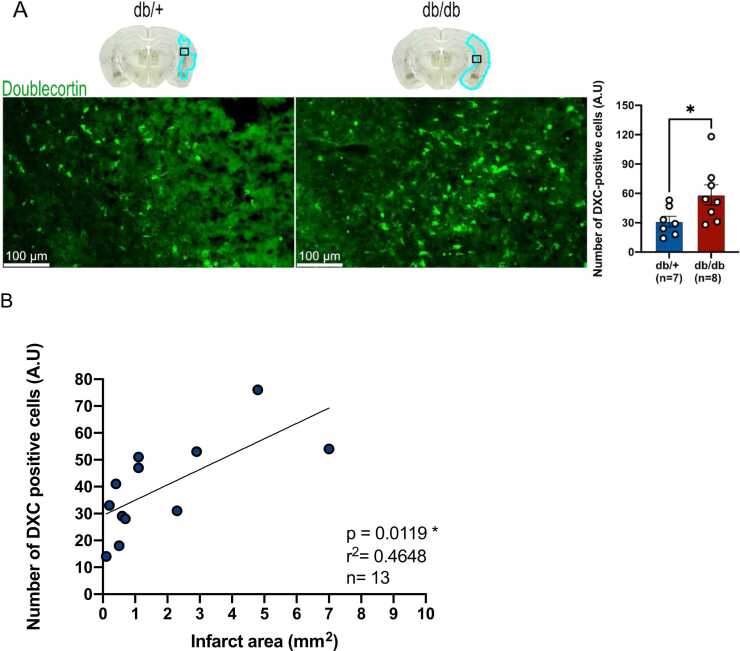
It is well recognized that type II Diabetes (T2D) and overweight/obesity are established risk factors for stroke, worsening also their consequences. However, the underlying mechanisms by which these disorders aggravate outcomes are not yet clear limiting the therapeutic opportunities. To fill this gap, we characterized, for the first time, the effects of T2D and obesity on the brain repair mechanisms occurring 7 days after stroke, notably glial scarring. In the present study, by performing a 30-minute middle cerebral artery occlusion (MCAO) on db/db (obese diabetics mice) and db/+ (controls) mice, we demonstrated that obese and diabetic mice displayed larger lesions (i.e. increased infarct volume, ischemic core, apoptotic cell number) and worsened neurological outcomes compared to their control littermates. We then investigated the formation of the glial scar in control and db/db mice 7 days post-stroke. Our observations argue in favor of a stronger and more persistent activation of astrocytes and microglia in db/db mice. Furthermore, an increased deposition of extracellular matrix (ECM) was observed in db/db vs control mice (i.e. chondroitin sulfate proteoglycan and collagen type IV). Consequently, we demonstrated for the first time that the db/db status is associated with increased astrocytic and microglial activation 7 days after stroke and resulted in higher deposition of ECM within the damaged area. Interestingly, the injury-induced neurogenesis appeared stronger in db/db as shown by the labeling of migrating neuroblast. This increase appeared correlated to the larger size of lesion. It nevertheless raises the question of the functional integration of the new neurons in db/db mice given the observed dense ECM, known to be repulsive for neuronal migration. Carefully limiting glial scar formation after stroke represents a promising area of research for reducing neuronal loss and limiting disability in diabetic/obese patients.

Keywords: CSPG; MCAO; astrogliosis; db/db mice; extracellular matrix; glial scar; gliosis; microgliosis.


Conflict of interest statement

The authors declare no conflict of interests.

Figures

Fig. 1
Fig. 1
Metabolic parameters of db/db and db/+ mice before MCAO, (A-C) Body weight (A), blood glucose (B) and fasting blood glucose (C) measurements in db/db and db/+ mice. (D) Oral Glucose Tolerance Test (OGTT) demonstrating impaired glucose regulation in db/db mice compared with db/+ mice according to time (T0 to T120 minutes). Blood glucose levels peaked after 15 minutes in both groups. In each group, the blood glucose level measured is compared with the respective T0. It returned to basal levels after 30 minutes in control mice and after 120 minutes in the diabetic group, * p < 0.05, * ** * p < 0.001.
Fig. 2
Fig. 2
Brain damage and cell death are aggravated in db/db mice after stroke, (A) Representative images of GFAP staining (green) in db/+ and db/db mice showing the damaged area. Quantifications of GFAP-negative areas in the ipsilateral hemispheres (blue lines) allowing to determine the size of the ischemic area (blue demarcation lines). (B) Quantifications of MAP2-negative area documenting the size of the ischemic core in both mice groups (blue demarcation lines). Injured area and ischemic core are both larger in db/db mice compared to db/+ mice (graphs). (C) Number of activated caspase 3-positive cells and representative staining in the ischemic core of both groups, showing that db/db mice displayed higher number of apoptotic cells compared to db/+ mice. (D) Neurological score using the Bederson’s deficit scale demonstrating that the deficit was is significantly higher in db/db mice than in db/+ at 24 h and 48 h post lesion (hpl). * p < 0.05, * * p < 0.01, * ** p < 0.005, * ** * p < 0.001, scale bar: 10, 50 µm and 1 mm.
Fig. 3
Fig. 3
Astrogliosis is increased in db/db mice 7 days after MCAO, (A) Representative images of GFAP staining (green) in db/+ and db/db mice. Quantifications of GFAP-positive areas in the injured hemisphere indicated a trend towards increased GFAP reactivity in db/db compared to db/+ . (B) Perilesional quantification (red squares) of GFAP-positive area is significantly higher in the ipsilateral hemisphere compared to the contralateral hemisphere in db/+ and db/db mice. In contrast, GFAP fold induction (ipsilateral/contralateral) in diabetic mice did not reach statistical significance. (C) In the ipsilateral hemispheres, hypertrophy of astrocytic extensions and bodies was observed in diabetic and control mice at the perilesional level (black squares). Note that neuroanatomical regions had to be adapted in both groups because of the differences in location and size of the injured area. The brain schematic shows the location of the regions of interest studied (black squares) in the contralateral and ipsilateral parts of the db/+ and db/db, with the damaged area shown in blue. * p < 0.05, ns: non-significant.
Fig. 4
Fig. 4
Microgliosis is impaired in db/db mice after MCAO, (A) Representative images of Iba1 staining (green) in db/+ and db/db mice illustrating microgliosis. Quantifications of Iba1-positive areas in the injured hemisphere. (B) Perilesional quantification (red squares) of Iba1-positive area is significantly higher in the ipsilateral hemisphere of diabetic mice, while this is not the case for db/+ mice. Iba1 fold induction (ipsilateral / contralateral) tended to be increased in db/db mice. (C) Representative pictures showing hypertrophic microglia (Iba1 in green) in the ipsilateral hemisphere in both groups. Ameboid microglia with a circular morphology can be observed in diabetic mice and stellate microglia in control mice. The quantification of ramified ("quiescent"), intermediate and ameboid ("activated/phagocytic") microglia demonstrates the sustained microglia activation in db/db mice, characterized by a notable reduction in intermediate microglia and a corresponding increase in ameboid ones. Note that neuroanatomical regions had to be adapted in both groups because of the differences in location and size of the injured area. The brain schematic shows the location of the regions of interest studied (black squares) in the contralateral and ipsilateral parts of the db/+ and db/db, with the damaged area shown in blue. * * p < 0.01, ns: non-significant, scale bar: 5, 50 µm and 1 mm.
Fig. 5
Fig. 5
Synthesis of type IV collagen and CSPG is enhanced in db/db mice after MCAO, (A) Representative images of type IV collagen staining (Col-IV in red) in both groups. Quantifications of Col-IV-positive areas was performed in the ischemic core and in the corresponding area in the contralateral hemisphere (regions indicated by the white squares). Col-IV-positive area is significantly higher in the ipsilateral hemisphere in diabetic mice compared to the contralateral one 7 days post-stroke. Col-IV-fold induction (ipsilateral / contralateral) is higher in the db/db group compared to db/+ mice. (B) Representative images of chondroitin sulfate of proteoglycan staining (green) in both groups. Quantifications of CSPG-positive areas was performed in the ischemic core and in the corresponding area in the contralateral hemisphere (regions indicated by the white squares). In db/db mice, CSPG-positive area is significantly higher in the ipsilateral hemisphere of diabetic mice. CSPG fold induction (ipsilateral / contralateral) is unchanged between both groups. (C) Representative images of tenascin C staining (red) in both groups. Quantifications of TEN-C-positive areas was performed in the ischemic core and in the corresponding area in the contralateral hemisphere (regions indicated by the white squares). Ten-C fold induction (ipsilateral / contralateral) was comparable in both groups. * p < 0.05, * * p < 0.01, ns: non-significant, scale bar: 1 mm.
Fig. 6
Fig. 6
Increased BBB breakdown and hemorrhagic transformation 7 days post-stroke in db/db mice, (A) Representative pictures of IgG-positive area in db/+ and db/db mice. Note that the blue lines correspond to the diffusion of IgG in the brain following stroke, attesting of BBB breakdown. Quantification indicates that the positive zone for IgG is almost 4 times higher in db/db mice than in control mice. (B) Representative images of the hemoglobin-positive zone in the ischemic core in both groups. It seems that hemorrhagic transformation is more important in db/db mice. The brain schematic shows the location of the regions of interest studied (black squares) in the contralateral and ipsilateral parts of the db/+ and db/db, with the damaged area shown in blue. * * p < 0.01, scale bar: 1 mm.
Fig. 7
Fig. 7
Increased reparative neurogenesis in the injured area 7 days after stroke in db/db mice, (A) Representative pictures of DCX-positive area in db/+ and db/db mice. Quantification indicated that the number of DCX-positive cells in the perilesional zone was twice as high in db/db mice as in db/+ mice. (B) Graphical correlation showing that the number of DCX-positive cells increases with the infarct volume (db/+ and db/db mice). The brain schematic shows the location of the regions of interest studied (black squares) in the contralateral and ipsilateral parts of the db/+ and db/db, with the damaged area shown in blue. * p < 0.05, scale bar: 100 µm.

Similar articles

References

    1. Akamatsu Y., Nishijima Y., Lee C.C., Yang S.Y., Shi L., An L., Wang R.K., Tominaga T., Liu J. Impaired leptomeningeal collateral flow contributes to the poor outcome following experimental stroke in the type 2 diabetic mice. J. Neurosci. 2015;35:3851–3864. - PMC - PubMed
    1. Anttila J.E., Whitaker K.W., Wires E.S., Harvey B.K., Airavaara M. Role of microglia in ischemic focal stroke and recovery: focus on Toll-like receptors. Prog. Neuropsychopharmacol. Biol. Psychiatry. 2017;79:3–14. - PMC - PubMed
    1. Arba F., Rinaldi C., Caimano D., Vit F., Busto G., Fainardi E. Blood-brain barrier disruption and hemorrhagic transformation in acute ischemic stroke: systematic review and meta-analysis. Front Neurol. 2020;11 - PMC - PubMed
    1. Arvola O., Griffiths B., Rao A., Xu L., Pastroudis I.-A., Stary C.M. Expression of miR-200c corresponds with increased reactive oxygen species and hypoxia markers after transient focal ischemia in mice. Neurochem Int. 2021;149 - PMC - PubMed
    1. Arzate D.M., Covarrubias L. Adult neurogenesis in the context of brain repair and functional relevance. Stem Cells Dev. 2020;29:544–554. - PubMed

LinkOut - more resources