. 2024 Dec 31;13(12):6766-6781.
doi: 10.21037/tcr-24-1118. Epub 2024 Dec 27.

Regulatory T cell-associated gene signature correlates with prognostic risk and immune infiltration in patients with breast cancer

Affiliations

Regulatory T cell-associated gene signature correlates with prognostic risk and immune infiltration in patients with breast cancer

Jie Wu et al. Transl Cancer Res. .

Abstract

Background: Regulatory T cells (Tregs) play a pivotal role in the development, prognosis, and treatment of breast cancer. This study aimed to develop a Treg-associated gene signature that contributes to predict prognosis and therapy benefits in breast cancer.

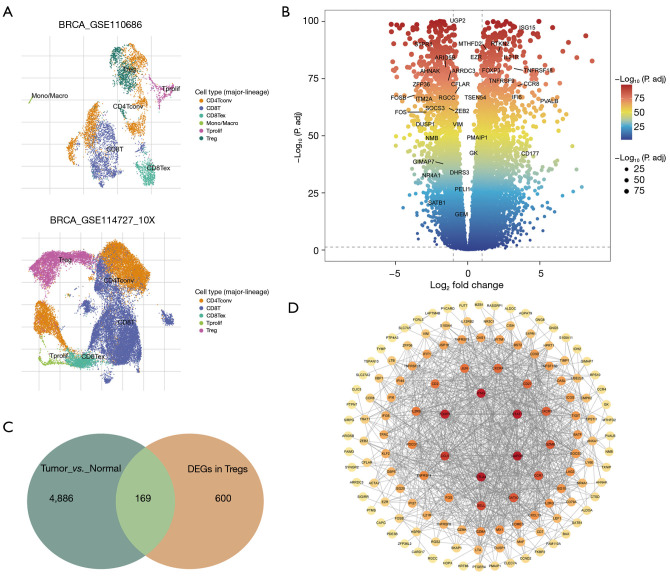
Methods: Treg-associated genes were screened based on single-cell RNA-sequencing (RNA-seq) in TISCH2 database and the bulk RNA-seq in The Cancer Genome Atlas (TCGA) database. Treg-associated gene signature was identified via survival analysis, univariate cox, least absolute shrinkage and selection operator (LASSO) and multivariable Cox regression analyses. Immune status was assessed using single-sample gene set enrichment analysis (ssGSEA) and Estimation of STromal and Immune cells in MAlignant Tumor tissues using Expression data (ESTIMATE) algorithms. Drug sensitivity was estimated using pRRophetic. Gene set enrichment analysis (GSEA) was conducted to explore the changed pathways.

Results: A total of 169 genes were identified as Treg-associated genes, and close interactions existed among these genes. Kaplan-Meier (KM) survival and univariate cox revealed 29 prognostic genes (all P<0.05), and finally a six-gene prognostic signature including TBC1D4, PMAIP1, IFNG, LEF1, MZB1 and EZR was identified by LASSO and multivariable Cox. Based on this signature, patients in high-risk group exhibited a worse survival probability than those in low-risk group in the TCGA training dataset (P<0.001). Additionally, this signature showed a moderate predictive power for 1-, 3- and 5-year survival for breast cancer patients in both training dataset [area under the curve (AUC) =0.705, 0.678 and 0.668, respectively]. Similar predictive power for 1-, 3- and 5-year survival was also observed in validation datasets. Risk scores significantly differed between subgroups divided by clinicopathologic features, especially by molecular subtypes. Patients in high- and low-risk groups showed significant differences on infiltration abundance of multiple types of immune cells (such as, activated B cells/CD8+ T cells/CD4+ T cells), immune and stromal scores (all P<0.05). Moreover, sensitivity to 83 chemotherapeutic drugs such as lapatinib, methotrexate, and gefitinib were significantly differed between the two risk groups (all P<0.001).

Conclusions: This is the first to develop a Treg-associated gene signature for breast cancer, which could predict prognosis of patients and help to identify patients who might be benefit from immunotherapy and/or chemotherapy.

Keywords: Breast cancer; immune infiltration; prognostic signature; regulatory T cell (Treg).


Conflict of interest statement

Conflicts of Interest: All authors have completed the ICMJE uniform disclosure form (available at https://tcr.amegroups.com/article/view/10.21037/tcr-24-1118/coif). The authors have no conflicts of interest to declare.

Figures

Figure 1
Figure 1
Identification of Treg-associated genes. (A) Two-dimensional distribution of annotated cell types in two datasets obtained from TISCH2 database; (B) volcano plot of DEGs in tumor vs. normal in TCGA-cohort; (C) Venn diagram reveals the shared genes between two analyses; (D) PPI network for the shared genes. CD4Tconv, conventional CD4+ T cell; CD8Tex, exhausted CD8+ T cell; CD8T, CD8+ T cell; Mono, monocyte; Macro, macrophage; Treg, regulatory T cell; Tprolif, proliferating T cells; P.adj, adjusted P value; DEGs, differentially expressed genes; TCGA, The Cancer Genome Atlas; PPI, protein-protein interaction; BRCA, breast cancer.
Figure 2
Figure 2
Identification of Treg-associated prognostic signature. (A) Forest plot showing the genes that related to prognosis in univariate analysis; (B,C) parameter selection of LASSO regression: (B) cross-validation to select the optimal parameter lambda; (C) distribution of the LASSO coefficient for feature genes; (D) the most contributing prognostic genes identified by multivariate stepwise regression. *, P<0.05. HR, hazard ratio; CI, confidence interval; Treg, regulatory T cell; LASSO, least absolute shrinkage and selection operator.
Figure 3
Figure 3
Evaluation of the prognostic signature. KM-survival curves showing the differences on survival probability between the two risk groups in TCGA-training set (A), TCGA-validation set (C) and GEO external validation set (E); ROC curves showing the predictive power of the prognostic model for 1-, 3-, and 5-year survival in TCGA-training set (B), TCGA-validation set (D) and GEO external validation set (F). TCGA, The Cancer Genome Atlas; AUC, area under the curve; GEO, Gene Expression Omnibus; ROC, receiver operating characteristic; KM, Kaplan-Meier.
Figure 4
Figure 4
Associations of risk score with clinical factors. Boxplots showing the distribution of risk score in subgroups divided by age (A), AJCC_T (B), AJCC_N (C), AJCC_M (D), tumor stage (E), PR status (F), ER status (G), HER-2 status (H), and TNBC (I). *, P<0.05; **, P<0.01; ***, P<0.001; ns, non-significance. AJCC, American Joint Committee on Cancer; PR, progesterone receptor; ER, estrogen receptor; HER-2, human epidermal growth factor receptor-2; TNBC, triple-negative breast cancer.
Figure 5
Figure 5
Establishment and evaluation of clinical nomogram. Forest plots showing the prognosis-associated factors in univariate analysis (A) and the factors independently associated with prognosis in multivariate analysis (B); (C) the established nomogram based on independent prognostic factors; (D) KM-survival curves showing the differences on survival probability between high- and low-nomoScore groups; (E-G) evaluation of predictive power and accuracy of the nomogram for 1-, 3-, and 5-year survival by ROC curves (E), decision curves (F) and calibration curve (G). ***, P<0.001. AJCC, American Joint Committee on Cancer; PR, progesterone receptor; ER, estrogen receptor; HER-2, human epidermal growth factor receptor-2; TNBC, triple-negative breast cancer; HR, hazard ratio; CI, confidence interval; OS, overall survival; KM, Kaplan-Meier; ROC, receiver operating characteristic.
Figure 6
Figure 6
Immune cells infiltration. (A) Differences in infiltration abundance of the 28 immune cells between the two risk groups analyzed by ssGSEA; (B) differences in the ESTIMATE, immune and stromal scores between the two risk groups. *, P<0.05; **, P<0.01; ***, P<0.001; ns, non-significance. MDSC, myeloid-derived suppressor cell; ESTIMATE, Estimation of STromal and Immune cells in MAlignant Tumor tissues using Expression data; ssGSEA, single-sample gene set enrichment analysis.
Figure 7
Figure 7
Gene set enrichment analysis. The top 5 significantly enriched KEGG pathways in high-risk group (A) and low-risk group (B). KEGG, Kyoto Encyclopedia of Genes and Genomes.
Figure 8
Figure 8
Drug sensibility. Boxplots showing the differences in sensibility to several common chemotherapeutics estimated by GDSC database between the two risk groups. ***, P<0.001. IC50, half maximal inhibitory concentration; GDSC, Genomics of Drug Sensitivity in Cancer.

References

    1. Sung H, Ferlay J, Siegel RL, et al. Global Cancer Statistics 2020: GLOBOCAN Estimates of Incidence and Mortality Worldwide for 36 Cancers in 185 Countries. CA Cancer J Clin 2021;71:209-49. 10.3322/caac.21660 - DOI - PubMed
    1. Li Y, Zhang H, Merkher Y, et al. Recent advances in therapeutic strategies for triple-negative breast cancer. J Hematol Oncol 2022;15:121. 10.1186/s13045-022-01341-0 - DOI - PMC - PubMed
    1. Nicolò E, Tarantino P, Curigliano G. Biology and Treatment of HER2-Low Breast Cancer. Hematol Oncol Clin North Am 2023;37:117-32. 10.1016/j.hoc.2022.08.013 - DOI - PubMed
    1. Onkar SS, Carleton NM, Lucas PC, et al. The Great Immune Escape: Understanding the Divergent Immune Response in Breast Cancer Subtypes. Cancer Discov 2023;13:23-40. 10.1158/2159-8290.CD-22-0475 - DOI - PMC - PubMed
    1. Nolan E, Lindeman GJ, Visvader JE. Deciphering breast cancer: from biology to the clinic. Cell 2023;186:1708-28. 10.1016/j.cell.2023.01.040 - DOI - PubMed

LinkOut - more resources