. 2025 Jan 1;15(4):1238-1254.
doi: 10.7150/thno.102531. eCollection 2025.

A novel ROR1-targeting antibody-PROTAC conjugate promotes BRD4 degradation for solid tumor treatment

Affiliations

A novel ROR1-targeting antibody-PROTAC conjugate promotes BRD4 degradation for solid tumor treatment

Lei Wang et al. Theranostics. .

Abstract

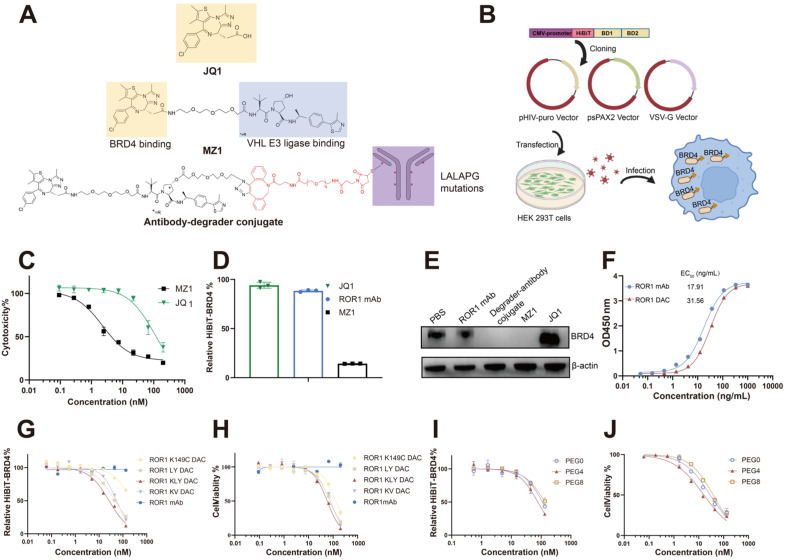
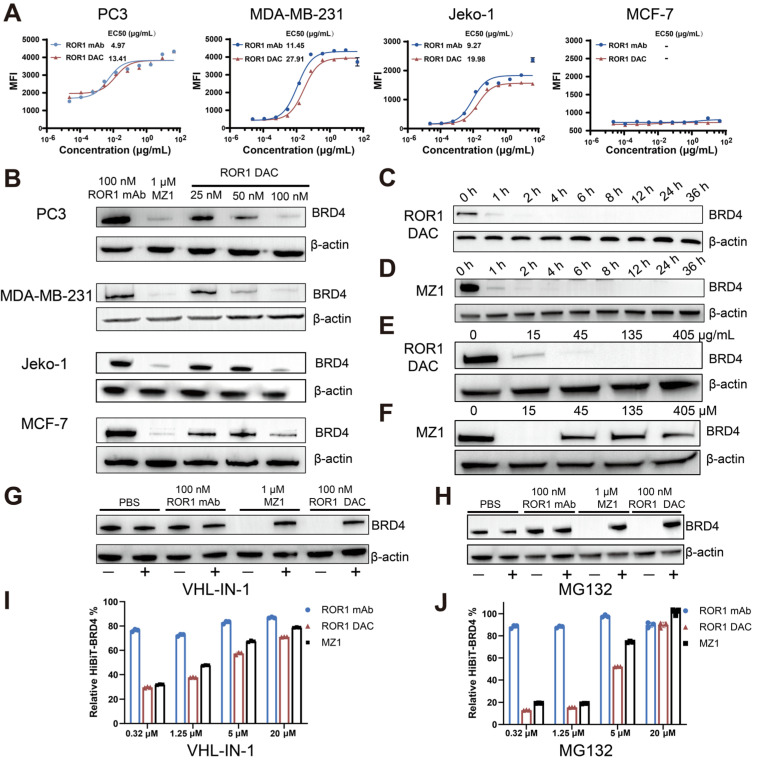
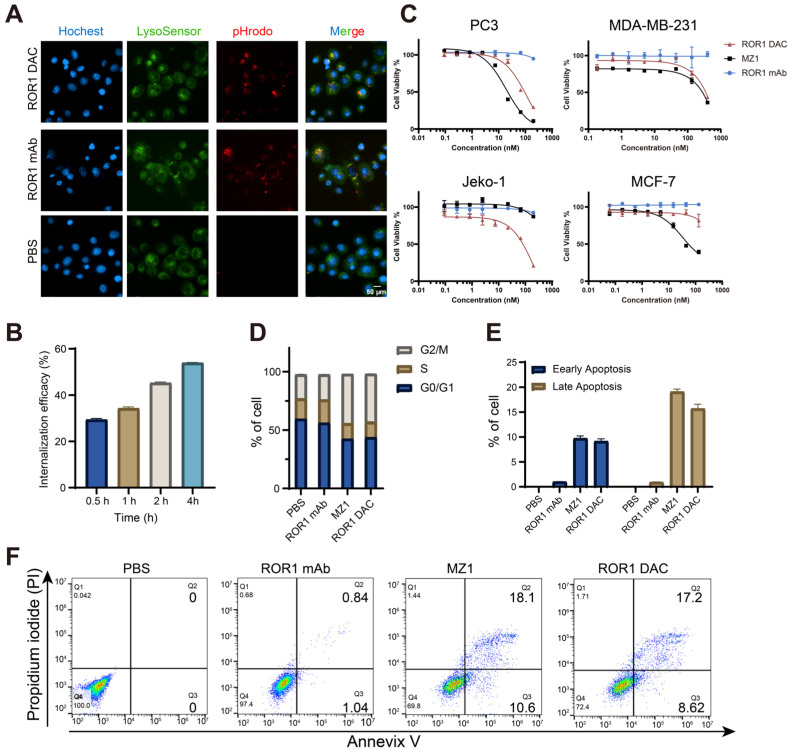
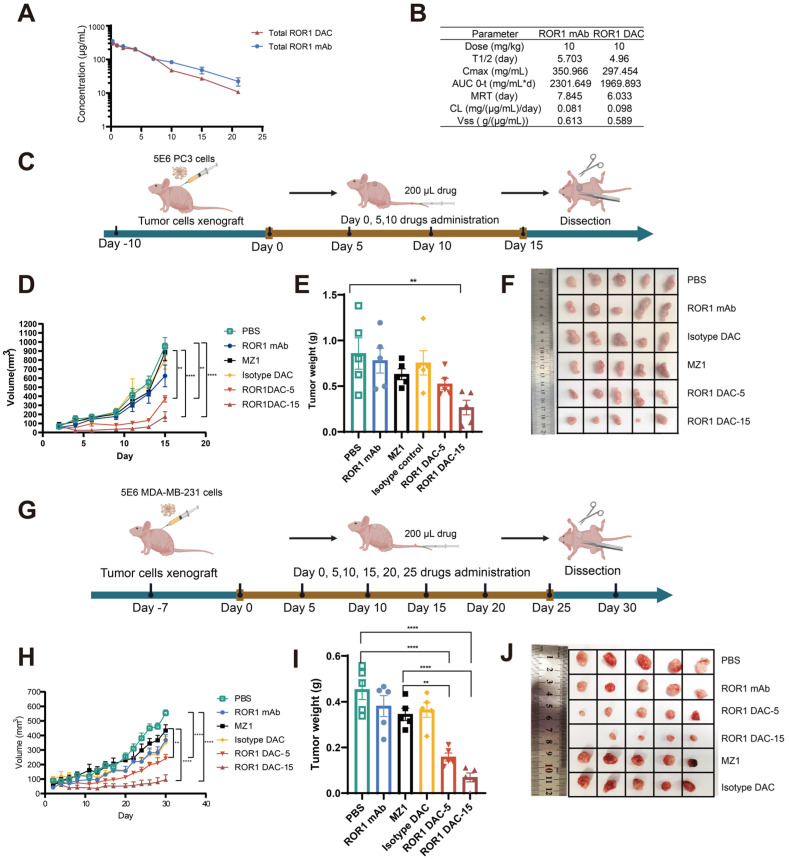
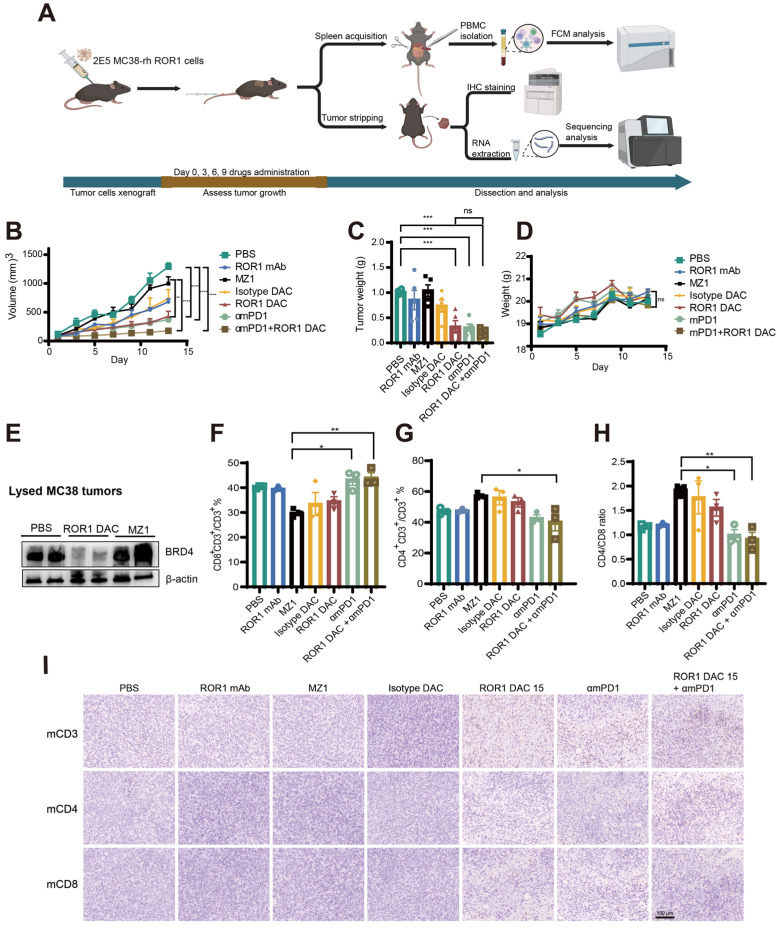
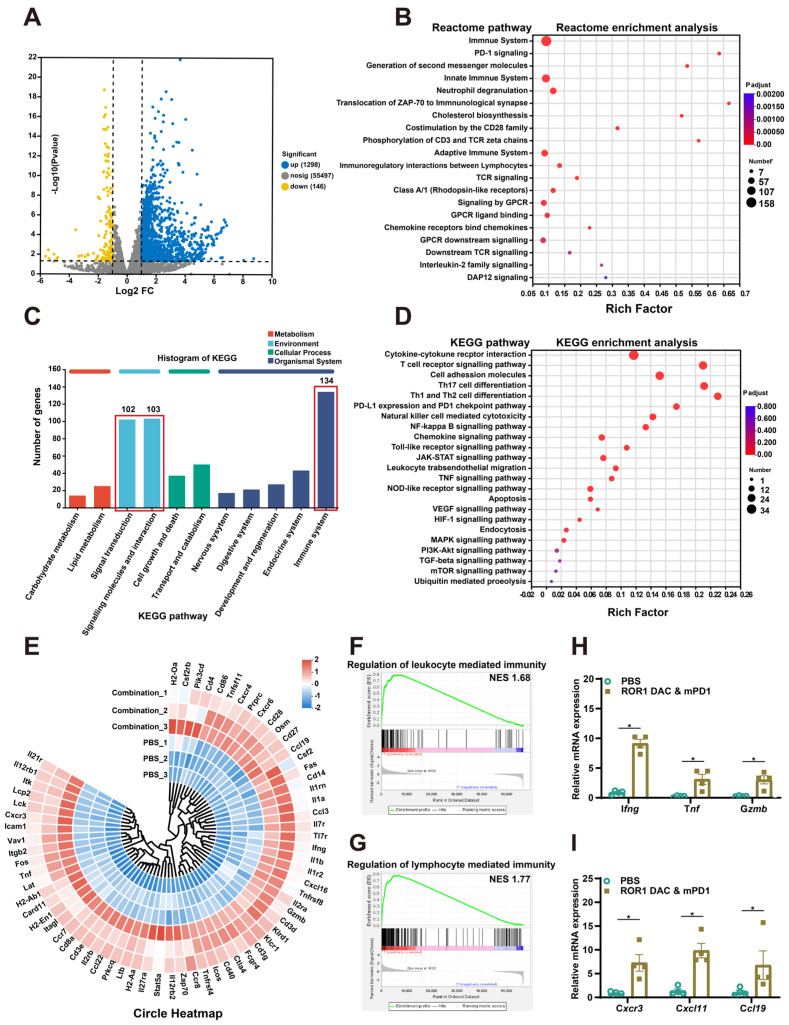
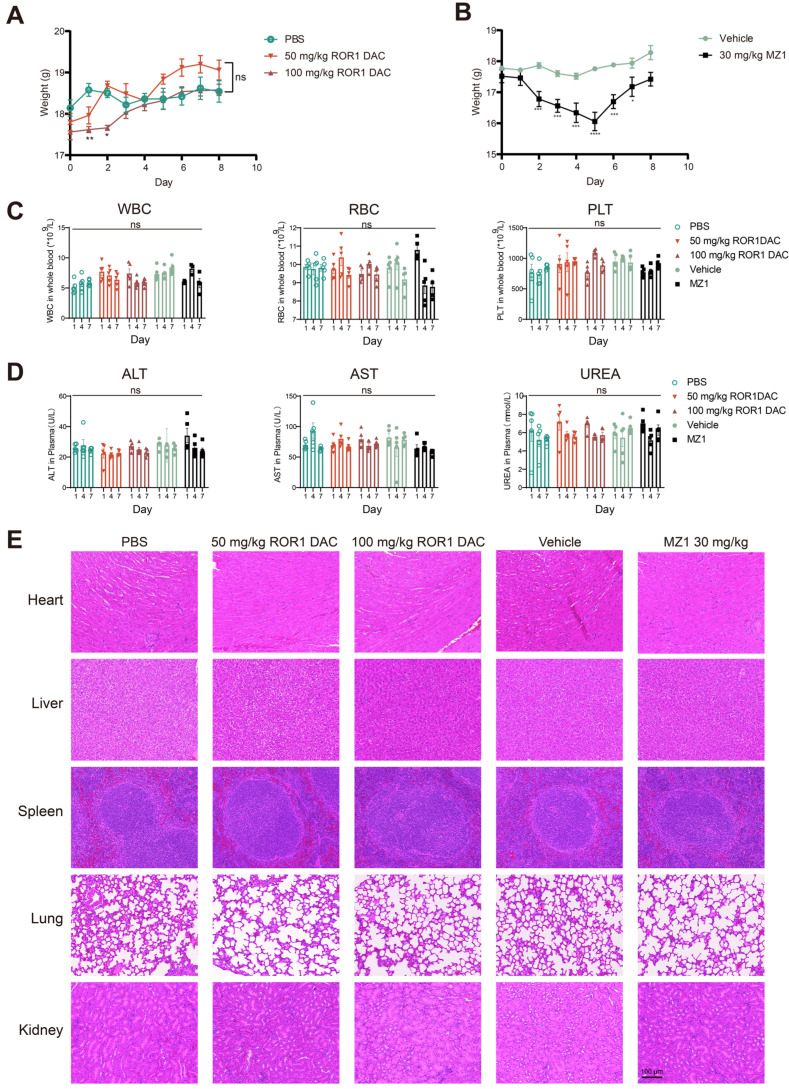
Rationale: Proteolysis Targeting Chimeras (PROTACs) are bifunctional compounds that have been extensively studied for their role in targeted protein degradation (TPD). The capacity to degrade validated or undruggable targets provides PROTACs with significant potency in cancer therapy. However, the clinical application of PROTACs is limited by their poor in vivo potency and unfavorable pharmacokinetic properties. Methods: In this study, a novel degrader-antibody conjugate (DAC) was developed by conjugating the BRD4-degrading PROTAC with the ROR1 (receptor tyrosine kinase-like orphan receptor 1) antibody. The in vitro affinity, internalization efficacy, degradation, and cytotoxic activity of the ROR1 DAC were assessed. The pharmacokinetics, antitumor activity, and acute toxicity of ROR1 DAC were evaluated in mouse models. RNA sequencing (RNA-seq) and immunohistochemistry were performed to analyze the therapeutic efficacy mediated by the combination of ROR1 DAC and anti-mouse programmed cell death protein 1 (αmPD1) mAb. Results: The ROR1 DAC exhibited strong degradation activity and cytotoxicity following antigen binding and internalization. Compared to unconjugated PROTAC, the ROR1 DAC demonstrated improved pharmacokinetics and potent antitumor efficacy in PC3 and MDA-MB-231 xenograft mouse models. Furthermore, enhanced antitumor activity and immune cell infiltration within solid tumors were observed when combined with αmPD-1 mAb in C57BL/6J mice. RNA sequencing revealed that the enhanced immune response associated with the combination treatment is related to tumor microenvironment modulation, including the upregulation of Th1-biased cytokines. Moreover, the ROR1 DAC exhibited a favorable safety profile in an acute toxicity study. Conclusions: These results indicate that the degrader-antibody conjugate is a promising candidate for tumor-specific degradation and effective cancer therapy.

Keywords: BRD4.; Degrader-antibody conjugate; PROTAC; Targeted protein degradation; Ubiquitin-proteasome system.


Conflict of interest statement

Competing interests: The authors have declared that no competing interest exists.

Figures

Figure 1
Figure 1
Generation and optimization of ROR1-BRD4 degrader conjugate. (A) Structures of compound MZ1 and degrader-antibody conjugate. The ADCC and CDC functions of ROR1 mAbs were reduced with mutations of L234A, L235A, and P329G on the Fc region. The hydroxyl group of VHL is modified with an azido group and tethered to a maleimide-PEG-DBCO linker, which is then conjugated to ROR1 mAb with mutated cysteine. (B) Cartoon illustration of the construction of PC3 cell pool stable expressing HiBiT-BRD4. The HiBiT-tag was fused to the N-terminal of the BRD4 coding sequence and subsequently cloned into the pHIV vector. Lentiviruses generated using second-generation lentiviral vectors were used to infect PC3 cells, followed by selecting stable cell pools under puromycin dihydrochloride pressure. An illustration was created with BioRender.com. (C) The cytotoxicity assay of MZ1 and JQ1 using CCK-8 kit. Cells were treated with serial-diluted JQ1 and MZ1 for four days. Cell viability was detected through the CCK-8 kit. (D) Relative BRD4-HiBiT level analysis of different groups. 100 nM ROR1 mAb, 1 μM JQ1, and 1 μM MZ1 were added to the PC3 cells expressing HiBiT-BRD4 for 6 h. The supernatants were removed, followed by a HiBiT-BRD4 level detection using the HiBiT lytic detection system. (E) Western blotting analysis of BRD4 and β-actin in cells. Cells were incubated with the 100 nM ROR1 mAb, 100 nM ROR1 DAC, 1 μM MZ1, and 1 μM JQ1 for 4 h before harvesting cell lysates. (F) ROR1 antigen-binding ELISA assay of ROR1 mAb and ROR1 conjugate with different concentrations. HiBiT-BRD4 degradation efficacy assay of DAC with different conjugation sites (G) and lengths of PEG linker (I). Serially diluted DACs were added to the PC3 cells expressing HiBiT-BRD4 for 8 h. The supernatants were removed, followed by a HiBiT-BRD4 level detection using the HiBiT lytic detection system. The cytotoxicity assay of DACs with different conjugation sites (H) and lengths of PEG linker (J). Serially diluted DACs were added to the PC3 cells for four days, followed by detection of cell viability using CCK-8. EC50 values were calculated by GraphPad Prism software 8.3.0. Mean was shown as SEM.
Figure 2
Figure 2
The antigen-specific BRD4 degradation mediated by ROR1 DAC depends on the UPS system. (A) Cell binding curve of ROR1 DAC and ROR1 mAb to PC3, MDA-MB-231, Jeko-1, and MCF-7 cells. The median fluorescence intensities (MFI) were detected by flow cytometry, and EC50 was calculated using GraphPad Prism 8.3.0. Data are presented as mean ± SEM with three replicates. (B) Western blotting analysis of BRD4 and β-actin in PC3, MDA-MB-231, Jeko-1, MCF-7 cells. Cells were incubated with the indicated concentrations of ROR1 mAb, MZ1, and ROR1 DAC for 4 h before harvesting cell lysates. Analysis of BRD4 degradation mediated by ROR1 DAC (C) or MZ1(D) at different time points. PC3 cells were treated with 100 nM ROR1 DAC or 1 μM MZ1 at different time intervals before harvesting cell lysates. The lysates were subjected to BRD4 and β-actin analysis by western blotting. Hook effect analysis of ROR1 DAC (E) or MZ1(F). PC3 cells were incubated with indicated concentrations of ROR1 DAC or MZ1 for 4 h before harvesting cell lysates. Western blotting analysis of BRD4 degradation mediated by ROR1 DAC is reversed by VHL inhibitor (G) and proteasome inhibitor (H): PC3 cells were incubated with PBS, 100 nM ROR1 mAb, 1μM MZ1, and 100 nM ROR1 DAC for 4 h with (+) or without (-) 20 μM VHL-IN-1 or 20 μM MG132. HiBiT assay of BRD4 degradation mediated by ROR1 DAC is reversed by VHL inhibitor (I) and proteasome inhibitor (J): PC3 cells were incubated with PBS, 100 nM ROR1 mAb, 100 nM ROR1 DAC, and 1μM MZ1 for 6 h with (+) or without (-) indicated concentration of VHL-IN-1 inhibitor or MG132 inhibitor.
Figure 3
Figure 3
In vitro internalization and cytotoxicity activity of ROR1 DAC. (A) Internalization imaging examination of ROR1 DAC. PC3 cells were treated with pHrodo labeled PBS, 150 nM ROR1 mAb, and 150 nM ROR1 DAC for 4 h. Subsequent staining was performed with LysoSensor for 40 min and Hoechst solution for 10 min. Scale bar: 50 µm. (B) Internalization efficiency assay of ROR1 DAC in PC3 cells. Cells were treated with 1 μg/mL ROR1 DAC for the indicated time, followed by fixation and stained with PE-labeled antibody. Flow cytometry detected the MFI values and internalization efficiency was calculated based on samples fixed at 0 h. (C) Cytotoxicity assay of ROR1 DAC on PC3, MDA-MB-231, Jelo-1, and MCF-7 cells. Cells were treated with serial-diluted ROR1 DAC and MZ1 for four days. Cell viability was detected through the CCK-8 kit. Mean was shown as SEM with duplicates. (D) Cell cycle assay of PC3 cells by flow cytometry. Cells were incubated with PBS, 100 nM ROR1 mAb, 1 μM MZ1, and 100 nM ROR1 DAC for three days. After flow cytometry detection, the cell cycle was analyzed by Flowjo.V10. (E) The histogram of early and late apoptotic cells. (F) Apoptosis assay of PC3 cells by flow cytometry. Cells were incubated with PBS, 100 nM ROR1 mAb, 1 μM MZ1, and 100 nM ROR1 DAC for four days. Cells were collected and subjected to analysis of Annexin V-PI. Data was analyzed by Flowjo.V10.
Figure 4
Figure 4
Antitumor effect of ROR1 DAC in PC3 and MDA-MB-231 xenograft mouse models. (A) The pharmacokinetics analysis of ROR1 mAb and ROR1 DAC in BALB/c mice. Mice (n = 5) were intravenously injected with 10 mg/kg of ROR1 mAb or ROR1 DAC, respectively. Serum samples were collected on the indicated days. ELISA was used to determine the concentrations of total DAC and mAb. (B) The pharmacokinetic parameters of ROR1 mAb and ROR1 DAC were calculated using PKSlover 2.0 software. (C) Schematic representation of tumor inoculation and drug treatment. (D) PC3 tumor volume changes across different groups. 5 × 10⁶ cells were implanted on the right flank of the mouse. PBS, ROR1 mAb (15 mg/kg), Isotype DAC (15 mg/kg), MZ1 (5 mg/kg), and ROR1 DAC (5 or 15 mg/kg) were administered when the tumor volume reached 50-100 mm3 every five days (n = 5). Histogram (E) and picture (F) of stripped tumor weight on PC3 xenograft mouse model. (G) Schematic representation of tumor inoculation and drug treatment on MDA-MB-231 xenograft mouse model. (H) MDA-MB-231 tumor volume changes across different groups. 5 × 10⁶ cells were implanted on the right flank of the mouse. PBS, ROR1 mAb (15 mg/kg), Isotype DAC (15 mg/kg), MZ1 (5 mg/kg), and ROR1 DAC (5 or 15 mg/kg) were administered when the tumor volume reached 50-100 mm3 every five days (n = 5). Histogram (I) and picture (J) of stripped tumor weight on the MDA-MB-231 model. Data were analyzed by One-way ANOVA and shown as Mean ± SEM. ns P > 0.05; * P < 0.05; **P < 0.01; ***P < 0.001; ****P < 0.0001.
Figure 5
Figure 5
Antitumor effect of ROR1 DAC combined with αmPD1 antibody on MC38-rhROR1 C57BL/6J mouse model. (A) Schematic representation of tumor inoculation, drug treatment, and analysis. (B) Tumor volume changes across different groups. 2 × 10⁵ cells were subcutaneously implanted and monitored every two days. Drugs were administered via the tail vein when the tumor volume reached 50-100 mm3 every three days (n = 5). (C) Histogram of stripped tumor weight. (D) Changes in body-weight changes in different groups were monitored every two days. (E) BRD4 level detection of lysed MC38-rhROR1 tumors. Flow cytometry analysis of CD8+ percentage of CD3+ cells (F) and CD4+ percentage of CD3+ cells (G) after cell isolation from the spleen. (H) Ratio of CD4+/CD8+ T cells. (I) Immunohistochemistry analysis of mouse CD3, CD4, and CD8 in stripped tumors. Scale bar: 100 µm. Data were analyzed by One-way ANOVA and shown as Mean ± SEM. ns P > 0.05; * P < 0.05; **P < 0.01; ***P < 0.001; ****P < 0.0001.
Figure 6
Figure 6
Transcriptomic analyses of MC38 tumor after ROR1 DAC and αmPD1 combination treatment. (A) Volcano plot of the differentially expressed genes (DEGs) between the control and combination treatment groups. Yellow and blue spots represent down-and upregulated DEGs (P value was 0.05 and log2 (FC)˃2). (B) Reactome enrichment analysis of DEGs. (C) KEGG annotation analysis of DEGs. The pathways of the immune system, signal transduction, and molecular interactions were annotated. (D) KEGG pathway enrichment analysis of DEGs. (E) Circle heatmap analysis of the genes implicated in the TME modulation. (F) GSEA of regulation of leukocyte mediated immunity gene set. The normalized enrichment score (NES) was 1.68, false discovery rate (FDR) < 0.25 (G) GSEA of regulation of the lymphocyte-mediated immunity gene set. NES was 1.77, FDR < 0.25. (H, I) Real-time validation for selected genes. Data were analyzed by unpaired t-tests and shown as Mean ± SEM. ns P > 0.05; * P < 0.05.
Figure 7
Figure 7
Safety evaluation of ROR1 DAC on BALB/c mice. (A) Changes in body weight of ROR1 DAC groups and MZ1 group. (B) Mice (n = 5) were intravenously injected with a single dose of PBS, 50 mg/kg ROR1 DAC, 100 mg/kg ROR1 DAC, and intraperitoneally injected with two doses of the vehicle and 30 mg/kg MZ1. Body weight was measured daily. (C) Blood routine examination in BALB/c mice. Blood collections were conducted on days 1, 4, and 7. White blood cells (WBC), red blood cells (RBC), and platelets (PLT) were monitored using the Sysmex Hemostasis Analyzer XN-1000V (B1). (D) Evaluation of liver and kidney function in BALB/c mice. Blood collections were conducted on days 1, 4, and 7. The plasmas were separated for detection. Alanine aminotransferase (ALT), aspartate aminotransferase (AST), and urea (UREA) were monitored on days 1, 4, and 7 using the Mindray Chemistry Analyzer BS360S. (E) H&E staining was performed to evaluate the tissue pathology of major organs. Scale bar: 100 µm. Data were analyzed by One-way ANOVA and shown as Mean ± SEM. ns P > 0.05; * P < 0.05; **P < 0.01; ***P < 0.001; ****P < 0.0001.

References

    1. Chirnomas D, Hornberger KR, Crews CM. Protein degraders enter the clinic - a new approach to cancer therapy. Nat Rev Clin Oncol. 2023;20:265–78. - PMC - PubMed
    1. Li X, Song Y. Proteolysis-targeting chimera (PROTAC) for targeted protein degradation and cancer therapy. J Hematol Oncol. 2020;13:50. - PMC - PubMed
    1. Zhao L, Zhao J, Zhong K, Tong A, Jia D. Targeted protein degradation: mechanisms, strategies and application. Signal Transduction and Targeted Therapy. 2022;7:113. - PMC - PubMed
    1. Gadd MS, Testa A, Lucas X, Chan KH, Chen W, Lamont DJ. et al. Structural basis of PROTAC cooperative recognition for selective protein degradation. Nat Chem Biol. 2017;13:514–21. - PMC - PubMed
    1. Békés M, Langley DR, Crews CM. PROTAC targeted protein degraders: the past is prologue. Nat Rev Drug Discov. 2022;21:181–200. - PMC - PubMed

Publication types

MeSH terms