

Classification of Severity of Lung Parenchyma Using Saliency and Discrete Cosine Transform Energy in Computed Tomography of Patients With COVID-19
- PMID: 39816708
- PMCID: PMC11729514
- DOI: 10.1155/ijta/4420410
Classification of Severity of Lung Parenchyma Using Saliency and Discrete Cosine Transform Energy in Computed Tomography of Patients With COVID-19
Abstract
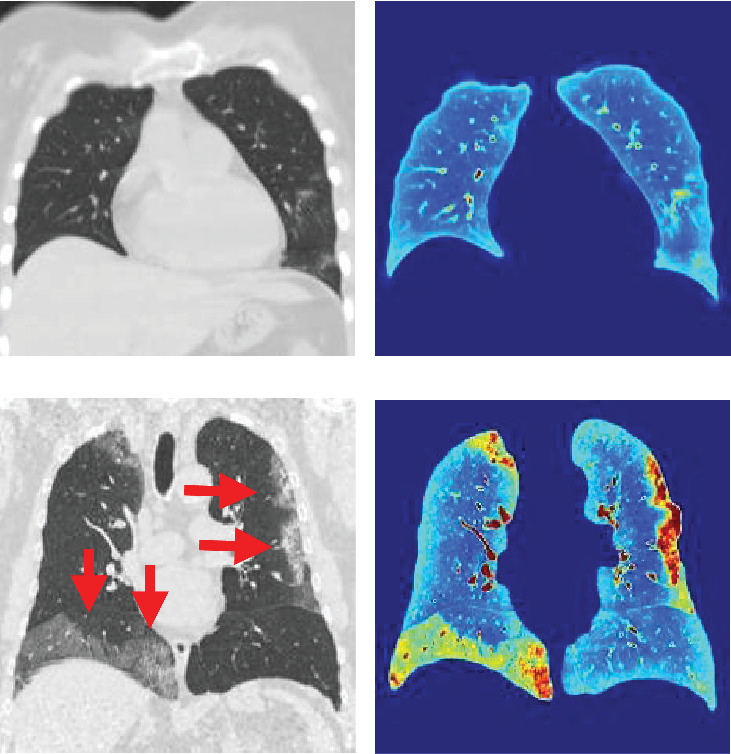
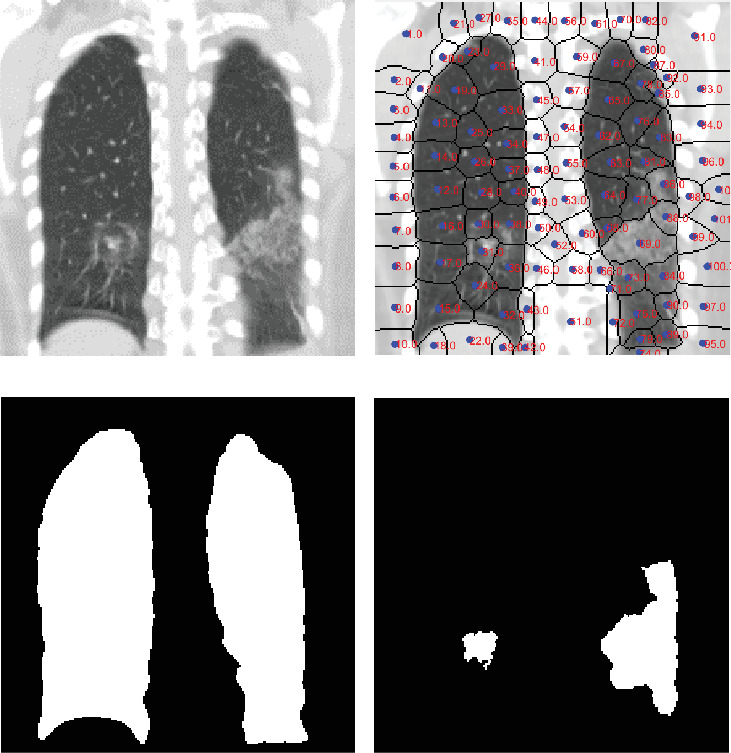
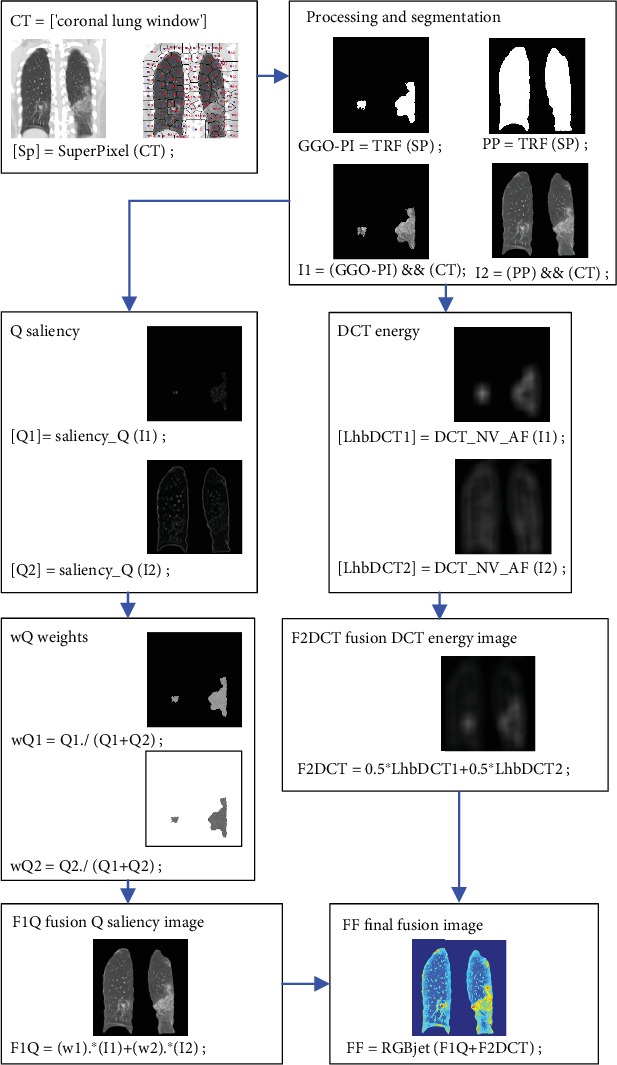
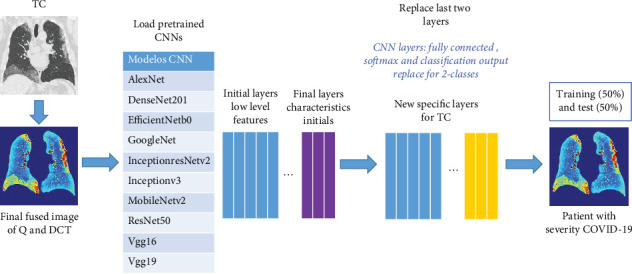
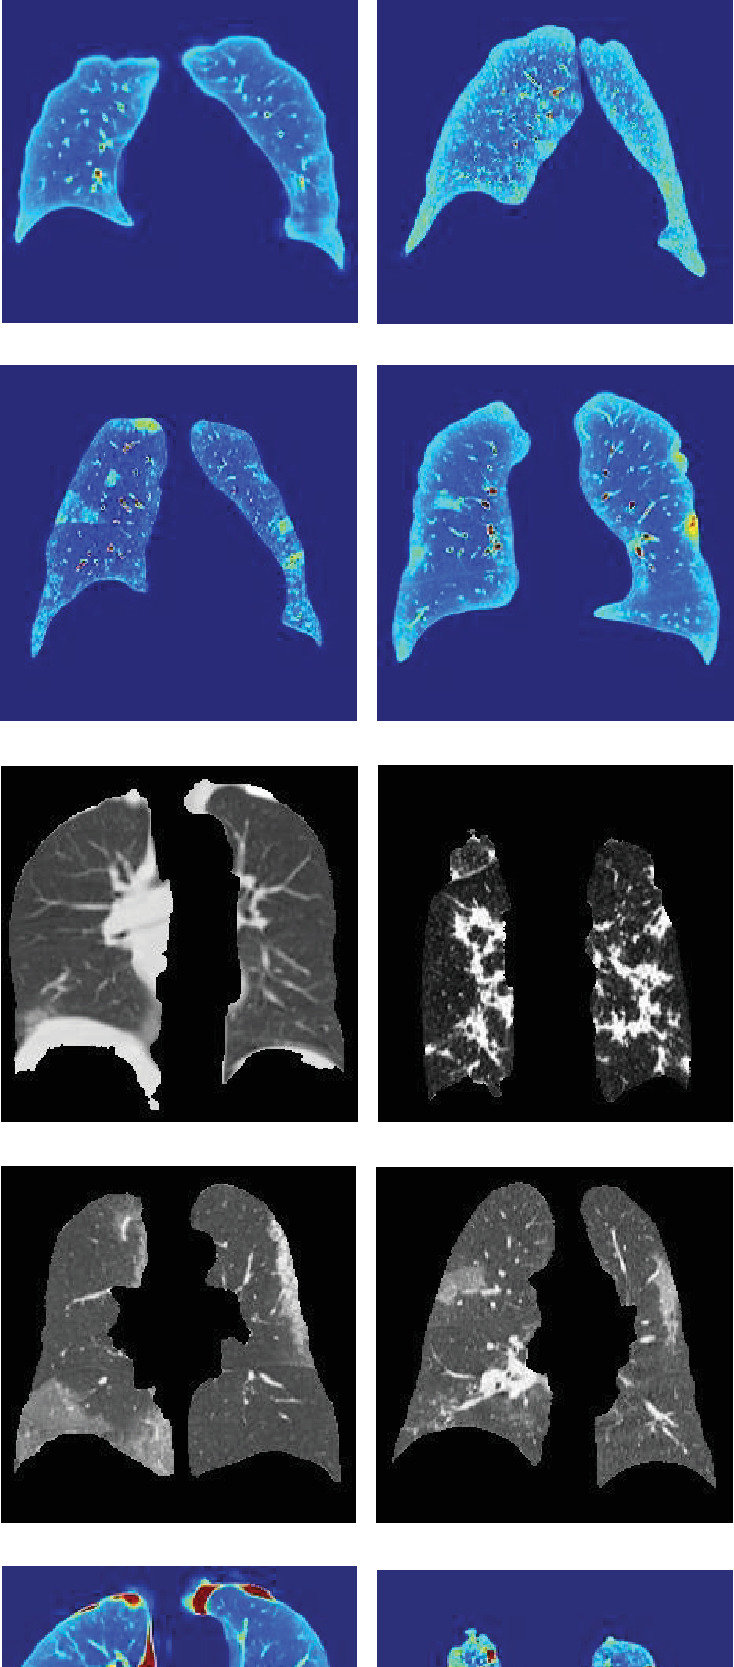
This study proposes an automated system for assessing lung damage severity in coronavirus disease 2019 (COVID-19) patients using computed tomography (CT) images. These preprocessed CT images identify the extent of pulmonary parenchyma (PP) and ground-glass opacity and pulmonary infiltrates (GGO-PIs). Two types of images-saliency (Q) image and discrete cosine transform (DCT) energy image-were generated from these images. A final fused (FF) image combining Q and DCT of PP and GGO-PI images was then obtained. Five convolutional neural networks (CNNs) and five classic classification techniques, trained using FF and grayscale PP images, were tested. Our study is aimed at showing that a CNN model, with preprocessed images as input, has significant advantages over grayscale images. Previous work in this field primarily focused on grayscale images, which presented some limitations. This paper demonstrates how optimal results can be obtained by using the FF image rather than just the grayscale PP image. As a result, CNN models outperformed traditional artificial intelligence classification techniques. Of these, Vgg16Net performed best, delivering top-tier classification results for COVID-19 severity assessment, with a recall rate of 95.38%, precision of 96%, accuracy of 95.84%, and area under the receiver operating characteristic (AUROC) curve of 0.9585; in addition, the Vgg16Net delivers the lowest false negative (FN) results. The dataset, comprising 44 COVID-19 patients, was split equally, with half used for training and half for testing.
Keywords: COVID-19; SARS-CoV-2 virus; artificial intelligence; computed tomography; medical diagnostic imaging.
Copyright © 2025 Santiago Tello-Mijares et al. International Journal of Telemedicine and Applications published by John Wiley & Sons Ltd.
Conflict of interest statement
The corresponding author's employer is the Tecnológico Nacional de México, and he is also a member of the Sistema Nacional de Investigadores SNI 1 from Consejo Nacional de Humanidades, Ciencias y Tecnologías.
Figures
Similar articles
-
Novel COVID-19 Diagnosis Delivery App Using Computed Tomography Images Analyzed with Saliency-Preprocessing and Deep Learning.Tomography. 2022 Jun 20;8(3):1618-1630. doi: 10.3390/tomography8030134. Tomography. 2022. PMID: 35736882 Free PMC article.
-
Computed Tomography Image Processing Analysis in COVID-19 Patient Follow-Up Assessment.J Healthc Eng. 2021 Apr 29;2021:8869372. doi: 10.1155/2021/8869372. eCollection 2021. J Healthc Eng. 2021. PMID: 33968356 Free PMC article.
-
[Spatial and temporal distribution and predictive value of chest CT scoring in patients with COVID-19].Zhonghua Jie He He Hu Xi Za Zhi. 2021 Mar 12;44(3):230-236. doi: 10.3760/cma.j.cn112147-20200522-00626. Zhonghua Jie He He Hu Xi Za Zhi. 2021. PMID: 33721937 Chinese.
-
Development and integration of VGG and dense transfer-learning systems supported with diverse lung images for discovery of the Coronavirus identity.Inform Med Unlocked. 2022;32:101004. doi: 10.1016/j.imu.2022.101004. Epub 2022 Jul 8. Inform Med Unlocked. 2022. PMID: 35822170 Free PMC article. Review.
-
Combating COVID-19 Using Generative Adversarial Networks and Artificial Intelligence for Medical Images: Scoping Review.JMIR Med Inform. 2022 Jun 29;10(6):e37365. doi: 10.2196/37365. JMIR Med Inform. 2022. PMID: 35709336 Free PMC article.
References
-
- World Health Organization. Coronavirus Disease 2019 (COVID-19) Situation Report - 51 . World Health Organization; 2020.
-
- World Health Organization. Coronavirus Disease (COVID-19): Weekly Epidemiological Update (4 January 2023), Vol. 124 . World Health Organization; 2023.
-
- Padhye N. S. Reconstructed diagnostic sensitivity and specificity of the RT-PCR test for COVID-19. MedRxiv . 2020;2020 doi: 10.1101/2020.04.24.20078949. - DOI
LinkOut - more resources
Full Text Sources
Research Materials
Miscellaneous
