. 2024 Jan 11:2:1298561.
doi: 10.3389/fpara.2023.1298561. eCollection 2023.

Manipulation of mitochondrial poly(A) polymerase family proteins in Trypanosoma brucei impacts mRNA termini processing

Affiliations

Manipulation of mitochondrial poly(A) polymerase family proteins in Trypanosoma brucei impacts mRNA termini processing

Clara M Smoniewski et al. Front Parasitol. .

Abstract

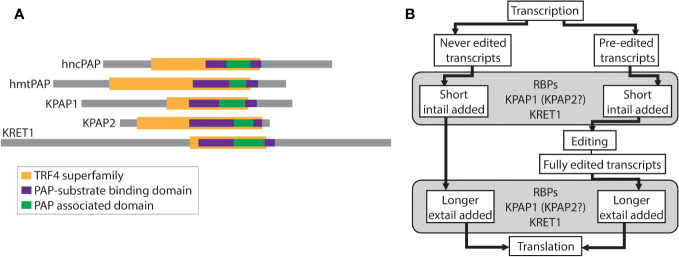
RNA-specific nucleotidyltransferases (rNTrs) add nontemplated nucleotides to the 3' end of RNA. Two noncanonical rNTRs that are thought to be poly(A) polymerases (PAPs) have been identified in the mitochondria of trypanosomes - KPAP1 and KPAP2. KPAP1 is the primary polymerase that adds adenines (As) to trypanosome mitochondrial mRNA 3' tails, while KPAP2 is a non-essential putative polymerase whose role in the mitochondria is ambiguous. Here, we elucidate the effects of manipulations of KPAP1 and KPAP2 on the 5' and 3' termini of transcripts and their 3' tails. Using glycerol gradients followed by immunoblotting, we present evidence that KPAP2 is found in protein complexes of up to about 1600 kDa. High-throughput sequencing of mRNA termini showed that KPAP2 overexpression subtly changes an edited transcript's 3' tails, though not in a way consistent with general PAP activity. Next, to identify possible roles of posttranslational modifications on KPAP1 regulation, we mutated two KPAP1 arginine methylation sites to either mimic methylation or hypomethylation. We assessed their effect on 3' mRNA tail characteristics and found that the two mutants generally had opposing effects, though some of these were transcript-specific. We present results suggesting that while methylation increases KPAP1 substrate binding and/or initial nucleotide additions, unmethylated KPAP1is more processive. We also present a comprehensive review of UTR termini, and evidence that tail addition activity may change as mRNA editing is initiated. Together, this work furthers our understanding of the role of KPAP1 and KPAP2 on trypanosome mitochondrial mRNA 3' tail addition, as well as provides more information on mRNA termini processing in general.

Keywords: African trypanosomiasis; Hidden Markov modelling; arginine methylation; mRNA tails; non-coding RNA; nucleotidyltransferases; site-directed mutagenesis.


Conflict of interest statement

The authors declare that the research was conducted in the absence of any commercial or financial relationships that could be construed as a potential conflict of interest.

Figures

Figure 1
Figure 1
Relevant schematics of nucleotidyltransferases and the relationship between editing and tailing in trypanosomes. (A) Comparison of nucleotidyltransferases. Colored bars represent identified superfamilies and domains using TritrypDB, InterPro, and NCBI’s conserved domain search. hncPAP, human non-canonical PAP; hmtPAP, human mitochondrial PAP. (B) Schematic of the relationship between mRNA editing and mRNA 3 tailing in trypanosomes. RBPs, RNA binding proteins; KPAP1, kinetoplast PAP1; KPAP2, kinetoplast PAP2; KRET1, kinetoplast RNA editing 3 TUTase.
Figure 2
Figure 2
KPAP2 protein complex status and overexpression cell line characterization. (A) KPAP2 is found both independent, and in an unidentified protein complex. Immunoblotted fractions from a glycerol gradient of the mitochondrial fraction of the KPAP2 OE cell line. Numbers above gels represent the glycerol fraction from which the protein sample was taken. Membrane probed with the KPAP2 antibody (top) or antibodies to two proteins from the RNA-editing catalytic complex: KREPA2 and 3 (bottom). The experiment was performed in duplicate, with representative gels shown. (B) When induced with tetracycline, KPAP2 OE cell line overexpresses KPAP2, which is localized to the mitochondrion, as shown by cellular fractionation immunoblot. The supernatant (S) contains proteins present in the cytosol, while the pellet (P) contains proteins of organelles including the mitochondrion. Equivalent fractions of each were loaded. PRMT1, cytosolic control; MRP2, mitochondrial control. T, total protein. (C) Growth curves of induced with tetracycline (+tet) and uninduced (-tet) cells. Every two days cells are cut back to 1x10⁶ cells/ml. Error bars represent standard deviation of the mean (n = 3).
Figure 3
Figure 3
CircTAIL-seq is used to investigate 3 tails and 3 and 5 ends of mitochondrially encoded transcripts. (A) CircTAIL-seq primer placement on in vitro circularized RNA, and PCR-based library generated in the utilization of these primers. CDS, coding sequence. Not to scale. (B) Top: The electron transport chain and mitochondrial ribosome with transcripts utilized in this study shown above the complexes of which they are a part. Complex II in grey does not have any subunits encoded in the mitochondrial genome. Bottom: Relative length and editing status of transcripts used in this study. The length of each transcript is proportional to the relative length of the mRNA prior to editing. Green, regions that do not require editing prior to translation; maroon, regions that require editing prior to translation. ND1, NADH dehydrogenase subunit 1; CYb, cytochrome b; CO1, cytochrome c oxidase subunit 1; A6, ATP synthase subunit 6; RPS12, ribosomal protein S12. (C) 3 (left) and 5 (right) UTR lengths of A6 transcripts for KPAP2 OE cell line. (D) Percent of reads that do not possess untemplated A or U additions between the ligated ends of the 3 and 5 UTRs of A6 transcripts at various editing stages in KPAP2 OE cell line. Experiment done in duplicate. Each circle or triangle represents one replicate. (E) Population density curves of tail lengths for A6 transcripts in KPAP2 OE cell line. (F) Population density curves of proportions of nucleotides that are adenine at each position along tails for A6 transcripts in KPAP2 OE cell line. The thickness of the line represents the proportion of total tails analyzed that are long enough to contribute to the data at each nucleotide position. As the lines become thinner, the proportion of tails that are available to contribute to the adenine content data approaches zero because there are very few long tails. Data is shown starting from the second nucleotide in tails to account for ambiguity in tail cutoff determination. Cells expressing KPAP2 at normal levels are uninduced (-tet, orange) and cells OE KPAP2 are induced with tetracycline (+tet, black). A6e, fully-edited A6 transcripts defined by a fully-edited canonical coding sequence including the start codon; A6p, pre-edited A6 transcripts with no evidence of editing initiation. A and B are modified from Smoniewski et al. (2023).
Figure 4
Figure 4
KPAP1 cell lines overexpress tagged KPAP1 and silence native KPAP1 when induced with tetracycline. (A) Schematic of the three versions of KPAP1 used in the KPAP1 cell lines. Bolded, underlined, blue residues indicate identified arginine methylation sites that have been subsequently mutated to indicated amino acids. WT, wildtype; RF, arginine to phenylalanine (methylmimic); RK, arginine to lysine (methylmutant). TRF4 superfamily, yellow; PAP-substrate binding domain, purple; PAP associated domain, green; location of arginine methylation, blue. (B) Immunoblotting shows similar levels of tagged KPAP1 overexpression in cell lines at day 2 following induction by tetracycline as detected by histidine antibody. Tubulin used as a loading control. (C) Cellular fractionation immunoblot. The supernatant (S) contains proteins present in the cytosol, while the pellet (P) contains organelles such as the mitochondrion. PRMT1 is used as a cytosolic control, MRP2 is used as a mitochondrial control. T, total protein. (D) RT-qPCR results show a decrease in native KPAP1 expression in induced cell (+tet) compared to uninduced cell (-tet) at day 2 following tetracycline induction. RNAi1 and 2 represent two different clones. Error bars represent standard deviation of the mean. (E) Cell growth defects associated with KPAP1 silencing are rescued by mutant KPAP1 overexpression, but not by WT KPAP1 overexpression. KPAP1 RNAi cell line silences expression of KPAP1 when induced with tetracycline. KPAP1 WT cell line when induced silences native KPAP1 while an exogenous wildtype version of KPAP1 is overexpressed. KPAP1 RF (methylmimic) and KPAP1 RK (hypomethyl) cell lines, when induced, silences native KPAP1 while an exogenous mutated version of KPAP1 is overexpressed. KPAP1 RF growth curve was extended to day 10 because of the slight difference in growth at day 8. Error bars represent standard deviation. Cells are kept in log phase growth by diluting them every two days to 1x10⁶ cells/ml. Experiments were done in triplicate. Uninduced, -tet; induced, +tet.
Figure 5
Figure 5
5 UTR length is consistent between transcripts, and mutations at KPAP1 arginine methylation sites do not affect transcripts’ UTR processing. 3 (left) and 5 (right) UTR lengths of five mitochondrial transcripts names on the far right. e, fully-edited transcripts (i.e., start codon and all required coding region uridine insertions and deletions are present); p, pre-edited transcripts (i.e., no evidence of editing initiation). 5 UTR lengths are counted so that the first nucleotide upstream of the adenine of the start codon is +1. 3 UTR lengths are counted so that the last nucleotide after the stop codon is position +1. Partially-edited transcripts were not considered. There is only one replicate for -tet CO1 as noted in the methods.
Figure 6
Figure 6
Mutations at the arginine methylation sites on KPAP1 affect likelihood of the presence of a tail on transcripts in two out of five transcripts tested. (A) Percent of reads that possess no untemplated A or U additions for two never-edited transcripts. (B) Percent of reads that possess no untemplated A or U additions for three transcripts at various stages of editing. Grey box for the early-edited CYbp tails indicates there were too few tails to analyze. Note scale differences for y-axes. Each experiment done in duplicate, represented by two of the same shape in each column.
Figure 7
Figure 7
Mutations at the arginine methylation sites on KPAP1 affect the tail length of never-edited and pre-edited transcripts. (A) Population density curves of tail lengths for never-edited transcripts CO1 and ND1 zoomed in on the more abundant shorter tails, which are less than 60 nt. (B) Population density curves of tail lengths for pre-edited and early edited transcripts A6, RPS12, and CYb. Grey box for the early-edited CYbp tails indicates there were too few tails to analyze. (C) Population density curves of tail lengths for fully-edited and late edited transcripts A6, RPS12, and CYb. Reads are derived from primers designed to bind to either pre-edited transcripts (p) or edited transcripts (e).
Figure 8
Figure 8
Mutations at the arginine methylation sites on KPAP1 affect the adenine composition of tails of never-edited and pre-edited transcripts. (A) Population density curves of proportion of adenine along tail for never-edited transcripts CO1 and ND1 zoomed in on the more abundant shorter tails, which are less than 60 nt. (B) Population density curves of proportion of adenine along tail for pre-edited and early-edited transcripts A6, RPS12, and CYb. Grey box for the early-edited CYbp tails indicates there were too few tails to analyze. (C) Population density curves of proportion of adenine along tail for fully-edited and late edited transcripts A6, RPS12, and CYb. Reads are derived from primers designed to bind to either pre-edited transcripts (p) or edited transcripts (e).
Figure 9
Figure 9
Hidden Markov modelling elucidates A- and U-addition characteristics. (A) Examples and explanations of 2-state and 3-state tail addition models. ‘N to n’ corresponds to numbers in Supplementary Tables S6, S7 , and S8 . Proportion of each circle colored is described as ‘A to n’ in Supplementary Tables S6, S7 , and S8 . Examples are derived from real data as indicated below each model. (B) Examples showing the differences between models derived from uninduced KPAP1 WT (-tet) cell lines to those that were induced (+tet). Of interest is the increase in tails that start in the primarily A-addition state 1 (0 to 1). ND1 shows differences in many proportions, including the proportion of As (red) being added in state 3. (C) Example models showing the differences between tail models derived from KPAP1 WT to KPAP1 RF cell lines. Trends of note are an increase in tails that start in the primarily A-addition state 1 and a decrease in those that stay in the A-addition state 1 (1 to 1, top and bottom panels). Also, to note, is the decrease in those that stay in primarily U-addition state 2 (2 to 2, top panel only). (D) Example models showing the differences between tail models derived from KPAP1 WT to KPAP1 RK cell lines. Two trends are a decrease in tails that start in the primarily A-addition state 1 and an increase in those that stay in primarily U-addition state 2. (E) Example models showing the decrease in tails that stay in the primarily U-addition state 2 between those on pre-edited transcripts and those on early-edited transcripts. For all models, the arrow width is proportionate to the percentage of tails following the path. Proportion of color in each circle is relative to the proportion of As or Us being added in each state.

Similar articles

References

    1. Aphasizhev R., Aphasizheva I., Simpson L. (2003). A tale of two TUTases. Proc. Natl. Acad. Sci. 100, 10617–10622. doi: 10.1073/pnas.1833120100 - DOI - PMC - PubMed
    1. Aphasizhev R., Sbicego S., Peris M., Jang S.-H., Aphasizheva I., Simpson A. M., et al. . (2002). Trypanosome mitochondrial 3’ terminal uridylyl transferase (TUTase): The key enzyme in u-insertion/deletion RNA editing. Cell 108, 637–648. doi: 10.1016/S0092-8674(02)00647-5 - DOI - PubMed
    1. Aphasizheva I., Alfonzo J., Carnes J., Cestari I., Cruz-Reyes J., Göringer H. U., et al. . (2020). Lexis and grammar of mitochondrial RNA processing in trypanosomes. Trends Parasitol. 36, 337–355. doi: 10.1016/j.pt.2020.01.006 - DOI - PMC - PubMed
    1. Aphasizheva I., Aphasizhev R. (2010). RET1-catalyzed uridylylation shapes the mitochondrial transcriptome in trypanosoma brucei . Mol. Cell. Biol. 30, 1555–1567. doi: 10.1128/MCB.01281-09 - DOI - PMC - PubMed
    1. Aphasizheva I., Maslov D., Wang X., Huang L., Aphasizhev R. (2011). Pentatricopeptide repeat proteins stimulate mRNA adenylation/uridylation to activate mitochondrial translation in trypanosomes. Mol. Cell 42, 106–117. doi: 10.1016/j.molcel.2011.02.021 - DOI - PMC - PubMed

LinkOut - more resources