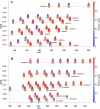
. 2025 Jan 6;5(3):300-315.
doi: 10.1039/d4ea00125g. eCollection 2025 Mar 13.

Photodegradation of naphthalene-derived particle oxidation products

Affiliations

Photodegradation of naphthalene-derived particle oxidation products

Félix Sari Doré et al. Environ Sci Atmos. .

Abstract

While photochemical aging is known to alter secondary organic aerosol (SOA) properties, this process remains poorly constrained for anthropogenic SOA. This study investigates the photodegradation of SOA produced from the hydroxyl radical-initiated oxidation of naphthalene under low- and high-NO x conditions. We used state-of-the-art mass spectrometry (MS) techniques, including extractive electrospray ionization and chemical ionization MS, for the in-depth molecular characterization of gas and particulate phases. SOA were exposed to simulated irradiation at different stages, i.e., during formation and growth. We found a rapid (i.e. >30 min) photodegradation of high-molecular-weight compounds in the particle-phase. Notably, species with 20 carbon atoms (C20) decreased by 2/3 in the low-NO x experiment which was associated with particle mass loss (∼12%). Concurrently, the formation of oligomers with shorter carbon skeletons in the particle-phase was identified along with the release of volatile products such as formic acid and formaldehyde in the gas-phase. These reactions are linked to photolabile functional groups within the naphthalene-derived SOA products, which increases their likelihood of being degraded under UV light. Overall, photodegradation caused a notable change in the molecular composition altering the physical properties (e.g., volatility) of naphthalene-derived SOA.


Conflict of interest statement

There are no conflicts to declare.

Figures
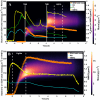
Fig. 1
Fig. 1. Evolution of SOA mass concentration measured by the SMPS and chamber conditions for (A) low-NOx and (B) high-NOx experiment. The mass loadings of the various sizes of particles are indicated by the color scale. t = 0 hours marked the start of the UV lights, and dotted white bars indicate the period when UV lights were turned on. The chamber conditions monitored include the total SOA mass (wall-loss corrected, orange circles), RH (blue), ozone (green), and non-methane hydrocarbon (NMHC, yellow). NMHC was used to monitor the naphthalene concentrations as well as the TME injected. The measurement unit was ppmC, meaning that the real concentrations of naphthalene and TME were respectively 10 times and 6 times lower than what the NMHC suggests.
Fig. 2
Fig. 2. Time evolution of the relative intensity of species (the sum of all compounds amounting to 1) and wall-corrected organic mass measured by the EESI-TOF and SMPS, respectively, for (A) the low-NOx experiment (t = −0.7 hours to 2.6 hours) and (B) the high-NOx experiment (t = 0.4 hours to 6.6 hours). The evolution of the signal for the gaseous species, measured by the CI (full lines) and the Vocus (dotted lines), was shown in (C) and (D) for the low-NOx and high-NOx experiments, respectively. The irradiation period started at t = 0 hours and is delimited by the yellow lines, ending just over t = 1 hour for (A) and (C), and ending at t ∼1.5 hours for (C) and (D).
Fig. 3
Fig. 3. Evolution of the relative signal of particle-phase species during the low-NOx experiment, with compounds grouped by carbon and hydrogen numbers. Red indicates that the species are close to their maximum relative intensity, while blue signals a low relative intensity. UV lights are indicated by the yellow box.
Fig. 4
Fig. 4. Stacked generalized Kendrick analysis plots for (A) monomers and (B) dimers during the low-NOx experiment. The multiple rings show the elapsed time from the start of the experiment (largest and lowest ring) to the end of the experiment (smallest and highest ring). The relative intensity of each compound is indicated by the color (blue = low intensity, red = high intensity, grey = medium intensity). The yellow and black rings indicate the beginning and the end of the irradiation period respectively.
Fig. 5
Fig. 5. (A) Photodegradation mechanism of C20HxOy dimers. The time evolution of formic acid (HC(O)OH), acetic acid (CH3C(O)OH), and acetaldehyde (CH3CHO) are shown during (B) low- and (C) high-NOx experiments. The intensity of the HC(O)OH and CH3CHO signals was adjusted for easier visualization. t = 0 hours indicate the start of lights, and the yellow box indicates the irradiation period.
Fig. 6
Fig. 6. (A) Volatility distribution of the particulate oxidation products for the low-NOx experiment before photodegradation (t = −0.1 h) and (B) after photodegradation (t = 1.13 h). (C) Volatility distribution for the high-NOx experiment at the beginning of photodegradation (t = 0.37 h) and (D) after photodegradation (t = 1.73 h). Colors indicate the fraction of ultra-low volatilite (ULVOCs), extremely low volatilite (ELVOCs), low volatilite (LVOCs), semi-volatile (SVOCs) and intermediate volatilite (IVOCs) organic compounds respectively.

References

    1. Burnett R. Chen H. Szyszkowicz M. Fann N. Hubbell B. Pope C. A. Apte J. S. Brauer M. Cohen A. Weichenthal S. Coggins J. Di Q. Brunekreef B. Frostad J. Lim S. S. Kan H. Walker K. D. Thurston G. D. Hayes R. B. Lim C. C. Turner M. C. Jerrett M. Krewski D. Gapstur S. M. Diver W. R. Ostro B. Goldberg D. Crouse D. L. Martin R. V. Peters P. Pinault L. Tjepkema M. Van Donkelaar A. Villeneuve P. J. Miller A. B. Yin P. Zhou M. Wang L. Janssen N. A. H. Marra M. Atkinson R. W. Tsang H. Quoc Thach T. Cannon J. B. Allen R. T. Hart J. E. Laden F. Cesaroni G. Forastiere F. Weinmayr G. Jaensch A. Nagel G. Concin H. Spadaro J. V. Global estimates of mortality associated with long-term exposure to outdoor fine particulate matter. Proc. Natl. Acad. Sci. U. S. A. 2018;115:9592–9597. doi: 10.1073/pnas.1803222115. - DOI - PMC - PubMed
    1. Shiraiwa M. Ueda K. Pozzer A. Lammel G. Kampf C. J. Fushimi A. Enami S. Arangio A. M. Fröhlich-Nowoisky J. Fujitani Y. Furuyama A. Lakey P. S. J. Lelieveld J. Lucas K. Morino Y. Pöschl U. Takahama S. Takami A. Tong H. Weber B. Yoshino A. Sato K. Aerosol Health Effects from Molecular to Global Scales. Environ. Sci. Technol. 2017;51:13545–13567. doi: 10.1021/acs.est.7b04417. - DOI - PubMed
    1. Déméautis T. Delles M. Tomaz S. Monneret G. Glehen O. Devouassoux G. George C. Bentaher A. Pathogenic Mechanisms of Secondary Organic Aerosols. Chem. Res. Toxicol. 2022;35(7):1146–1161. - PubMed
    1. Pöschl U. Atmospheric Aerosols: Composition, Transformation, Climate and Health Effects. Angew. Chem., Int. Ed. 2005;44:7520–7540. doi: 10.1002/anie.200501122. - DOI - PubMed
    1. Haywood J. Boucher O. Estimates of the direct and indirect radiative forcing due to tropospheric aerosols: A review. Rev. Geophys. 2000;38:513–543. doi: 10.1029/1999RG000078. - DOI

LinkOut - more resources