

Application of the DRASTIC Model to Assess the Vulnerability of Groundwater Contamination Near Zaporizhzhia Nuclear Power Plant, Ukraine
- PMID: 39816973
- PMCID: PMC11731315
- DOI: 10.1021/acsestwater.4c00891
Application of the DRASTIC Model to Assess the Vulnerability of Groundwater Contamination Near Zaporizhzhia Nuclear Power Plant, Ukraine
Abstract
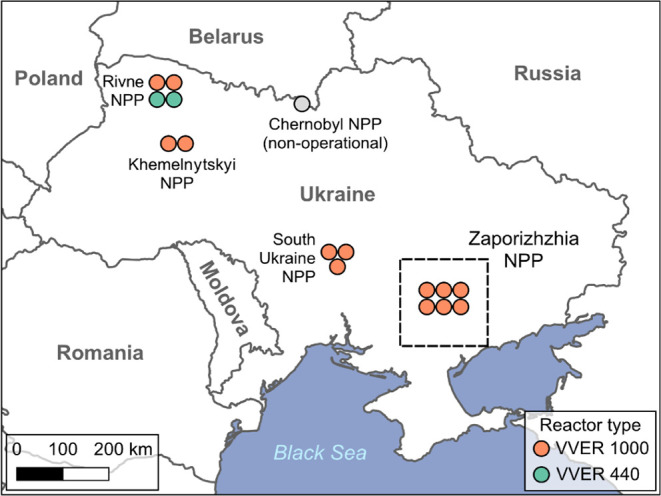
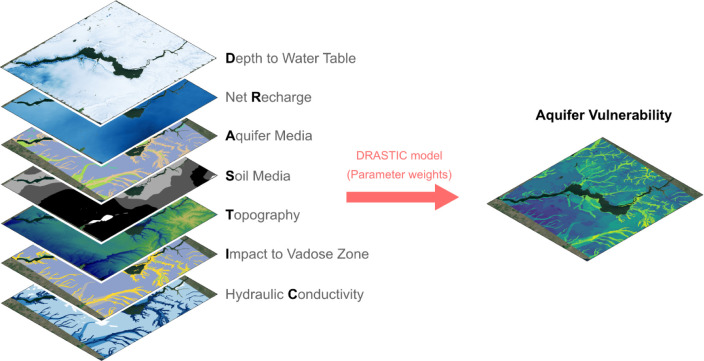
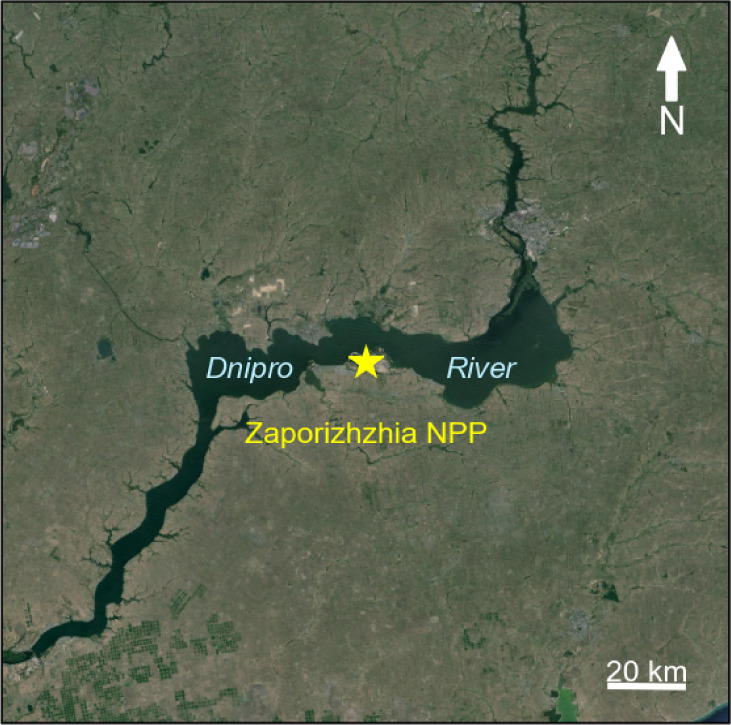
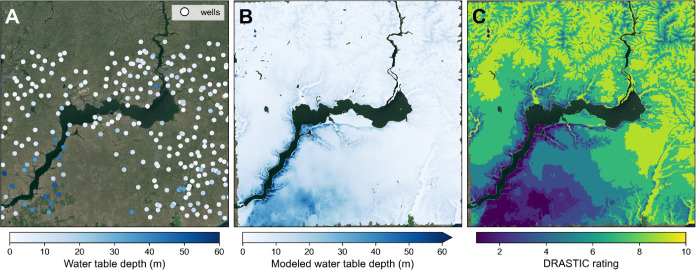
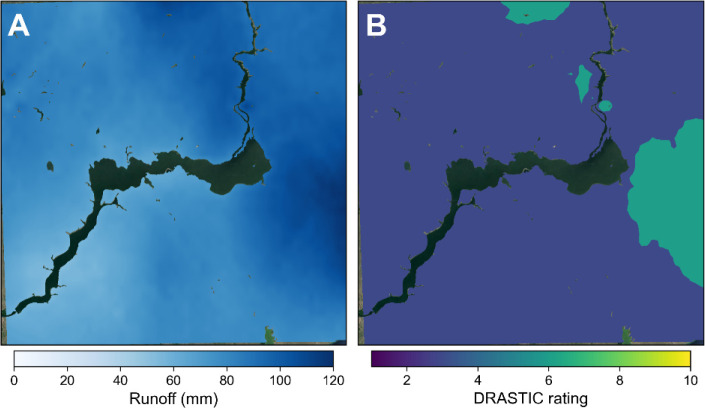
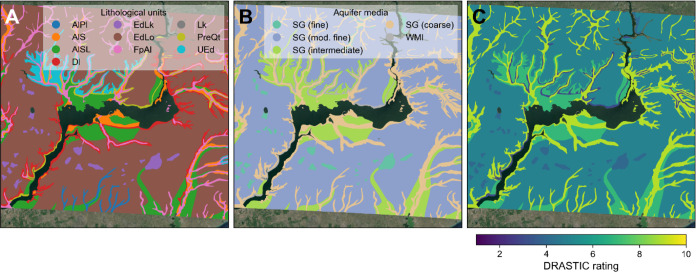
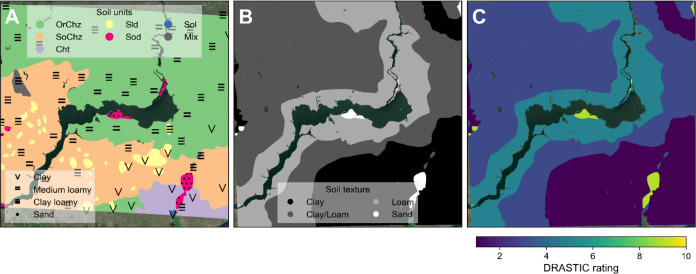
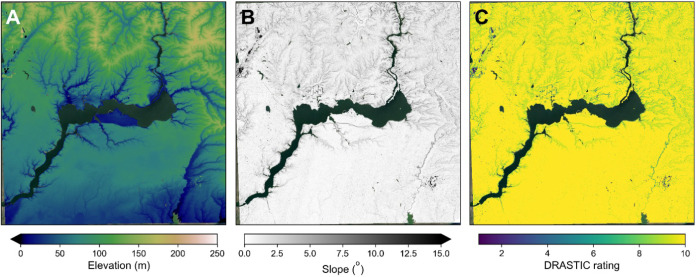
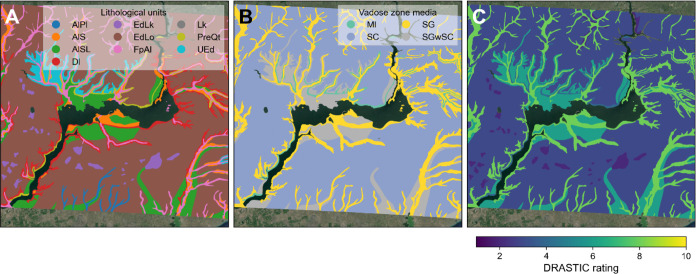
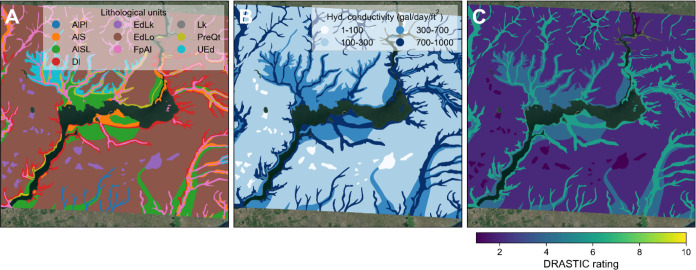
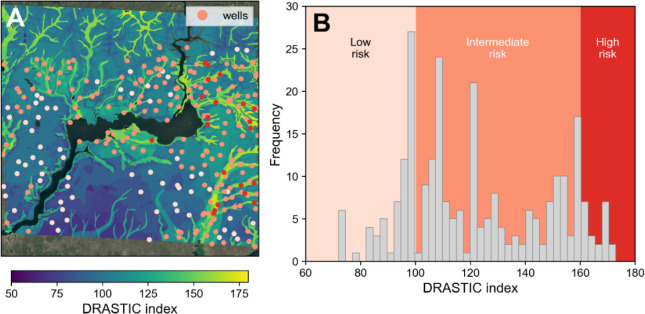
Russia's invasion of Ukraine continues to have a devastating effect on the well-being of Ukrainians and their environment. We evaluated a major environmental hazard caused by the war: the potential for groundwater contamination in proximity to the Zaporizhzhia Nuclear Power Plant (NPP). We quantified groundwater vulnerability with the DRASTIC index, which was originally developed by the United States Environmental Protection Agency and has been used at various locations worldwide to assess relative pollution potential. We found that there are two major gradients of groundwater vulnerability in the region: (1) broadly higher risk to the northeast of the NPP and lower risk to the southeast driven by a regional gradient in water availability and water table depth; and (2) higher risk in proximity to the channels and floodplains of the Dnipro River and tributaries, which host coarser-textured soils and sedimentary deposits. We also found that the DRASTIC vulnerability index can be used to identify and prioritize groundwater well-network monitoring. These and more detailed assessments will be necessary to prioritize monitoring and remediation strategies across Ukraine in the event of a nuclear accident, and more broadly demonstrate the utility of the DRASTIC approach for prognostic contamination risk assessment.
© 2024 The Authors. Published by American Chemical Society.
Conflict of interest statement
The authors declare no competing financial interest.
Figures
Similar articles
-
The environmental health impacts of Russia's war on Ukraine.J Occup Med Toxicol. 2024 Jan 5;19(1):1. doi: 10.1186/s12995-023-00398-y. J Occup Med Toxicol. 2024. PMID: 38183124 Free PMC article. Review.
-
A high-resolution nitrate vulnerability assessment of sandy aquifers (DRASTIC-N).J Environ Manage. 2021 Jan 1;277:111330. doi: 10.1016/j.jenvman.2020.111330. Epub 2020 Sep 21. J Environ Manage. 2021. PMID: 32971506
-
Mapping and assessment of groundwater pollution risks in the main aquifer of the Mostaganem plateau (Northwest Algeria): utilizing the novel vulnerability index and decision tree model.Environ Sci Pollut Res Int. 2024 Jul;31(32):45074-45104. doi: 10.1007/s11356-024-34093-0. Epub 2024 Jul 3. Environ Sci Pollut Res Int. 2024. PMID: 38958857
-
Regional Aquifer Vulnerability and Pollution Sensitivity Analysis of Drastic Application to Dahomey Basin of Nigeria.Int J Environ Res Public Health. 2020 Apr 10;17(7):2609. doi: 10.3390/ijerph17072609. Int J Environ Res Public Health. 2020. PMID: 32290197 Free PMC article.
-
GIS-based multicriteria and artificial neural network (ANN) investigation for the assessment of groundwater vulnerability and pollution hazard in the Braga shallow aquifer (Central Tunisia): A critical review of generic and modified DRASTIC models.J Contam Hydrol. 2023 Nov;259:104245. doi: 10.1016/j.jconhyd.2023.104245. Epub 2023 Sep 20. J Contam Hydrol. 2023. PMID: 37769359 Review.
References
-
- Groundwater Vulnerability: Chernobyl Nuclear Disaster, Faybishenko B.; Nicholson T., Eds.; Special Publications; AGU, American Geophysical Union: Washington, D.C, 2015.
-
- Aller L.; Bennet T.; Lehr J. H.; Petty R. J.; Hackett G.. DRASTIC: A Standardized System for Evaluating Ground Water Pollution Potential Using Hydrogeologic Settings; EPA US, 1987.
-
- Prokip A.Why the Zaporizhzhia Nuclear Power Plant Matters for the Whole World; Woodrow Wilson International Center for Scholars, 2022. https://www.wilsoncenter.org/blog-post/why-zaporizhzhia-nuclear-power-pl.... accessed 2024 March 17.
LinkOut - more resources
Full Text Sources