. 2025 Dec;14(1):2455585.
doi: 10.1080/22221751.2025.2455585. Epub 2025 Feb 3.

Vδ2 T-cells response in people with Mpox infection: a three-month longitudinal assessment

Affiliations

Vδ2 T-cells response in people with Mpox infection: a three-month longitudinal assessment

Eleonora Cimini et al. Emerg Microbes Infect. 2025 Dec.

Abstract

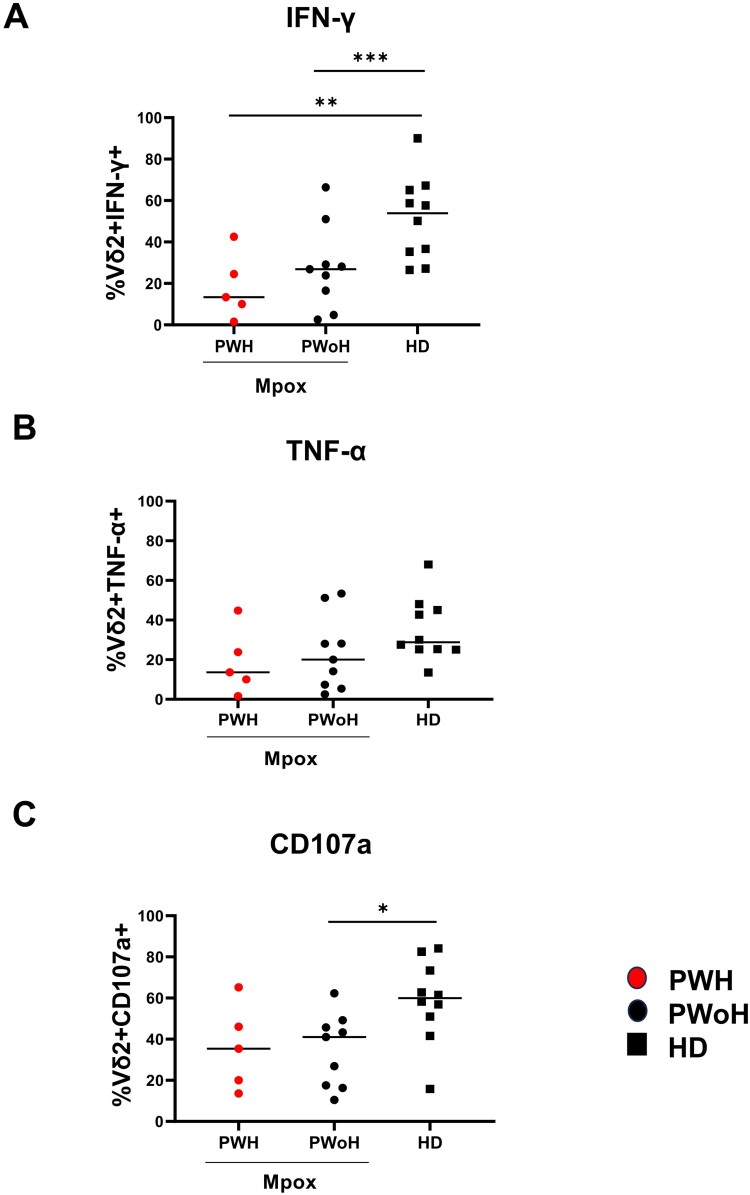
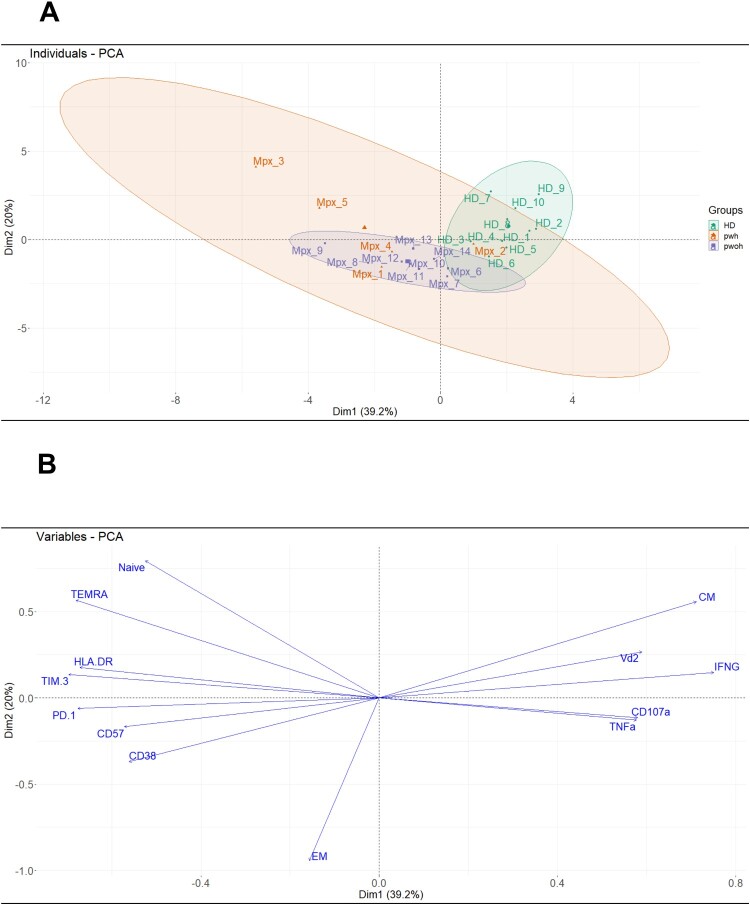
The first evidence that Orthopoxvirus induced the expansion in vivo and the recall of effector innate Vδ2 T-cells was described in a macaque model. Although, an engagement of αβ T-cells specific response in patients infected with human monkeypox (Mpox) was demonstrated, little is known about the role of γδ T-cells during Mpox infection. IFN-γ-producing γδ T-cells in the resistance to poxviruses may a key role in inducing a protective type 1 memory immunity. We analyzed the kinetics of Vδ2 T-cell response from the acute phase up to three months after Mpox infection. Fourteen MSM subjects (5 PWH, 35.7%) were enrolled in a longitudinal study from May to July 2022. Blood samples were collected in the early phase of infection (T1, T2) and at 3 months (T3M) post-symptom onset. Vδ2 T-cell profiles (CD45RA/CCR7), activation/exhaustion markers (CD38/HLA-DR/CD57/PD-1/TIM-3), cytokine production (IFN-γ/TNF-α) and CD107a expression were assessed by multiparametric flow cytometry. Ten healthy donors (HD) were used as a control group. At T1, Vδ2 T-cell frequency of patients decreased, and effector memory Vδ2 T-cells increased with respect to HD. Activation/exhaustion markers were higher than HD. Vδ2 functionality decreased at T1 related to HD, and it was associated with CD38 and HLA-DR higher expression as well as TIM-3. Vδ2 T-cells restored their profile at T3M. The presence of effector/activated Vδ2 T-cells in the early stages of Mpox infection and their capability to activate quickly, producing pro-inflammatory cytokines, may be useful to enhance the early adaptive response to human Mpox, maintaining a protective memory/effector T-cell response.

Keywords: Innate immunity; Mpox; Vδ2 T-cells; emerging viruses; exhaustion.


Conflict of interest statement

No potential conflict of interest was reported by the author(s).

Figures

Figure 1.
Figure 1.
Vδ2 T-cell phenotypic profile in the early phase of Mpox infection. Frequency (A) differentiation profile (B) were performed on PBMC of Mpox subjects (PWH with red dots and PWoH with black dots) and healthy controls (black square) by multiparametric flow cytometry in the early phase of Mpox infection (T1). Statistical significance was performed by GraphPad Prism. (A) *p = 0.02; **p = 0.0027. (B) *p = 0.01; **p = 0.004; ***p = 0.0001.
Figure 2.
Figure 2.
Vδ2 T-cell activation/exhaustion markers in the early phase of Mpox infection. Activation markers (A–B: CD38 and HLA-DR), exhaustion and senescence markers (C–E: PD-1, CD57, TIM-3) were performed on PBMC of Mpox subjects (PWH with red dots and PWoH with black dots) and healthy controls (black square) by multiparametric flow cytometry in the early phase of Mpox infection (T1). Statistical significance was performed by GraphPad Prism. (A) **p = 0.005; **p = 0.001. (B) ***p = 0.0007; **p = 0.003. (C) *p = 0.01; **p = 0.002. (D) *p = 0.01; (E) *p = 0.04; **p = 0.002.
Figure 3.
Figure 3.
Vδ2 T-cell functionality in the early phase of Mpox infection. IFN-γ (A) and TNF-α (B) production, as well as CD107a (C) expression, were performed by multiparametric flow cytometry on PBMC of Mpox subjects (PWH with red dots and PWoH with black dots) and healthy controls (black square) after 20 h of specific PhAg stimulation in the early phase of Mpox infection (T1). Statistical significance was performed by GraphPad Prism. (A) *p = 0.02; **p = 0.008. (C) *p = 0.01.
Figure 4.
Figure 4.
Vδ2 T-cell profile in the acute phase of Mpox infection. Principal Component Analysis of Vδ2 T cell profile in Mpox subjects (early phase of infection, T1) and in healthy controls, marked in orange and green (A), respectively, and the contributing variables plot (B). The cumulative variance of PCs 1 and 2 was 59.2%, while for each sample group, 95% confidence ellipses and centroids were calculated.
Figure 5.
Figure 5.
Vδ2 T-cell phenotypic profile after the acute phase up to three months from infection. Longitudinal analysis of the frequency (A), differentiation profile (B) and CD38 expression were performed on PBMC of Mpox subjects (PWH with red dots and PWoH with black dots) and healthy controls (with black square dots and median value was shown as a line) by multiparametric flow cytometry at T2 and T3M post infection. Statistical significance was performed by GraphPad Prism. (A) T1 vs T2: *p = 0.01; T1 vs HD: *p = 0.01; T3M vs HD: **p = 0.003. (B) T1 vs HD: **p = 0.003; T2 vs HD: **p = 0.002. (C) T1 vs T2: *p = 0.01; T1 vs HD: ***p = 0.0002; T2 vs HD: *p = 0.01.
Figure 6.
Figure 6.
Vδ2 T-cell activation/exhaustion markers after the acute phase up to three months from infection. Activation marker (HLA-DR), exhaustion and senescence markers (B-D: PD-1, CD57, TIM-3) were performed on PBMC of Mpox subjects (PWH with red dots and PWoH with black dots) and healthy controls (with black square dots and median value was shown as a line) by multiparametric flow cytometry at T2 and T3M post infection. Statistical significance was performed by GraphPad Prism. (A) T1 vs HD: **p = 0.005. (B) T1 vs T3M: *p = 0.01; T1 vs HD: ***p = 0.0007; T2 vs HD: **p = 0.002. (C) T1 vs T3M: *p = 0.01; T1 vs HD: **p = 0.008; T2 vs HD: **p = 0.005. (D) T1 vs T3M: *p = 0.01; T1 vs HD: **p = 0.001; T2 vs HD: **p = 0.008; T3 vs HD: **p = 0.001.
Figure 7.
Figure 7.
Vδ2 T-cell functionality after the acute phase up to three months from Mpox infection. IFN γ (A) and TNFα (B) production, as well as CD107a expression (C), were performed by multiparametric flow cytometry on PBMC of Mpox subjects (PWH with red dots and PWoH with black dots) and healthy controls (with black square dots and median value was shown as a line) after 18 h of specific PhAg stimulation at T2 and T3M post infection. Statistical significance was performed by GraphPad Prism. (A) T1 vs T3M: *p = 0.04; T1 vs HD: **p = 0.038; T3M vs HD: *p = 0.02. (C) T1 vs HD: *p = 0.01.

References

    1. Sun Y, Nie W, Tian D, et al. . Human monkeypox virus: epidemiologic review and research progress in diagnosis and treatment. J Clin Virol. 2024;171:105662. doi:10.1016/j.jcv.2024.105662 - DOI - PubMed
    1. World Health Organization ; [cited 2024 May 18]. Available from: https://www.who.int/europe/news/item/23-07-2022-who-director-general-dec...
    1. Abdullah F. Monkeypox virus: future role in Human population. J Infect Public Health. 2022;15:1270–1275. doi:10.1016/j.jiph.2022.10.002 - DOI - PMC - PubMed
    1. [cited 2024 Jun 03]. Available from: https://monkeypoxreport.ecdc.europa.eu/
    1. Zucker J. CROI 2023: epidemiology, diagnosis, and management of mpox; [2023 Apr 19]. Available from: https://www.iasusa.org/wp-content/uploads/2023/04/30-3-zucker-v1.pdf - PMC - PubMed