. 2025 Apr;66(4):1288-1303.
doi: 10.1111/epi.18261. Epub 2025 Jan 16.

Distinct peripheral pro-inflammatory profile associated with tuberous sclerosis complex and epilepsy

Affiliations

Distinct peripheral pro-inflammatory profile associated with tuberous sclerosis complex and epilepsy

Renaud Balthazard et al. Epilepsia. 2025 Apr.

Abstract

Objective: Tuberous sclerosis complex (TSC) is a monogenetic disorder associated with sustained mechanistic target of rapamycin (mTOR) activation, leading to heterogeneous clinical manifestations. Epilepsy and renal angiomyolipoma are the most important causes of morbidity in adult people with TSC (pwTSC). mTOR is a key player in inflammation, which in turn could influence TSC-related clinical manifestations. Reliable biomarkers are lacking to monitor and predict evolution and response to treatment for epilepsy in pwTSC. Inflammation has been implicated in epileptogenesis in non-TSC-related epilepsy. We aimed to characterize the relation between markers of neuroglial activation/injury, markers of peripheral inflammation, and active epilepsy in pwTSC to identify accessible biomarkers and potential new therapeutic targets.

Methods: We performed a cross-sectional study to investigate markers of central nervous system (CNS) (neurofilament light [NfL] and glial fibrillary acidic protein [GFAP]) and peripheral (45 cytokines) inflammation in the peripheral blood of pwTSC (n = 46) vs age- and sex-matched healthy controls (HCs) (n = 26). In pwTSC, markers associated with active epilepsy (n = 23/46) were compared to non-TSC epilepsy controls (n = 18). Observations on markers of neuroglial activation/injury (GFAP, NfL) were confirmed in an independent TSC cohort (n = 45; 69% with active epilepsy).

Results: We report that TSC is characterized by elevated serum levels of marker of astrogliosis (GFAP), pro-inflammatory molecules (interleukin 1β [IL-1β], CXCL8) and trophic factor (epidermal growth factor [EGF]) compared to HCs and to non-TSC-related epilepsy controls. Among pwTSC, renal angiomyolipoma presence and size was associated with IL-15. It is notable that active epilepsy in pwTSC was associated with higher levels of GFAP compared to pwTSC without epilepsy, which was confirmed in an external validation cohort, and with elevated levels of pro-inflammatory cytokines (IL-17A, IL-17C, tumor necrosis factor α [TNF-α]), not significantly related to seizure activity or treatment with mTOR inhibitor. These associations remained significant after adjusting for age and sex.

Significance: These results suggest that key inflammatory mediators could contribute to epileptogenesis and represent novel biomarkers and therapeutic targets in TSC.

Keywords: Epilepsy; GFAP; Neuroinflammation; Tuberous sclerosis complex.


Conflict of interest statement

P.M. is a local principal investigator for Zogenix (1501, 1503, 1504) and a local principal investigator for Marinus. He served as a consultant for Jazz Pharma and an invited speaker for UCB. M.R.K reports unrestricted educational grants from UCB, Eisai, Jazz Pharmaceuticals, and Paladin, as well as research grants for investigator‐initiated studies from UCB and Eisai. The remaining authors have no conflicts of interest. We confirm that we have read the Journal's position on issues involved in ethical publication and affirm that this report is consistent with those guidelines.

Figures
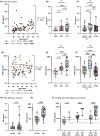
FIGURE 1
FIGURE 1
Active epilepsy in pwTSC is associated with elevated levels of markers of neuroglial injury in the serum. (A–C) Serum levels of neurofilament light (NfL) and (D–F) glial fibrillary acidic protein (GFAP) in samples from healthy controls (HCs, n = 25) and people with TSC (pwTSC, n = 46) as assessed by single molecule array (SIMOA) analysis. (A, D) Spearman correlation of NfL (A) or GFAP (D) levels with age at sampling in HCs and in pwTSC. (B, E) Levels of NfL (B) or GFAP (E) among pwTSC according to genetic mutation. NMI: Tested but no common mutation identified in TSC1 or TSC2 (n = 6); TSC1: TSC1 mutation identified (n = 9); TSC2: TSC2 mutation identified (n = 19). Kruskal–Wallis (horizontal bracket) followed by Dunn's multiple comparisons test. (C, F) Serum levels of NfL (C) and GFAP (F) in pwTSC comparing individuals with active epilepsy (Epi+, n = 23) vs those without (No epi, n = 23) vs non‐TSC epilepsy controls (Ctl Epi, n = 18). Kruskal–Wallis (horizontal bracket) followed by Dunn's multiple comparisons test. (G, H) Plasma levels in TSC Alliance samples from the Biosample Repository (n = 45); protein levels assessed by SIMOA. NfL (G) and GFAP (H) comparing individuals with active epilepsy (Epi+, n = 31) vs those without (No epi, n = 14), Mann–Whitney test. (I) GFAP levels in biosamples of pwTSC from the CHUM (circles) and TSC Alliance (squares) cohorts pooled together. NMI: Tested but no mutation identified in TSC1 or TSC2 (n = 13); TSC1: TSC1 mutation identified (n = 14); TSC2: TSC2 mutation identified (n = 34). Mann–Whitney Epi+ vs No epi for each genotype. Boxplots = 25th to 75th percentiles, line = median, whiskers = minimal to maximal value. When present dotted line represents the 25th and 75th percentiles of HCs. **p < 0.01; ***p < 0.001.
FIGURE 2
FIGURE 2
TSC status is associated with a distinct inflammatory profile in the serum compared to HCs. (A) Volcano plot of inflammation‐related proteins that are upregulated (pink/red) or downregulated (blue) in the serum of people with TSC (pwTSC, n = 46) compared to healthy controls (HCs, n = 24) as assessed by proximity extension assay. Data was log‐transformed. Outliers ±3 standard deviation (SD) from the mean were removed (n = 0–3 outliers per analyte). Two‐tailed Student's t test analysis was performed (Y axis = unadjusted p‐values, dotted line indicates p values below .05) and false discovery rate (FDR)–adjusted p‐values below .05 (red) and .10 (pink and blue). (B) Protein levels of epidermal growth factor (EGF), chemokine (C‐C motif) ligand 3 (CCL3), C‐X‐C motif chemokine ligand 8 (CXCL8), and interleukin (IL)‐1β in the serum of pwTSC compared to HC and to non‐TSC epilepsy controls. Analysis of variance (ANOVA) or Kruskal–Wallis (horizontal bracket) followed by Tukey's or Dunn's multiple comparisons test. Boxplots = 25th to 75th percentiles, line = median, whiskers = minimal to maximal value. **p < 0.01; ***p < 0.001.
FIGURE 3
FIGURE 3
Active epilepsy but not AML is associated with a Th1/Th17‐related inflammatory profile in the serum among pwTSC. (A) Heatmap depicting inflammation‐related proteins that are upregulated or downregulated in the serum of people with TSC (pwTSC) with active epilepsy (Epi+, n = 23) vs those without (No Epi, n = 23) or with kidney angiomyolipoma (AML+, n = 25) vs those without (No AML, n = 19) as assessed by proximity extension assay. Data are presented as log2 fold‐change in reference to no epilepsy or to no AML. Data were log transformed and outliers removed (n = 0–3 outliers removed per analyte). Two‐tailed Student's t test exploratory analysis. Proteins with at least one p < .05 in either group are shown. # p < .10; *p < .05; **p < .01, ***p < .001. (B, C) Levels of inflammation‐related markers (B) associated with active epilepsy in pwTSC (interleukin (IL)‐6, tumor necrosis factor (TNF)‐α, IL‐17A, and IL‐17C) compared to pwTSC without epilepsy and non‐TSC epilepsy controls. Analysis of variance (ANOVA) or Kruskal–Wallis (horizontal bracket) followed by Tukey's or Dunn's multiple comparisons test or (C) associated with AML in pwTSC (IL‐15, C‐C motif chemokine ligand 11 (CCL11), oxidized low‐density lipoprotein receptor (OLR)1, TNF superfamily member (TNFSF)10, and transforming growth factor (TGF)‐α (two‐tailed Student's t test or Mann–Whitney according to distribution after exclusion of outliers). (D) Levels of inflammation‐related markers associated with both epilepsy and AML in pwTSC (interferon (IFN)γ, colony stimulating factor (CSF)1, and C‐X‐C motif chemokine ligand 9 (CXCL9). ANOVA or Kruskal–Wallis (horizontal bracket) followed by Tukey's or Dunn's multiple comparisons test according to distribution after exclusion of outliers. Boxplots = 25th to 75th percentiles, line = median, whiskers = minimal to maximal value. Dotted lines represent 25th and 75th percentiles of HCs. *p < 0.05; **p < 0.01; ***p < 0.001.
FIGURE 4
FIGURE 4
Markers of astrogliosis and inflammation are elevated in the serum of pwTSC compared to HCs and are associated with epilepsy independently of treatment with mTOR inhibitors (mTORi). (A) Protein levels of glial fibrially acidic protein (GFAP), epidermal growth factor (EGF), interleukin (IL)‐1β, C‐C motif chemokine ligand (CCL3), and C‐X‐C motif chemokine ligand (CXCL)8 in the serum of peoplw with TSC (pwTSC) not treated with mTORi (untx, n = 37) compared to healthy controls (HCs, n = 24–25). Levels in pwTSC treated with mTORi ( n = 9) are displayed on the right. (B) Levels of GFAP in biosamples of pwTSC from the CHUM (circles) and TSC Alliance (squares) cohorts pooled together based on treatment with mTORi and active epilepsy status (untx: No Epi, n = 34; Epi+, n = 42. mTORi: No Epi, n = 3; Epi+, n = 12). (C) Protein levels of tumor necrosis factor (TNF)‐α and IL‐17C in the serum of pwTSC with active epilepsy (Epi+) or not (No Epi) and either not treated with mTORi (untx: No Epi, n = 22; Epi+, n = 15) or treated with mTORi (mTORi: No Epi, n = 1; Epi+, n = 8). Comparison between No Epi and Epi+ is calculated by either Mann–Whitney or two‐tailed Student's t test according to distribution after exclusion of outliers. Boxplots = 25th to 75th percentiles, line = median, whiskers = minimal to maximal value.
FIGURE 5
FIGURE 5
Peripheral blood levels of GFAP and inflammation‐related molecules distinguish TSC status and active epilepsy among pwTSC. (A) Receiver‐operating characteristic (ROC) curves and area under the curve (AUC) with 95% confidence interval of glial fibrillary acidic protein (GFAP), interleukin (IL)‐1β, and epidermal growth factor (EGF), alone or in combination, as markers for TSC status in the CHUM cohort. (B) ROC and AUC of GFAP blood levels as a marker for active epilepsy among pwTSC in both the CHUM and TSC Alliance cohorts. (C) ROC and AUC of IL‐17A and tumor necrosis factor (TNF)‐α, alone or in combination with GFAP, as markers to identify active epilepsy among pwTSC in the CHUM cohort. Shown are AUC values with 95% CIs.

Similar articles

References

    1. Henske EP, Jozwiak S, Kingswood JC, Sampson JR, Thiele EA. Tuberous sclerosis complex. Nat Rev Dis Primers. 2016. May 26;2:16035. - PubMed
    1. Northrup H, Aronow ME, Bebin EM, Bissler J, Darling TN, de Vries PJ, et al. Updated international tuberous sclerosis complex diagnostic criteria and surveillance and management recommendations. Pediatr Neurol. 2021. Oct;123:50–66. - PubMed
    1. Huang J, Manning BD. The TSC1‐TSC2 complex: a molecular switchboard controlling cell growth. Biochem J. 2008. Jun 1;412:179–190. - PMC - PubMed
    1. Nabbout R, Belousova E, Benedik MP, Carter T, Cottin V, Curatolo P, et al. Epilepsy in tuberous sclerosis complex: findings from the TOSCA study. Epilepsia Open. 2019. Mar;4:73–84. - PMC - PubMed
    1. Aronica E, Specchio N, Luinenburg MJ, Curatolo P. Epileptogenesis in tuberous sclerosis complex‐related developmental and epileptic encephalopathy. Brain. 2023. Jul 3;146:2694–2710. - PMC - PubMed