. 2025 Mar;12(2):e200355.
doi: 10.1212/NXI.0000000000200355. Epub 2025 Jan 16.

Alterations in Gut Microbiome-Host Relationships After Immune Perturbation in Patients With Multiple Sclerosis

Affiliations

Alterations in Gut Microbiome-Host Relationships After Immune Perturbation in Patients With Multiple Sclerosis

Vinod K Gupta et al. Neurol Neuroimmunol Neuroinflamm. 2025 Mar.

Abstract

Background and objectives: Gut microbial symbionts have been shown to influence the development of autoimmunity in multiple sclerosis (MS). Emerging research points to an important relationship between the microbial-IgA interface and MS pathophysiology. IgA-secreting B cells are observed in the MS brain, and shifts in gut bacteria-IgA binding have been described in some patients with MS. However, the relationships between the gut microbiome and the host immune response, particularly regarding B-cell-depleting immunomodulation, remain underexplored. This study aimed to evaluate the composition of the gut microbiome in patients with newly diagnosed MS at baseline and after B-cell depletion, using long-read sequencing for enhanced taxonomic resolution. We further aimed to investigate the host/microbiome interface by evaluating microbe/immunoglobulin A relationships.

Methods: We collected stool samples from 43 patients with newly diagnosed, untreated MS and 42 matched healthy controls. Nineteen patients with MS initiated anti-CD20 monoclonal antibody treatment and donated additional stool samples after 6 months of treatment. We evaluated the host-microbial interface using bacterial flow cytometry and long-read 16S rRNA gene amplicon sequencing. We used Immune Coating Scores to compare the proportions of bacteria identified in the IgA-coated vs IgA-uncoated bacterial fractions.

Results: Patients with untreated, newly diagnosed MS showed significant reductions in IgA-bound fecal microbiota compared with controls. Using multiple linear regression models adjusted for potential confounders, we observed significant (p < 0.05) changes in the abundance and prevalence of various strain-level gut bacteria amplicon sequence variants (ASVs) within both total and IgA-coated bacterial fractions. Some changes (e.g., decreased relative abundance of a Faecalibacterium prausnitzii variant in MS) were consistent with previous reports, while others (e.g., increased relative abundance and prevalence of Monoglobus pectinyliticus in MS) were novel. Immune Coating Scores identified subsets of organisms for which normal IgA-coating patterns were disrupted at the onset of MS, as well as those (particularly Akkermansia muciniphila) whose IgA-coating became more aligned with controls after therapy.

Discussion: This analysis of gut microbial ASVs reveals shifts in taxonomic strains induced by immune modulation in MS.


Conflict of interest statement

Among our authors, in the last 2 years, E.E. Longbrake has received honoraria for consulting from Bristol Myers Squibb, EMD Serono, Genentech, Novartis, and Genzyme and research support from Biogen, LabCorp, Intus, and Genentech. She is an associate editor for Annals of Neurology. D.A. Hafler has received research funding from Bristol-Myers Squibb, Novartis, Sanofi, and Genentech. He has been a consultant for Bayer Pharmaceuticals, Repertoire Inc., Bristol Myers Squibb, Compass Therapeutics, EMD Serono, Genentech, Juno therapeutics, Novartis Pharmaceuticals, Proclara Biosciences, Sage Therapeutics, and Sanofi Genzyme. The other authors report no disclosures. All other authors report no relevant disclosures. Go to Neurology.org/N for full disclosures.

Figures

Figure 1
Figure 1. Overview of Study Design
This was an observational study incorporating cross-sectional and longitudinal components. Baseline stool samples were collected from 43 patients with treatment-naïve MS and 42 matched healthy controls. Longitudinal samples were acquired 6 months after beginning B-cell–depleting therapy for n = 19 patients with MS. All samples underwent IgA-based sorting and full-length 16S rRNA gene amplicon sequencing to assess the gut microbiome and to compare the total (presort), IgA-coated (IgA+), and IgA-uncoated (IgA–) bacterial fractions before and after treatment. Figure created with Biorender. IgA = immunoglobulin A; MS = multiple sclerosis.
Figure 2
Figure 2. Gut Microbial Diversity in MS Patients at Baseline Compared With Controls
(A) Strain-level α-diversity measured by the Shannon Index is shown for total (presort) bacteria. A significant difference in Shannon Index for presort bacteria was observed between the study groups (p < 0.05 for the coefficient in a multiple linear regression model adjusted for age, sex, BMI, and steroid use). (B) Strain-level β-diversity, analyzed using Bray-Curtis distance in principal coordinate analysis (PCoA) plots, was compared between patients with MS (gold) and controls (green) for total (presort) bacteria. The percent variance in gut microbiome taxonomic community composition, as explained by PCoA1 and PCoA2, is indicated in their respective axes. R2 and p values were derived from the adjusted PERMANOVA models. BMI = body mass index; MS = multiple sclerosis; PERMANOVA = Permutational Multivariate Analysis of Variance.
Figure 3
Figure 3. Immunoglobulin Coating in Gut Microbes of Patients With Untreated MS Compared With Controls
Flow cytometry was used to determine the proportions of (A) IgA-coated and (B) IgM-coated bacteria. (C) Total secreted, unbound IgA was quantified using ELISA. Multiple linear regression models, adjusted for age, sex, BMI, and steroid use, were applied in (A–C) to assess the significance of differences between controls and patients with untreated MS. BMI = body mass index; IgA = immunoglobulin A; MS = multiple sclerosis.
Figure 4
Figure 4. Differential Abundance and Prevalence of Strain-Level ASVs Between Untreated MS and Controls
(A) The fold change of ASV relative abundance (calculated as the log ratio of arithmetic means) when comparing untreated MS with controls within the total (presort), IgA+, and IgA– bacterial fractions. Only significant changes are shown in the bubble plot (p < 0.05), as identified by the ASV relative abundance coefficient in a multiple linear regression model adjusted for age, sex, BMI, and steroid use. Significant differences are indicated by bubble size, with larger bubbles denoting higher levels of significance; red bubbles represent an increased relative abundance in the untreated MS group, whereas blue indicates a higher abundance in controls. (B) The prevalence of ASVs in each study group across presort bacteria and IgA+ and IgA– fractions. Color saturation in the heatmap indicates ASV prevalence, with darker tones reflecting higher prevalence. * and # indicate statistically significant differences (p < 0.05 and Benjamini-Hochberg–adjusted p < 0.10, respectively; Fisher exact test). ASV = amplicon sequence variant; BMI = body mass index; IgA = immunoglobulin A; MS = multiple sclerosis.
Figure 5
Figure 5. Effect of Anti-CD20 Monoclonal Antibody Treatment on Gut Microbiome in Patients With MS
(A) The proportion of IgA-coated bacteria in patients with untreated MS at baseline shows no significant change (p = 0.83, mixed-effects linear regression model adjusted for steroid use) after 6 months of treatment. (B) The fold change of strain-level ASV relative abundance from baseline to 6-month posttreatment within the presort, IgA+, and IgA– bacterial fractions. Only significant changes are shown in the bubble plot (p < 0.05), as identified by the ASV relative abundance coefficient in a mixed-effects linear regression model adjusted for steroid use. Significant changes in ASVs are indicated by bubble size, with red signifying an increase and blue a decrease posttreatment. # indicates Benjamini-Hochberg–adjusted p < 0.10. (C) Differentially prevalent strain-level ASVs between baseline and 6-month posttreatment, with asterisks (*) indicating statistical significance (p < 0.05; Fisher exact test). Color saturation reflects the prevalence of ASVs, with darker shades indicating higher prevalence. All statistical comparisons between patients with MS at baseline and 6-month posttreatment were performed on paired samples. ASV = amplicon sequence variant; MS = multiple sclerosis.
Figure 6
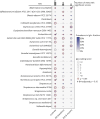
Figure 6. IgA-Coating Patterns of Gut Microbial Strains Across Study Groups
The IgA-Coating Scores (ICSs) for strain-level ASVs are shown in the bubble plot for controls, patients with untreated MS at baseline, and patients with MS 6-month posttreatment. The size of the bubbles reflects the ICS, with larger bubbles indicating a higher degree of IgA binding to ASVs. The color saturation of the bubbles corresponds to the prevalence of each ASV within IgA + samples, with darker shades indicating higher prevalence. ASVs with a statistically significant ICS (p < 0.05, permutation test) are outlined in dark red. # indicates Benjamini-Hochberg–adjusted p < 0.10. ASV = amplicon sequence variant; MS = multiple sclerosis.

References

    1. Planas R, Santos R, Tomas-Ojer P, et al. . GDP-l-fucose synthase is a CD4(+) T cell-specific autoantigen in DRB3*02:02 patients with multiple sclerosis. Sci Transl Med. 2018;10(462):eaat4301. doi:10.1126/scitranslmed.aat4301 - DOI - PubMed
    1. Ma Y, Sannino D, Linden JR, et al. . Epsilon toxin–producing clostridium perfringens colonize the multiple sclerosis gut microbiome overcoming CNS immune privilege. J Clin Invest. 2023;133(9):e163239. doi:10.1172/JCI163239 - DOI - PMC - PubMed
    1. Berer K, Gerdes LA, Cekanaviciute E, et al. . Gut microbiota from multiple sclerosis patients enables spontaneous autoimmune encephalomyelitis in mice. Proc Natl Acad Sci U S A. 2017;114(40):10719-10724. doi:10.1073/pnas.1711233114 - DOI - PMC - PubMed
    1. Gut microbiome of multiple sclerosis patients and paired household healthy controls reveal associations with disease risk and course. Cell. 2022;185;(19):3467-3486.e16. doi:10.1016/j.cell.2022.08.021 - DOI - PMC - PubMed
    1. Cantarel BL, Waubant E, Chehoud C, et al. . Gut microbiota in multiple sclerosis: possible influence of immunomodulators. J Investig Med. 2015;63(5):729-734. doi:10.1097/JIM.0000000000000192 - DOI - PMC - PubMed

Substances

LinkOut - more resources