Basic research for ultrasound-guided injection into skeletal muscle lesions in an experimental animal model
- PMID: 39819782
- PMCID: PMC11739951
- DOI: 10.1302/2046-3758.141.BJR-2024-0090.R1
Basic research for ultrasound-guided injection into skeletal muscle lesions in an experimental animal model
Abstract
Aims: Ultrasound-guided injection techniques are expected to enhance therapeutic efficacy for skeletal muscle injuries and disorders, but basic knowledge is lacking. The purpose of this study was to examine the diagnostic accuracy of ultrasound for abnormal skeletal muscle lesions, and to examine the distribution patterns of solution and cells injected into abnormal muscle lesions under ultrasound guidance.
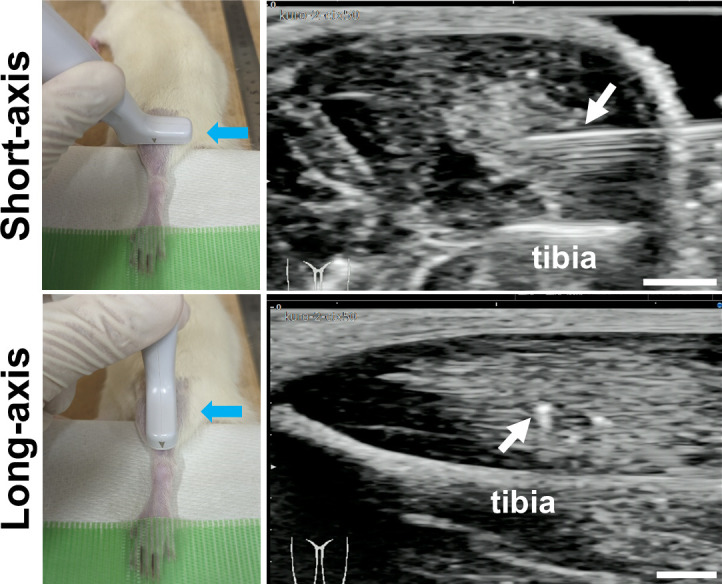
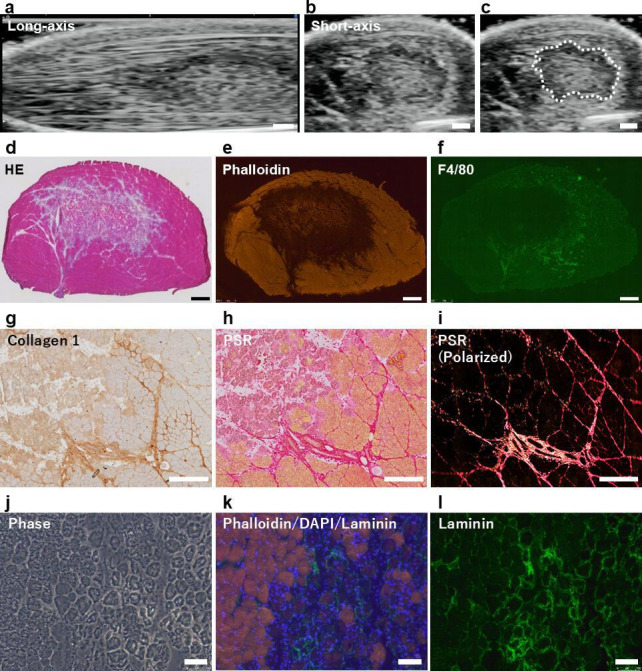
Methods: A cardiotoxin (CTX)-induced muscle injury model was used. Briefly, CTX was injected into tibialis anterior muscle in rats under ultrasound observation. First, the diagnostic accuracy of abnormal muscle lesions on ultrasound was examined by comparing ultrasound findings and histology. Next, Fast Green solution and green fluorescent protein (GFP)-labelled cells were simultaneously injected into the abnormal muscle lesions under ultrasound guidance, and their distribution was evaluated.
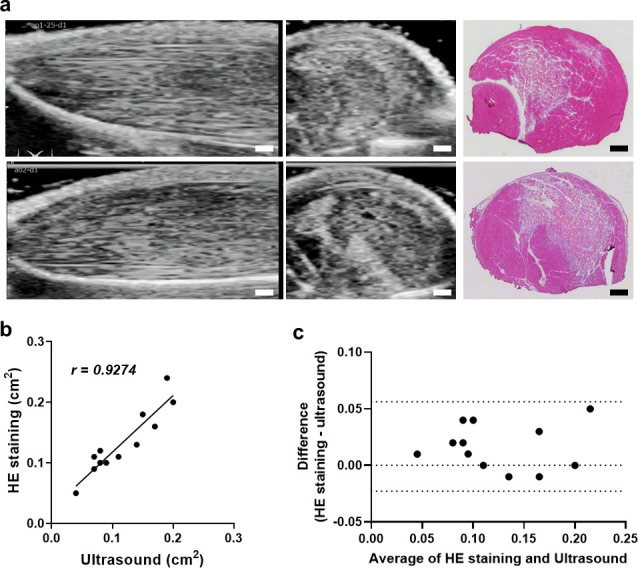
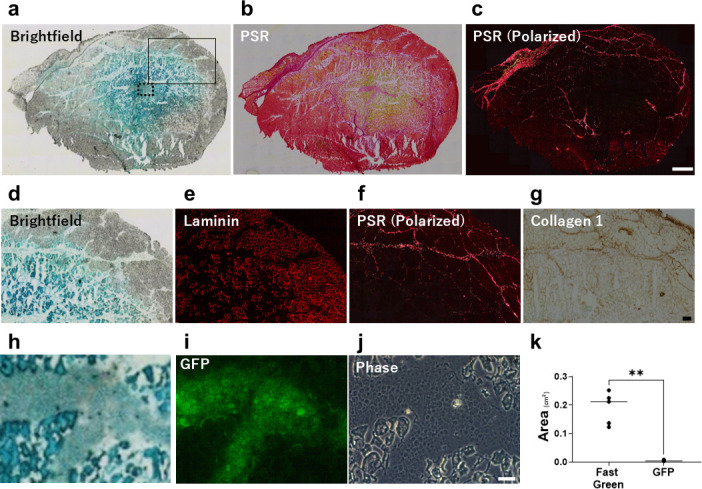
Results: Evaluation of short-axis ultrasound images and cross-sectional histological staining showed a strong correlation (r = 0.927; p < 0.001) between the maximum muscle damage area in ultrasound and haematoxylin and eosin (H&E) staining evaluations. Histological analysis showed that ultrasound-guided injection could successfully deliver Fast Green solution around the myofibres at the site of injury. In contrast, the distribution of injected cells was very localized compared to the area stained with Fast Green.
Conclusion: This experimental animal study demonstrated the potential of ultrasound to quantitatively visualize abnormalities of skeletal muscle. It also showed that ultrasound-guided injections allowed for highly accurate distribution of solution and cells in abnormal muscle tissue, but the patterns of solution and cell distribution were markedly different. Although future studies using a more clinically relevant model are necessary, these results are important findings when considering biological therapies for skeletal muscle injuries and disorders.
© 2025 Fujimoto et al.
Conflict of interest statement
T. Kanamoto and K. Nakata report funding from the Grants-in-Aid for Scientific Research of the Japan Society for the Promotion of Science, Grant Number # JP 20K11360 and # JP 22K19751, respectively, related to this study.
Figures
Similar articles
-
Muscle Precursor Cells Enhance Functional Muscle Recovery and Show Synergistic Effects With Postinjury Treadmill Exercise in a Muscle Injury Model in Rats.Am J Sports Med. 2021 Mar;49(4):1073-1085. doi: 10.1177/0363546521989235. Am J Sports Med. 2021. PMID: 33719605
-
[Study on the parameter optimization for therapeutic ultrasound mediated microbubble destruction enhancs gene transfection in rat muscle in vivo].Sichuan Da Xue Xue Bao Yi Xue Ban. 2012 Nov;43(6):930-5. Sichuan Da Xue Xue Bao Yi Xue Ban. 2012. PMID: 23387231 Chinese.
-
Postinjury Exercise and Platelet-Rich Plasma Therapies Improve Skeletal Muscle Healing in Rats But Are Not Synergistic When Combined.Am J Sports Med. 2017 Jul;45(9):2131-2141. doi: 10.1177/0363546517702864. Epub 2017 Apr 28. Am J Sports Med. 2017. PMID: 28453295
-
Heat stress facilitates the regeneration of injured skeletal muscle in rats.J Orthop Sci. 2007 Jan;12(1):74-82. doi: 10.1007/s00776-006-1083-0. Epub 2007 Jan 31. J Orthop Sci. 2007. PMID: 17260121
-
Ergonomic Recommendations in Ultrasound-Guided Botulinum Neurotoxin Chemodenervation for Spasticity: An International Expert Group Opinion.Toxins (Basel). 2021 Mar 31;13(4):249. doi: 10.3390/toxins13040249. Toxins (Basel). 2021. PMID: 33807196 Free PMC article. Review.
References
-
- Ossola C, Curti M, Calvi M, et al. Role of ultrasound and magnetic resonance imaging in the prognosis and classification of muscle injuries in professional football players: correlation between imaging and return to sport time. Radiol Med. 2021;126(11):1460–1467. doi: 10.1007/s11547-021-01396-y. - DOI - PMC - PubMed
-
- Barbosa FDS, Nascimento BSS, Silva MCFS, Cerqueira TCF, de Santana Filho VJ. Impact of muscle changes assessed by ultrasonography on muscle strength and functioning after ICU discharge: a systematic review with meta-analysis. Int J Environ Res Public Health. 2024;21(7):908. doi: 10.3390/ijerph21070908. - DOI - PMC - PubMed
LinkOut - more resources
Full Text Sources