. 2026 Apr 1;21(4):1652-1664.
doi: 10.4103/NRR.NRR-D-24-00674. Epub 2025 Jan 13.

Voltage-dependent anion channel 1 oligomerization regulates PANoptosis in retinal ischemia-reperfusion injury

Affiliations

Voltage-dependent anion channel 1 oligomerization regulates PANoptosis in retinal ischemia-reperfusion injury

Hao Wan et al. Neural Regen Res. .

Abstract

JOURNAL/nrgr/04.03/01300535-202604000-00045/figure1/v/2025-06-30T060627Z/r/image-tiff Ischemia-reperfusion injury is a common pathophysiological mechanism in retinal degeneration. PANoptosis is a newly defined integral form of regulated cell death that combines the key features of pyroptosis, apoptosis, and necroptosis. Oligomerization of mitochondrial voltage-dependent anion channel 1 is an important pathological event in regulating cell death in retinal ischemia-reperfusion injury. However, its role in PANoptosis remains largely unknown. In this study, we demonstrated that voltage-dependent anion channel 1 oligomerization-mediated mitochondrial dysfunction was associated with PANoptosis in retinal ischemia-reperfusion injury. Inhibition of voltage-dependent anion channel 1 oligomerization suppressed mitochondrial dysfunction and PANoptosis in retinal cells subjected to ischemia-reperfusion injury. Mechanistically, mitochondria-derived reactive oxygen species played a central role in the voltage-dependent anion channel 1-mediated regulation of PANoptosis by promoting PANoptosome assembly. Moreover, inhibiting voltage-dependent anion channel 1 oligomerization protected against PANoptosis in the retinas of rats subjected to ischemia-reperfusion injury. Overall, our findings reveal the critical role of voltage-dependent anion channel 1 oligomerization in regulating PANoptosis in retinal ischemia-reperfusion injury, highlighting voltage-dependent anion channel 1 as a promising therapeutic target.

Keywords: 1-methyl-4-phenyl-1,2,3,6-tetrahydropyridine; PANoptosis; apoptosis; ischemia–reperfusion injury; mitochondrial dysfunction; necroptosis; oxidative stress; pyroptosis; reactive oxygen species; voltage-dependent anion channel 1.


Conflict of interest statement

Conflicts of interest: The authors declare that there is no potential conflict of interest.

Figures

Figure 1
Figure 1
RCD-related genes related to I/R injury identified from microarray mRNA expression profile data (GSE253799). (A) Heatmap of DEGs related to RCD between the sham and MCAO groups. (B) Volcano plot of DEGs related to RCD between the sham and MCAO groups. (C) Gene Ontology (GO) analysis based on RCD-related DEGs between the sham and MCAO groups. (D) KEGG enrichment analysis based on RCD-related DEGs between the sham and MCAO groups. (E) GSVA of the PANoptosis pathway in the sham and MCAO groups. Data are expressed as mean ± SD. *P < 0.05 (two-tailed unpaired Student’s t-test). BP: Biological processes; CC: cellular components; DEG: differentially expressed gene; GSVA: gene set variation analysis; I/R: ischemia–reperfusion; KEGG: Kyoto Encyclopedia of Genes and Genomes; MCAO: middle cerebral artery occlusion; MF: molecular functions; RCD: regulated cell death.
Figure 2
Figure 2
VDAC1 oligomerization in R28 retinal cells subjected to OGD/R. (A) Timeline of OGD/R treatment of R28 retinal cells. (B) Morphological changes seen in R28 retinal cells after OGD/R. OGD/R caused cellular damage, with the most pronounced damage observed in the OGD/R 2h and OGD/R 4h groups. Scale bar: 50 μm. (C) CCK-8 assay after OGD/R treatment. (D, E) VDAC1 protein bands (D) and expression (E) in R28 retinal cells subjected to OGD/R. (F) VDAC1 oligomerization in R28 retinal cells subjected to OGD/R. (G, H) Statistical analysis of VDAC1 oligomerization. Data are expressed as mean ± SD. All cell experiments included at least three independent replicates. *P < 0.05, **P < 0.01, ***P < 0.001, ****P < 0.0001 (one-way analysis of variance followed by Tukey’s post hoc test). CCK-8: Cell counting kit-8; CTL: control; Mono: monomer; OGD/R: oxygen-glucose deprivation/reperfusion; VDAC1: voltage-dependent anion channel 1.
Figure 3
Figure 3
PANoptosis and mitochondrial dysfunction in R28 retinal cells after OGD/R. (A) PI staining of R28 retinal cells subjected to OGD/R. A large number of PI-positive cells were observed in the OGD/R group. Scale bars: 40 μm. (B) Statistical analysis of PI-positive cells. (C) TUNEL staining of R28 retinal cells after OGD/R. There were very few TUNEL-positive cells in the CTL group, while a large number of TUNEL-positive cells were observed in the OGD/R group. Scale bars: 40 μm. (D) Statistical analysis of TUNEL-positive cells. (E) LDH release assay of R28 retinal cells subjected to OGD/R. (F) DCFH-DA probe detection of changes in intracellular ROS concentrations. There were very few cells exhibiting DCFH-DA fluorescence in the CTL group, whereas a large number of cells exhibiting DCFH-DA fluorescence were detected in the OGD/R group. Scale bars: 40 μm. (G) Statistical analysis of DCFH-DA fluorescence intensity. (H) Mito-tracker labeling showing mitochondrial morphology changes in R28 retinal cells subjected to OGD/R. The mitochondria in the CTL group mostly appeared as short rods, whereas in the OGD/R group, there were numerous mitochondrial fragments. Scale bars: 10 μm. (I) Mitochondrial membrane potential was detected by flow cytometry after JC-1 staining. (J) JC-1 assay of mitochondrial membrane potential after OGD/R treatment. Consistent with the flow cytometry results, we observed an increase in the number of green fluorescent cells in the OGD/R group compared to the CTL group. Scale bars: 80 μm. (K) Statistical analysis of JC-1 fluorescence intensity. Data are expressed as mean ± SD. All cell experiments included at least three independent replicates. *P < 0.05, **P < 0.01, ***P < 0.001 (two-tailed unpaired Student’s t-test). CTL: Control; DAPI: 4′,6-diamidino-2-phenylindole; DCFH-DA: 2ʹ,7ʹ-dichlorofluorescin diacetate; LDH: lactate dehydrogenase; OGD/R: oxygen-glucose deprivation/reperfusion; PI: propidium iodide; TUNEL: terminal deoxynucleotidyl transferase-mediated dUTP nick-end labeling.
Figure 4
Figure 4
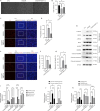
Effects of VBIT-12 on PANoptosis in R28 retinal cells subjected to OGD/R. (A) Morphological changes seen in R28 retinal cells subjected to OGD/R after VBIT-12 treatment. Cellular damage occurred after OGD/R, but VBIT-12 pretreatment inhibited this damage to a certain extent. Scale bar: 50 μm. (B) CCK-8 assay after VBIT-12 treatment. (C) PI staining of R28 retinal cells subjected to OGD/R after VBIT-12 treatment. There were very few PI-positive cells in the CTL group and a large number of PI-positive cells in the OGD/R group, while the number of PI-positive cells was reduced in the OGD/R + VBIT-12 group compared to the OGD/R group. Scale bars: 40 μm. (D) Statistical analysis of PI-positive cells. (E) TUNEL staining of R28 retinal cells subjected to OGD/R after VBIT-12 treatment. There were very few TUNEL-positive cells in the CTL group and a large number of TUNEL-positive cells in the OGD/R group, while the number of TUNEL-positive cells was reduced in the OGD/R + VBIT-12 group compared to the OGD/R group. Scale bars: 40 μm. (F) Statistical analysis of TUNEL-positive cells. (G) LDH release assay of R28 retinal cells subjected to OGD/R after VBIT-12 treatment. (H) Expression levels of PANoptosis-related proteins in R28 retinal cells subjected to OGD/R after VBIT-12 treatment. Cleaved-caspase 3 is the 17 kDa band detected by the anti-caspase-3 antibody. (I–K) Statistical analysis of the data shown in H. Data are expressed as mean ± SD. All cell experiments included at least three independent replicates. *P < 0.05, **P < 0.01, ***P < 0.001, ****P < 0.0001 (one-way analysis of variance followed by Tukey’s post hoc test). ASC: Apoptosis-associated speck-like protein containing a CARD; CTL: control; DAPI: 4′,6-diamidino-2-phenylindole; FADD: FAS-associated death domain protein; GSDMD: gasdermin-D; MLKL: mixed lineage kinase domain-like protein; NLRP3: NACHT, LRR and PYD domains-containing protein 3; OGD/R: oxygen-glucose deprivation/reperfusion; PI: propidium iodide; p-MLKL: phosphorylated mixed lineage kinase domain-like protein; p-RIPK3: phosphorylated receptor-interacting serine/threonine-protein kinase 3; RIPK3: receptor-interacting serine/threonine-protein kinase 3; TUNEL: terminal deoxynucleotidyl transferase-mediated dUTP nick-end labeling; VBIT-12: a selective inhibitor of voltage-dependent anion channel 1 oligomerization.
Figure 5
Figure 5
Effects of VBIT-12 on VDAC1 oligomerization and mitochondrial dysfunction in R28 retinal cells subjected to OGD/R. (A) VDAC1 oligomerization in R28 retinal cells subjected to OGD/R after VBIT-12 treatment. (B, C) Statistical analysis of VDAC1 oligomerization. (D) DCFH-DA probe detection of changes in intracellular ROS concentrations. There were very few cells exhibiting DCFH-DA fluorescence in the CTL group, whereas a large number of cells exhibiting DCFH-DA fluorescence were detected in the OGD/R group. In contrast, the number of cells exhibiting DCFH-DA fluorescence was reduced in the OGD/R + VBIT-12 group compared with the OGD/R group. Scale bar: 40 μm. (E) Statistical analysis of DCFH-DA fluorescence intensity. (F) Mito-tracker labeling showing mitochondrial morphology changes in R28 retinal cells subjected to OGD/R after VBIT-12 treatment. The mitochondria in the CTL group mostly appeared as short rods, whereas there were numerous mitochondrial fragments observed in the OGD/R group. In the OGD/R + VBIT-12 group, the number of these mitochondrial fragments was markedly reduced. Scale bars: 10 μm. (G) Mitochondrial membrane potential was detected by flow cytometry after JC-1 staining. (H) JC-1 assay of mitochondrial membrane potential. Consistent with the flow cytometry results, an increase in the number of green fluorescent cells in the OGD/R group was observed compared with the CTL group. However, VBIT-12 pretreatment markedly inhibited this effect. Scale bars: 80 μm. (I) Statistical analysis of JC-1 fluorescence intensity. Data are expressed as mean ± SD. All cell experiments included at least three independent replicates. *P < 0.05, **P < 0.01, ***P < 0.001, ****P < 0.0001 (one-way analysis of variance followed by Tukey’s post hoc test). CTL: Control; DCFH-DA: 2ʹ,7ʹ-dichlorofluorescin diacetate; Mono: monomer; OGD/R: oxygen-glucose deprivation/reperfusion; ROS: reactive oxygen species; VBIT-12: a selective inhibitor of VDAC1 oligomerization; VDAC1: voltage-dependent anion channel 1.
Figure 6
Figure 6
Effects of scavenging mitochondria-derived ROS on mitochondrial dysfunction in R28 retinal cells subjected to OGD/R. (A) DCFH-DA probe detection of changes of intracellular ROS concentrations in R28 retinal cells subjected to OGD/R after mito-TEMPO treatment. There were very few cells exhibiting DCFH-DA fluorescence in the CTL group, whereas a large number of cells exhibiting DCFH-DA fluorescence were detected in the OGD/R group. In contrast, the number of cells exhibiting DCFH-DA fluorescence was reduced in the OGD/R + mito-TEMPO group compared with the OGD/R group. Scale bar: 40 μm. (B) Statistical analysis of DCFH-DA fluorescence intensity. (C) Mito-tracker labeling showing mitochondrial morphology changes in R28 retinal cells subjected to OGD/R after mito-TEMPO treatment. In the CTL group, the mitochondria predominantly appeared as short rods, whereas in the OGD/R group, there were numerous mitochondrial fragments. In the OGD/R + mito-TEMPO group, the number of these mitochondrial fragments was markedly reduced. Scale bars: 10 μm. (D) Mitochondrial membrane potential was detected by flow cytometry after JC-1 staining. (E) JC-1 assay of mitochondrial membrane potential. Consistent with the flow cytometry results, we observed an increase in the number of green fluorescent cells in the OGD/R group compared with the CTL group. However, mito-TEMPO pretreatment markedly inhibited this increase. Scale bars: 80 μm. (F) Statistical analysis of JC-1 fluorescence intensity. Data are expressed as mean ± SD. All cell experiments included at least three independent replicates. *P < 0.05, **P < 0.01, ***P < 0.001, ****P < 0.0001 (one-way analysis of variance followed by Tukey’s post hoc test). CTL: Control; DCFH-DA: 2ʹ,7ʹ-dichlorofluorescin diacetate; mito-TEMPO: a mitochondria-targeted antioxidant; Mono: monomer; OGD/R: oxygen-glucose deprivation/reperfusion; ROS: reactive oxygen species.
Figure 7
Figure 7
Effects of scavenging mitochondria-derived ROS on PANoptosis in R28 retinal cells subjected to OGD/R. (A) Morphological changes in R28 retinal cells subjected to OGD/R after mito-TEMPO treatment. OGD/R induced cellular damage, but in the mito-TEMPO pretreatment group this damage was inhibited to a certain extent. Scale bars: 50 μm. (B) CCK-8 assay after mito-TEMPO treatment. (C) PI staining of R28 retinal cells subjected to OGD/R after mito-TEMPO treatment. There were very few PI-positive cells in the CTL group and a large number of PI-positive cells in the OGD/R group, while the number of PI-positive cells was reduced in the OGD/R + mito-TEMPO group compared with the OGD/R group. Scale bars: 40 μm. (D) Statistical analysis of PI-positive cells. (E) TUNEL staining of R28 retinal cells subjected to OGD/R after mito-TEMPO treatment. There were very few TUNEL-positive cells in the CTL group and a large number of TUNEL-positive cells in the OGD/R group, while the number of TUNEL-positive cells was reduced in the OGD/R + mito-TEMPO group compared with the OGD/R group. Scale bars: 40 μm. (F) Statistical analysis of TUNEL-positive cells. (G) LDH release assay after mito-TEMPO treatment. (H) Expression levels of PANoptosis-related proteins in R28 retinal cells subjected to OGD/R after mito-TEMPO treatment. Cleaved-caspase 3 is the 17 kDa band detected by the anti-caspase-3 antibody. (I–K) Statistical analysis of the western blot results. (L) Co-IP assay of the interactions among PANoptosome proteins in R28 retinal cells subjected to OGD/R after VBIT-12 and mito-TEMPO treatment. Data are expressed as mean ± SD. All cell experiments included at least three independent replicates. *P < 0.05, **P < 0.01, ***P < 0.001, ****P < 0.0001 (one-way analysis of variance followed by Tukey’s post hoc test). ASC: Apoptosis-associated speck-like protein containing a CARD; CTL: control; DAPI: 4′,6-diamidino-2-phenylindole; FADD: FAS-associated death domain protein; GSDMD: gasdermin-D; mito-TEMPO: a mitochondria-targeted antioxidant; MLKL: mixed lineage kinase domain-like protein; NLRP3: NACHT, LRR and PYD domains-containing protein 3; OGD/R: oxygen-glucose deprivation/reperfusion; PI: propidium iodide; p-MLKL: phosphorylated mixed lineage kinase domain-like protein; p-RIPK3: phosphorylated receptor-interacting serine/threonine-protein kinase 3; RIPK3: receptor-interacting serine/threonine-protein kinase 3; TUNEL: terminal deoxynucleotidyl transferase-mediated dUTP nick-end labeling.
Figure 8
Figure 8
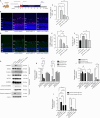
Effects of VBIT-12 on PANoptosis in the retinas of aHIOP rats. (A) Timeline of aHIOP model establishment. (B) PI staining of the retinas of aHIOP rats after VBIT-12 and mito-TEMPO treatment. No PI-positive cells were observed in the Sham group. After aHIOP, there was a marked increase in the number of PI-positive cells. However, in the VBIT-12 and mito-TEMPO pretreatment groups, the number of PI-positive cells was markedly reduced compared with the aHIOP model group. Scale bar: 20 μm. (C) Statistical analysis of PI-positive cells. (D) TUNEL staining of the retinas of aHIOP rat after VBIT-12 and mito-TEMPO treatment. No TUNEL-positive cells were observed in the Sham group. After aHIOP, there was a marked increase in the number of TUNEL-positive cells. However, in the VBIT-12 and mito-TEMPO pretreatment groups, the number of TUNEL-positive cells was markedly reduced compared with the aHIOP group. Scale bar: 20 μm. (E) Statistical analysis of TUNEL-positive cells. (F) LDH release assay of the retinas of aHIOP rats. (G) Expression levels of PANoptosis-related proteins in the retinas of aHIOP rats after VBIT-12 and mito-TEMPO treatment. Cleaved-caspase-3 is the 17 kDa band detected by the anti-caspase-3 antibody. (H–J) Statistical analysis of the data shown in G. Data are expressed as mean ± SD (n = 3). All animal experiments included at least three independent replicates. *P < 0.05, **P < 0.01, ***P < 0.001, ****P < 0.0001 (one-way analysis of variance followed by Tukey’s post hoc test). aHIOP: Acute high intraocular pressure; ASC: apoptosis-associated speck-like protein containing a CARD; FADD: FAS-associated death domain protein; GCL: ganglion cell layer; GSDMD: gasdermin-D; INL: inner nuclear layer; IPL: inner plexiform layer; MLKL: mixed lineage kinase domain-like protein; NLRP3: NACHT, LRR and PYD domains-containing protein 3; ONL: outer nuclear layer; OPL: outer plexiform layer; PI: propidium iodide; p-MLKL: phosphorylated mixed lineage kinase domain-like protein; p-RIPK3: phosphorylated receptor-interacting serine/threonine-protein kinase 3; RIPK3: receptor-interacting serine/threonine-protein kinase 3; TUNEL: terminal deoxynucleotidyl transferase-mediated dUTP nick-end labeling; VBIT-12: a selective inhibitor of voltage-dependent anion channel 1 oligomerization.

References

    1. An X, Yu W, Liu J, Tang D, Yang L, Chen X. Oxidative cell death in cancer: mechanisms and therapeutic opportunities. Cell Death Dis. 2024;15:556. - PMC - PubMed
    1. Bayrhuber M, Meins T, Habeck M, Becker S, Giller K, Villinger S, Vonrhein C, Griesinger C, Zweckstetter M, Zeth K. Structure of the human voltage-dependent anion channel. Proc Natl Acad Sci U S A. 2008;105:15370–15375. - PMC - PubMed
    1. Bock FJ, Tait SWG. Mitochondria as multifaceted regulators of cell death. Nat Rev Mol Cell Biol. 2020;21:85–100. - PubMed
    1. Chen H, Lu M, Lyu Q, Shi L, Zhou C, Li M, Feng S, Liang X, Zhou X, Ren L. Mitochondrial dynamics dysfunction: Unraveling the hidden link to depression. Biomed Pharmacother. 2024;175:116656. - PubMed
    1. Chen Y, Long T, Chen J, Wei H, Meng J, Kang M, Wang J, Zhang X, Xu Q, Zhang C, Xiong K. WTAP participates in neuronal damage by protein translation of NLRP3 in an m6A-YTHDF1-dependent manner after traumatic brain injury. Int J Surg. 2024;110:5396–5408. - PMC - PubMed

LinkOut - more resources