. 2025 Jan 16;16(1):739.
doi: 10.1038/s41467-025-56124-1.

The Human Microglia Atlas (HuMicA) unravels changes in disease-associated microglia subsets across neurodegenerative conditions

Affiliations

The Human Microglia Atlas (HuMicA) unravels changes in disease-associated microglia subsets across neurodegenerative conditions

Ricardo Martins-Ferreira et al. Nat Commun. .

Abstract

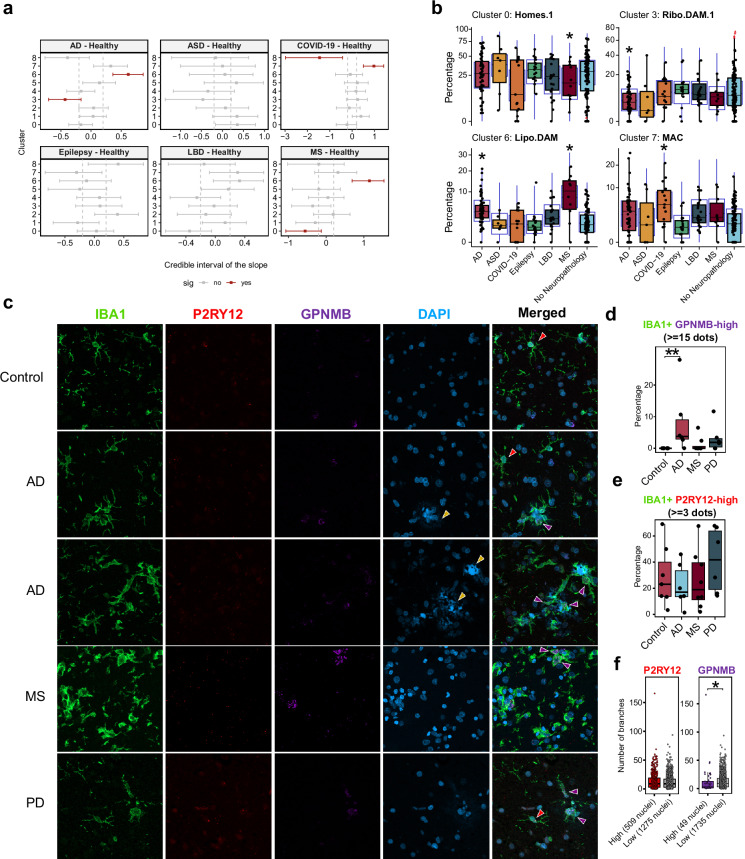
Dysregulated microglia activation, leading to neuroinflammation, is crucial in neurodegenerative disease development and progression. We constructed an atlas of human brain immune cells by integrating nineteen single-nucleus RNA-seq and single-cell RNA-seq datasets from multiple neurodegenerative conditions, comprising 241 samples from patients with Alzheimer's disease, autism spectrum disorder, epilepsy, multiple sclerosis, Lewy body diseases, COVID-19, and healthy controls. The integrated Human Microglia Atlas (HuMicA) included 90,716 nuclei/cells and revealed nine populations distributed across all conditions. We identified four subtypes of disease-associated microglia and disease-inflammatory macrophages, recently described in mice, and shown here to be prevalent in human tissue. The high versatility of microglia is evident through changes in subset distribution across various pathologies, suggesting their contribution in shaping pathological phenotypes. A GPNMB-high subpopulation was expanded in AD and MS. In situ hybridization corroborated this increase in AD, opening the question on the relevance of this population in other pathologies.


Conflict of interest statement

Competing interests: The authors declare no competing interests.

Figures

Fig. 1
Fig. 1. The Human Microglia Atlas (HuMicA).
a Schematic overview of the pipeline used to obtain the integrated HuMicA object. b UMAP visualization of the integrated and clustered HuMicA object, annotated by the nine obtained clusters. c Barplot representation of the number of nuclei/cells and the mean genes detected per nucleus/cell (between parentheses) in each cluster. d Dot plot representation of the expression of canonical markers of microglia (P2RY12, CX3CR1) and macrophages (MRC1, CD163) across all clusters. e UMAPs showing the module score (MSc) expression of macrophage (MRC1, CD163) markers. The gene expression values correspond to the normalized “RNA” assay of the integrated Seurat object. f Heatmap representation of the average expression values by cluster of the significant markers of all HuMicA clusters. Gene expression is represented as the z-score of the averaged normalized “RNA” counts. The number of significant markers for each cluster is represented, as well as the most significant and biologically relevant genes from each list. The dot plot represents a gene set enrichment analysis, performed using fgsea with one-tailed test, depicting the significance of the overlap between the lists of genes from the literature and the expression patterns in each HuMicA cluster. Significance is represented by the negative of the log of the adjusted p value (Benjamini-Hochberg) and the normalized enrichment score. The dots highlighted in bold are considered statistically significant (FDR < 0.05). Source data are provided as a Source Data file.
Fig. 2
Fig. 2. Homeostatic microglia clusters.
a Cluster dendrogram calculated considering the average expression values of all cells/nuclei for each cluster and the unique gene markers for all clusters (distance: “spearman”; clustering: “ward.D”). The box highlights the three grouped clusters that show homeostatic microglia profiles. b UMAP representation of the three clusters annotated as homeostatic microglia. Cluster 0, Homeos1; Cluster 4, Homeos2; Cluster 8, Homeos3. c Dot plot representation of the expression of the top 10 most significant upregulated markers (ordered by avg_log2FC) for the three homeostatic cluster, within the full HuMicA object. The red dashed boxes highlight the top 10 markers for each cluster. The gene expression values correspond to the normalized “RNA” assay of the Seurat object. d Net plot representation of the three most significant gene ontology (GO) terms enriched for the respective markers of the three homeostatic clusters. GO was calculated using enrichGO package followed by the simplify function. The significance of the enrichment is represented in function of the negative of the log of the adjusted p-value (Benjamini-Horchberg). The range of expression of each gene associated with the GO terms is represented by the avg_log2FC. e Representation of the enrichment of the statistically significant (FDR < 0.05) transcription factors (TFs) relative to the comparison of differential expression of each HuMicA homeostatic clusters vs all other. Significance is represented by the normalized enrichment score and the negative of log of the adjusted p value (Benjamini-Horchberg). All presented TFs showed statistically significant enrichment, and the red dashed boxes highlight the TFs with an FDR < 0.05 for each of the homeostatic clusters. Source data are provided as a Source Data file.
Fig. 3
Fig. 3. DAM-related microglia clusters.
a Dot plot representation of the expression of the module scores (MSc) of the original upregulated DAM signature from Keren-Shaul et al. and the refined human signatures for DAM, youth-associated microglia (YAM) and disease-inflammatory macrophages (DIMs) from Silvin et al., as well as the expression of top 10 most significant upregulated markers (ordered by avg_log2FC) for the five clusters considered within the “DAM-verse”. Cluster 1: Inflam.DAM, Cluster 2: DIMs, Cluster 3: Ribo.DAM1, Cluster 5: Ribo.DAM2 and Cluster 6: Lipo.DAM. The red dashed boxes highlight the expression of the MSc of the DAM, YAM and DIM signatures and the top 10 markers for each cluster. The expression values correspond to the normalized “RNA” assay of the Seurat object. b UMAP representation of the five DAM-related and DIM clusters and border-associated macrophages, MAC. c Barplot representing of selected gene set enrichment analysis (GSEA) terms from the REACTOME, WIKIPATHWAYS and KEGG repositories for the markers of the DAM-related and DIM clusters. Enrichment is represented as a function of the negative of the log of the adjusted p-value and the normalized enrichment score. d Representation of the enrichment of the statistically significant (adjusted p-value (Benjamini-Horchberg) < 0.05) transcription factors (TFs) relative to the comparison of differential expression of each HuMicA DAM and DIM clusters vs all other. Significance is represented by the normalized enrichment score and the negative of the log of the adjusted p-value (FDR). All presented TFs showed statistically significant enrichment, and the red dashed boxes highlight the TFs with an FDR < 0.05 for each of the DAM and DIM clusters. Source data are provided as a Source Data file.
Fig. 4
Fig. 4. Differential distribution of microglia populations.
a Differential cluster composition in each group in relation to “No Neuropathology” individuals using sccomp represented by the mean of the posterior distribution for the composition parameter, and the 2.5 and 97.5% quantiles. (FDR < 0.05 is highlighted in red). b Proportion of the clusters showing altered distribution (Cluster 0: Homeos1; Cluster 3: Ribo.DAM1; Cluster 6: Lipo.DAM; Cluster 7: MAC), individualized by sample, per group. The blue boxes represent the posterior predictive check and the red triangles outliers (*FDR < 0.05). In panels (a, b) the groups include 60 Alzheimer’s Disease (AD), 7 autism spectrum disorder (ASD), 15 COVID-19, 17 epilepsy, 23 Lewy Body Diseases (LBD), 10 multiple sclerosis (MS) and 109 control samples. c Maximum projection of an immunostaining of the pan-macrophage marker IBA1 in green combined with RNAscope in situ hybridization for P2RY12 (red) and GPNMB (magenta), counterstained with DAPI. Images correspond to human postmortem temporal cortex tissue sections from controls (n = 7), AD (n = 6), MS (n = 8) and Parkinson’s disease (PD) (n = 6). The yellow arrows indicate the blue autofluorescence of amyloid senile plaques in AD samples. The red and magenta arrows indicate P2RY12-high and GPNMB-high cells, respectively. Scale 15 µm. d Fraction of IBA1 + GPNMB-high cells, considered for a number of GPNMB dots equal or superior to 15. Each dot represents a donor sample. e Fraction of IBA1 + P2RY12-high cells, considered for a number of P2RY12 dots equal or superior to 3. Each dot represents a donor sample. The significance in panels (d, e) was calculated using the non-parametric Kruskal-Wallis test followed by the Dunn’s test [*adjusted p (Bonferroni) < 0.05]. f Comparison of the mean number of branches between P2RY12-high (n = 509) and P2RY12-low IBA1+ cells (n = 1275) and between GPNMB-high (n = 49) and GPNMB-low IBA1+ cells (n = 1735). Each dot represents a cell. The significance was calculated using the non-parametric Mann-Whitney test (*p < 0.05). For box plots, the hinges correspond to the first and third quartiles, the whiskers denote minimum and maximum values (excluding outliers) and the horizontal line to the median. All tests used were two-sided. Source data are provided as a Source Data file.
Fig. 5
Fig. 5. Pseudobulk differentially expressed genes (DEGs).
a Barplot representation of the number of pseudobulk DEGs calculated for each pathology in comparison to the control population. Upregulated DEGs were calculated using the complete HuMicA object and subsets consisting of Homeos subpopulations (clusters 0, 1, 4), DAMs (clusters 1, 3, 5, 6) and DIMs (cluster 2). Significant DEGs are considered for an adjusted p value (FDR) inferior to 0.05 and log2FoldChange superior to 1. b Heatmap representation of the significance of the overlap between the lists of pseudobulk DEGS, calculated with the GeneOverlap function. Overlaps were calculated between each pathology within each subset (HuMicA, Homeos, DAMs, DIMS). The degree of significance is depicted by the Jaccard index and a p-value inferior to 0.05 is highlighted by a white asterisk. c Dot plot representation of the gene ontology (GO) enrichment of all lists of pseudobulk DEGs between each pathology and controls accounting for the complete HuMicA object and subsets consisting of Homeos subpopulations (clusters 0, 1, 4), DAMs (clusters 1, 3, 5, 6), DIMs (cluster 2) and MAC (cluster 7). Selected statistically significant GO terms are represented (adjusted p-value (Benjamini-Horchberg) < 0.05). Significance is represented by the log of the fold change and the negative of the log of the adjusted p-value (FDR). Source data are provided as a Source Data file.

References

    1. Ginhoux, F. et al. Fate mapping analysis reveals that adult microglia derive from primitive macrophages. Science330, 841–845 (2010). - PMC - PubMed
    1. Ginhoux, F., Lim, S., Hoeffel, G., Low, D. & Huber, T. Origin and differentiation of microglia. Front Cell Neurosci.7, 45 (2013). - PMC - PubMed
    1. Martins-Ferreira, R., Leal, B., Costa, P. P. E. & Ballestar, E. Microglial Innate Memory and Epigenetic Reprogramming in Neurological Disorders. Prog. Neurobiol. 101971. 10.1016/j.pneurobio.2020.101971 (2020). - PubMed
    1. Li, Q. & Barres, B. A. Microglia and macrophages in brain homeostasis and disease. Nat. Rev. Immunol.18, 225–242 (2018). - PubMed
    1. Woodburn, S. C., Bollinger, J. L. & Wohleb, E. S. The semantics of microglia activation: neuroinflammation, homeostasis, and stress. J. Neuroinflammation18, 258 (2021). - PMC - PubMed

MeSH terms

LinkOut - more resources