

Population attributable fractions for modifiable risk factors of neonatal, infant, and under-five mortality in 48 low- and middle-income countries
- PMID: 39820022
- PMCID: PMC11739818
- DOI: 10.7189/jogh.15.04015
Population attributable fractions for modifiable risk factors of neonatal, infant, and under-five mortality in 48 low- and middle-income countries
Abstract
Background: Identifying the modifiable risk factors for childhood mortality using population-attributable fractions (PAFs) estimates can inform public health planning and resource allocation in low- and middle-income countries (LMICs). We estimated PAFs for key population-level modifiable risk factors of neonatal, infant, and under-five mortality in LMICs.
Methods: We used the most recent Demographic and Health Survey data sets (2010-22) from 48 LMICs, encompassing 35 sub-Saharan African countries and 13 countries from South and Southeast Asia (n = 506 989). We used generalised linear latent mixed models to compute odds ratios (ORs), and we calculated the PAFs adjusted for commonality using ORs and prevalence estimates for key modifiable risk factors.
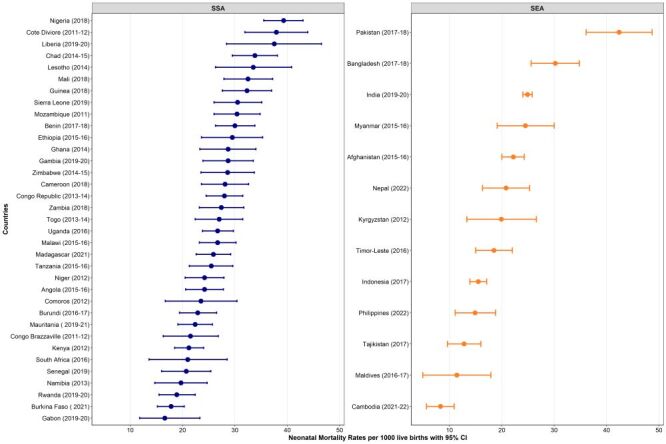
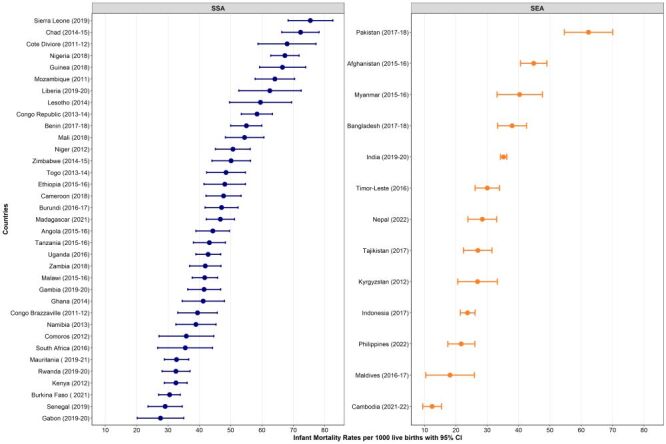
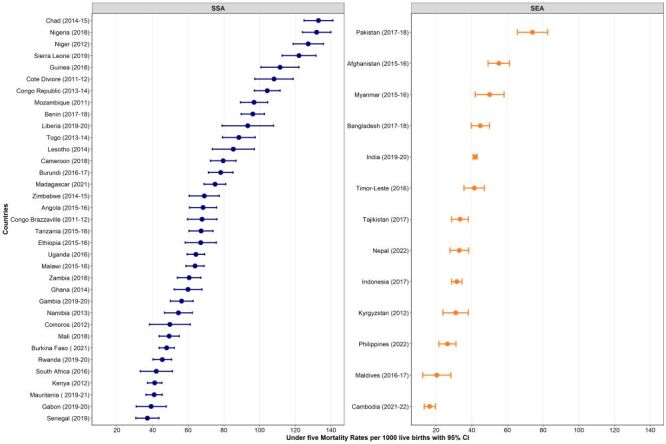
Results: The highest PAFs of neonatal mortality were attributed to delayed initiation of breastfeeding (>1 hour of birth) (PAF = 23.9; 95% confidence interval (CI) = 23.1, 24.8), uncleaned cooking fuel (PAF = 6.2; 95% CI = 6.4, 7.8), infrequent antenatal care (ANC) visits (PAF = 4.3; 95% CI = 3.3, 5.9), maternal lack of formal education (PAF = 3.9; 95% CI = 2.7, 5.3), and mother's lacking two doses of tetanus injections (PAF = 3.0; 95% CI = 1.9, 3.9). These five modifiable risk factors contributed to 41.4% (95% CI = 35.6, 47.0) of neonatal deaths in the 48 LMICs. Similarly, a combination of these five risk factors contributed to 40.5% of infant deaths. Further, delayed initiation of breastfeeding (PAF = 15.8; 95% CI = 15.2, 16.2), unclean cooking fuel (PAF = 9.6; 95% CI = 8.4, 10.7), mothers lacking formal education (PAF = 7.9; 95% CI = 7.0, 8.9), infrequent ANC visits (PAF = 4.0; 95% CI = 3.3, 4.7), and poor toilet facilities (PAF = 3.4; 95% CI = 2.6, 4.3) were attributed to 40.8% (95% CI = 36.4, 45.2) of under-five deaths.
Conclusions: Given the current global economic climate, policymakers should prioritise these modifiable risk factors. Key recommendations include ensuring that women enter pregnancy in optimal health, prioritising the presence of skilled newborn attendants for timely and proper breastfeeding initiation, and enhancing home-based care during the postnatal period and beyond.
Copyright © 2025 by the Journal of Global Health. All rights reserved.
Conflict of interest statement
Disclosure of interest: The authors completed the ICMJE Disclosure of Interest Form (available upon request from the corresponding author) and disclose no relevant interests.
Figures
Similar articles
-
Population modifiable risk factors associated with neonatal mortality in 35 sub-Saharan Africa countries: analysis of data from demographic and health surveys.EClinicalMedicine. 2024 Jun 20;73:102682. doi: 10.1016/j.eclinm.2024.102682. eCollection 2024 Jul. EClinicalMedicine. 2024. PMID: 39007064 Free PMC article.
-
Population modifiable risk factors associated with under-5 acute respiratory tract infections and diarrhoea in 25 countries in sub-Saharan Africa (2014-2021): an analysis of data from demographic and health surveys.EClinicalMedicine. 2024 Feb 3;68:102444. doi: 10.1016/j.eclinm.2024.102444. eCollection 2024 Feb. EClinicalMedicine. 2024. PMID: 38333537 Free PMC article.
-
Population-Modifiable Risk Factors Associated With Childhood Stunting in Sub-Saharan Africa.JAMA Netw Open. 2023 Oct 2;6(10):e2338321. doi: 10.1001/jamanetworkopen.2023.38321. JAMA Netw Open. 2023. PMID: 37851439 Free PMC article.
-
Impact of breastfeeding on mortality in sub-Saharan Africa: a systematic review, meta-analysis, and cost-evaluation.Eur J Pediatr. 2020 Aug;179(8):1213-1225. doi: 10.1007/s00431-020-03721-5. Epub 2020 Jun 26. Eur J Pediatr. 2020. PMID: 32592027
-
Community-based maternal and newborn educational care packages for improving neonatal health and survival in low- and middle-income countries.Cochrane Database Syst Rev. 2019 Nov 5;2019(11):CD007647. doi: 10.1002/14651858.CD007647.pub2. Cochrane Database Syst Rev. 2019. PMID: 31686427 Free PMC article.
References
-
- United Nations. Transforming our world: The 2030 agenda for sustainable development. New York, New York, USA: United Nations; 2015. Available: https://sustainabledevelopment.un.org/content/documents/21252030%20Agend.... Accessed: 7 January 2025.
-
- United Nations Inter-agency Group for Child Mortality Estimation (UN IGME). Levels and Trends in Child Mortality: Report 2020, estimates developed by the UN Inter-agency Group for Child Mortality Estimation. New York, New York, USA: United Nations Children’s Fund; 2020. Available: https://www.unicef.org/media/60561/file/UN-IGME-child-mortality-report-2.... Accessed: 7 January 2025.
-
- Sharrow D, Hug L, You D, Alkema L, Black R, Cousens S, et al. Global, regional, and national trends in under-5 mortality between 1990 and 2019 with scenario-based projections until 2030: a systematic analysis by the UN Inter-agency Group for Child Mortality Estimation. Lancet Glob Health. 2022;10:e195–206. 10.1016/S2214-109X(21)00515-5 - DOI - PMC - PubMed
MeSH terms
LinkOut - more resources
Full Text Sources
