. 2025 Jan 17;10(1):4.
doi: 10.1038/s41525-025-00463-x.

Adaptive evolution of SARS-CoV-2 during a persistent infection for 521 days in an immunocompromised patient

Affiliations

Adaptive evolution of SARS-CoV-2 during a persistent infection for 521 days in an immunocompromised patient

Hanno Schmidt et al. NPJ Genom Med. .

Abstract

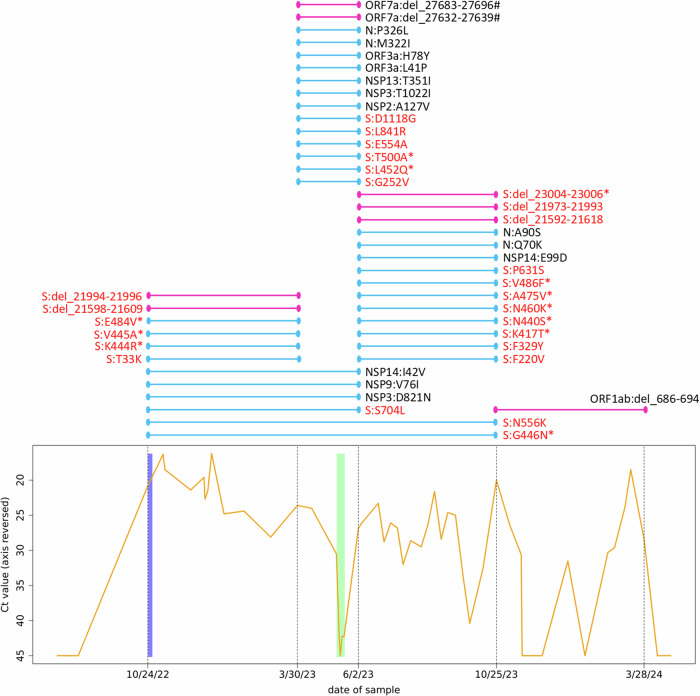
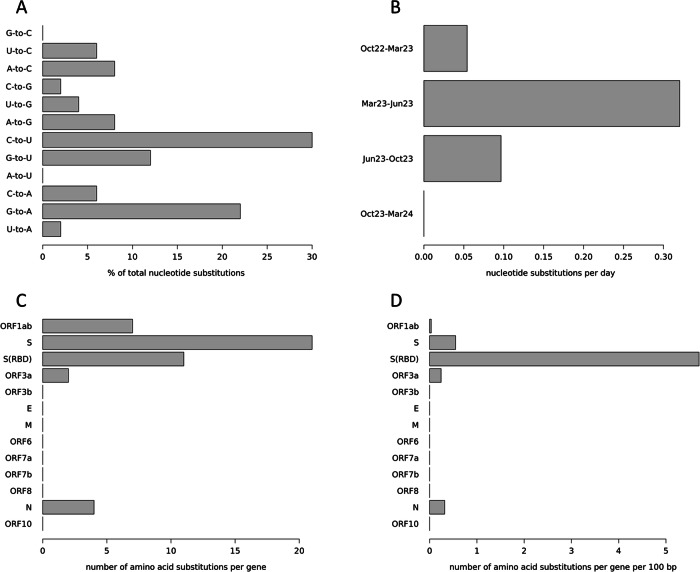
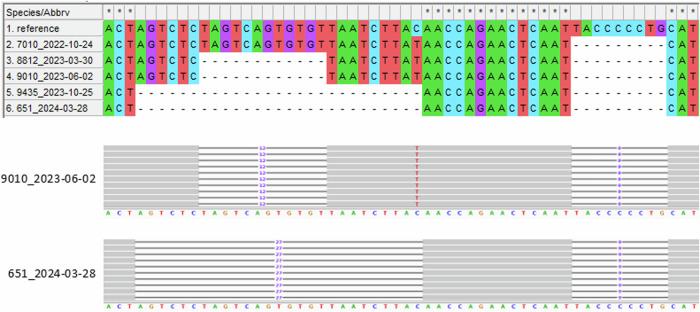
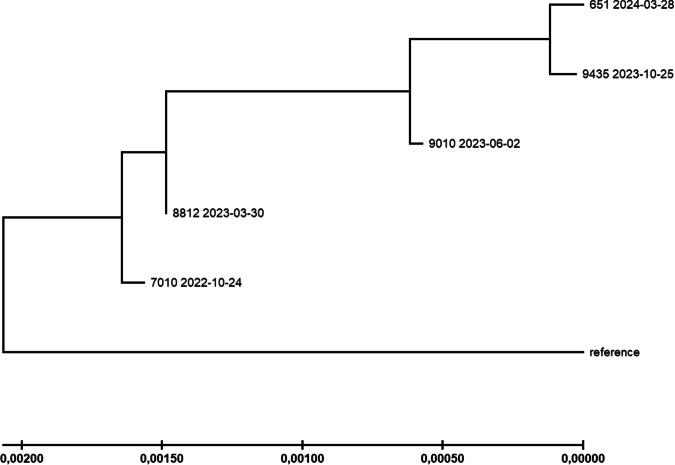
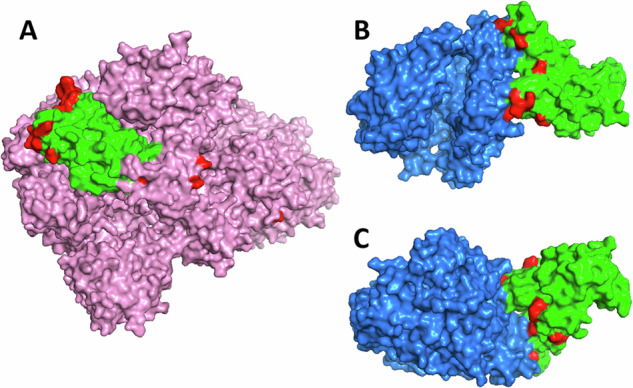
Immunocompromised patients struggle to adequately clear viral infections, offering the virus the opportunity to adapt to the immune system in the host. Here we present a case study of a patient undergoing allogeneic hematopoietic stem cell transplantation with a 521-day follow-up of a SARS-CoV-2 infection with the BF.7.21 variant. Virus samples from five time points were submitted to whole genome sequencing. Between the first detection of SARS-CoV-2 infection and its clearance, the patient's virus population acquired 34 amino acid substitutions and 8 deletions in coding regions. With 11 amino acid substitutions in the receptor binding domain of the virus' spike protein, substitutions were 15 times more abundant than expected for a random distribution in this highly functional region. Amongst them were the substitutions S:K417T, S:N440S, S:K444R, S:V445A, S:G446N, S:L452Q, S:N460K, and S:E484V at positions that are notorious for their resistance-mediating effects. The substitution patterns found indicate ongoing adaptive evolution.


Conflict of interest statement

Competing interests: The authors declare no competing interests.

Figures

Fig. 1
Fig. 1. History of the infection and resulting amino acid substitutions and deletions.
The graph at the bottom shows the course of the SARS-CoV-2 Ct values of the patient. Note the reversed y-axis. Negative tests are displayed as 45 (maximum of the applied test). Additional negative test results at the beginning and end of the shown time slot are documented but not shown. The blue bar behind the curve indicates the period during which the patient was administered tixagevimab and cilgavimab (10/24/2022) as well as molnupiravir (10/24–10/29/2022) as prescribed. The green bar behind the curve indicates the period during which the patient was administered remdesivir as prescribed (05/10–05/19/2023). Dashed vertical lines indicate the time points at which the patient’s virus population was whole-genome-sequenced, with the respective dates on the x-axis. The colored lines above this plot show the time windows (between two sequencing events) in which substitutions and deletions have become established in the virus population, each line representing one substitution/deletion. Light blue lines indicate amino acid substitutions (N = 34), and dark pink lines indicate deletions (N = 8). Deletions are given with genomic nucleotide coordinates. Hash signs after deletions indicate frameshift mutations, resulting in a presumably dysfunctional protein. Lines spanning two or more time intervals show the fixation process of the mutation in the virus population. Substitutions/deletions in the spike protein are highlighted in red, asterisks mark mutations in the receptor binding domain of the spike protein. S spike protein, N nucleocapsid protein, NSP nonstructural protein, ORF open reading frame, Ct value threshold cycle value in q-RT-PCR.
Fig. 2
Fig. 2. Nucleotide and amino acid substitution patterns.
A Nucleotide substitutions are detailed by their type, given in percent. For example, “G-to-C” means that a guanine was substituted by a cytosine. B Nucleotide substitutions over time. Shown are the periods between two sequencing events, substitution numbers are normalized to substitutions per day. Month names (Mar March, Jun June, and Oct October) are followed by the abbreviated year. C Amino acid substitutions per gene. D Amino acid substitutions per gene normalized by the gene length. S(RBD) receptor binding domain of the spike protein.
Fig. 3
Fig. 3. Acquired deletion in the spike protein sequence.
The upper part shows the genome region from position 21,589–21,644 for the five samples plus the reference sequence Wuhan-Hu-1 in a MEGA-X alignment. Samples are sorted by sampling date. The prominent, large deletion to the left (12, respectively 27 bp) was acquired in the patient’s virus population in a two-step process: the sequence coding for four amino acids (S:S13, S:Q14, S:C15, and S:V16) was deleted between October 2022 and March 2023, and the coding sequence for another five amino acids (S:V11, S:S12, S:N17, S:L18, and S:T19) was deleted between June 2023 and October 2023. No frameshift or amino acid substitution resulted from the deletions. The corresponding section from the sequence read mapping analysis of one representative sample for both states (short and long deletion) is shown in the IGV screenshot below. The smaller deletion to the right (9 bp) was present in the patient’s virus population from the beginning and resulted in the deletion of three amino acids (S:L24, S:P25, and S:P26) and an amino acid substitution (S:A27S) at the cleavage site.
Fig. 4
Fig. 4. Maximum Likelihood tree.
Phylogenetic relationships between the patient’s samples were inferred by the maximum Likelihood method and the Tamura-Nei model. The tree with the highest log likelihood (−41647.52) is shown. The tree is drawn to scale, with branch lengths indicating the number of substitutions per site (see scale at the bottom). Reference = SARS-CoV-2 reference sequence Wuhan-Hu-1. Tree generation was performed with MEGA-X.
Fig. 5
Fig. 5. Location of amino acid substitutions in the spike protein.
A Three-dimensional model of the spike protein (pink) with its receptor binding domain (RBD, green) and substitutions highlighted (red). B, C Three-dimensional model of the RBD bound to the ACE2 receptor (blue) depicted from two sides, with substitutions highlighted. Protein models visualized in PyMOL.

Similar articles

References

    1. Machkovech, H. M. et al. Persistent SARS-CoV-2 infection: significance and implications. Lancet Infect. Dis.24, e453–e462 (2024). - PubMed
    1. Avanzato, V. A. et al. Case study: prolonged infectious SARS-CoV-2 shedding from an asymptomatic immunocompromised individual with cancer. Cell183, 1901–1912 (2020). - PMC - PubMed
    1. Kemp, S. A. et al. SARS-CoV-2 evolution during treatment of chronic infection. Nature592, 277–282 (2021). - PMC - PubMed
    1. Vergouwe, M. & Kirby, T. Following longest known chronic SARS-CoV-2 infection of 613 days, experts highlight the risk of development of novel potentially immune-evasive SARS-CoV-2 variants due to persistent infections in immunocompromised patients. EurekAlert! https://www.eurekalert.org/news-releases/1041699 (2024).
    1. Snell, L. B. & Kirby, T. Longest known COVID-19 infection—505 days—described by UK researchers. EurekAlert! https://www.eurekalert.org/news-releases/950412 (2022).

LinkOut - more resources