Clinical Trial
. 2025 Jan;6(1):51-66.
doi: 10.1038/s43018-024-00879-x. Epub 2025 Jan 16.

Efficacy and tolerability of neoadjuvant therapy with Talimogene laherparepvec in cutaneous basal cell carcinoma: a phase II trial (NeoBCC trial)

Affiliations
Clinical Trial

Efficacy and tolerability of neoadjuvant therapy with Talimogene laherparepvec in cutaneous basal cell carcinoma: a phase II trial (NeoBCC trial)

Julia Maria Ressler et al. Nat Cancer. 2025 Jan.

Abstract

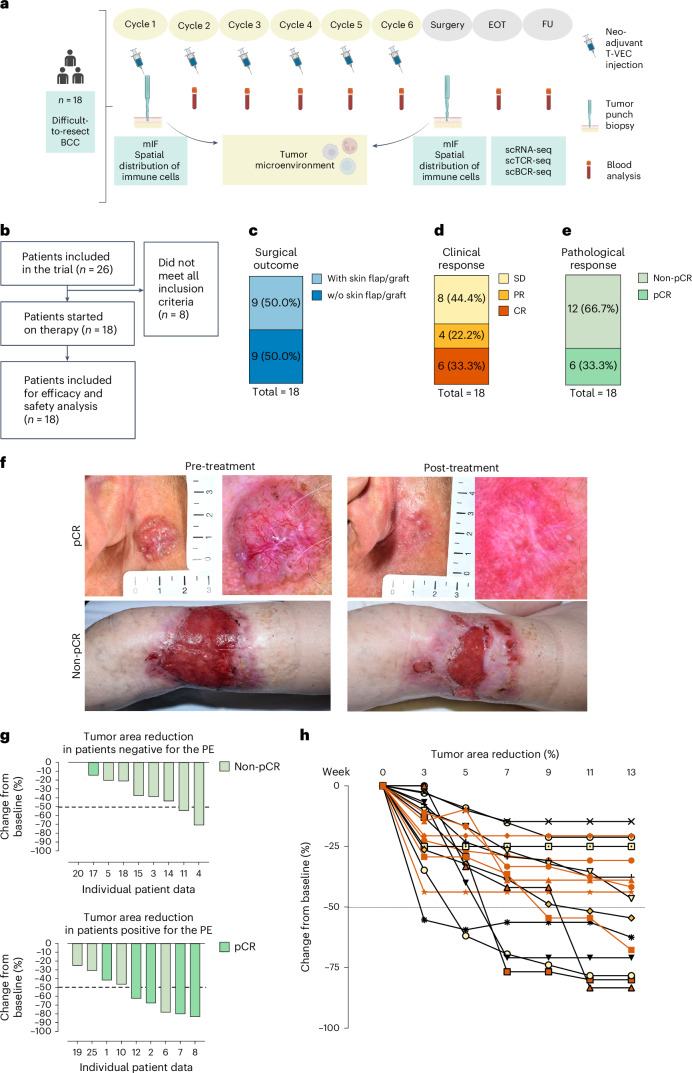
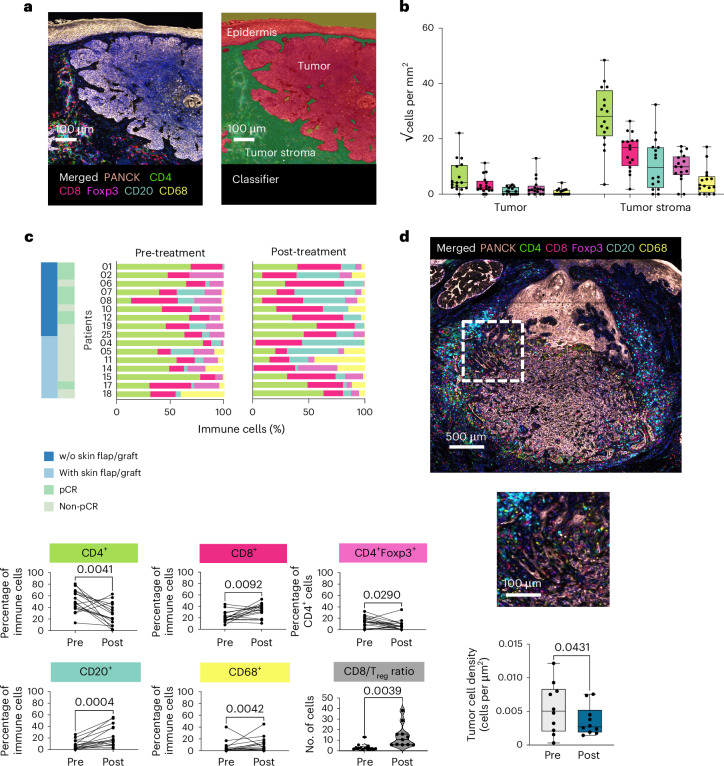
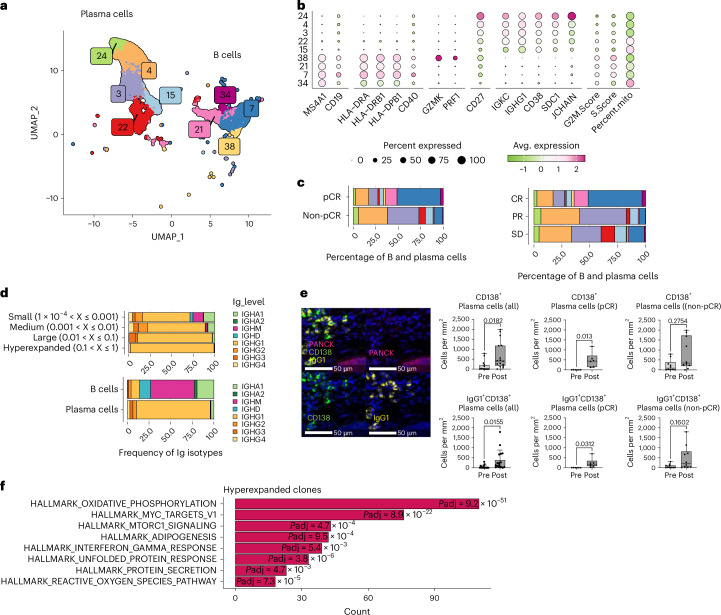
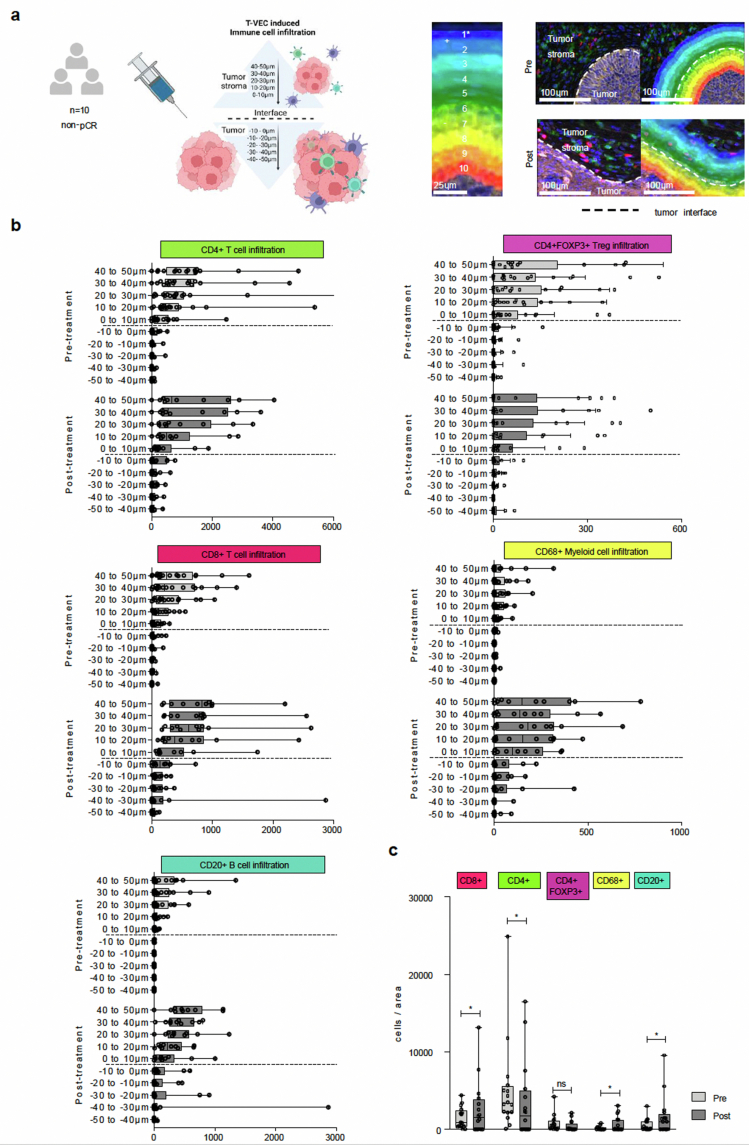
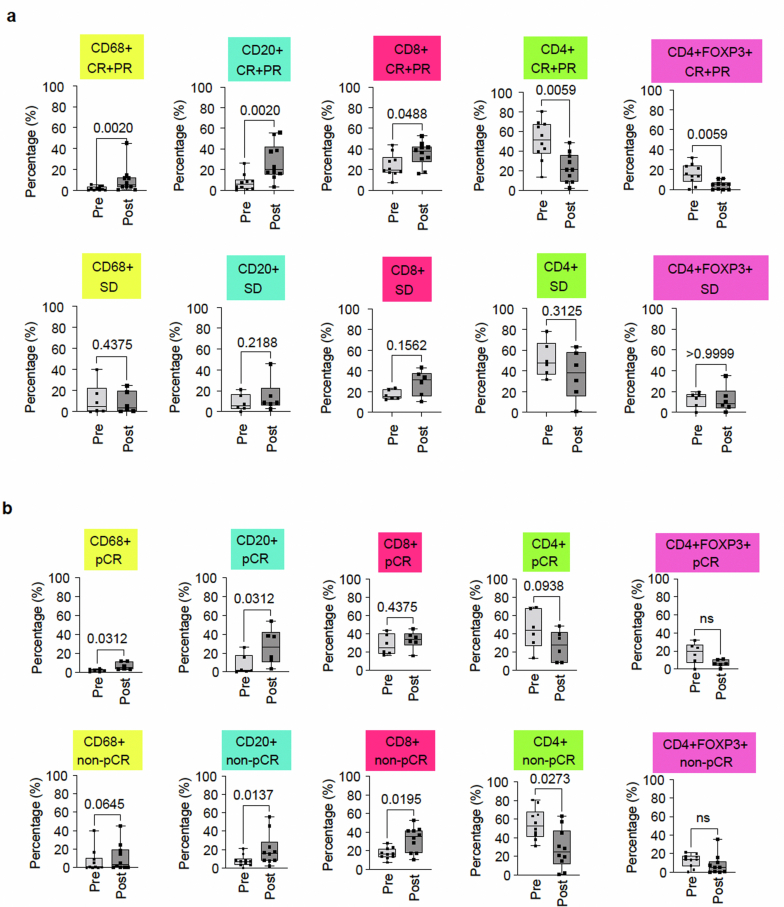
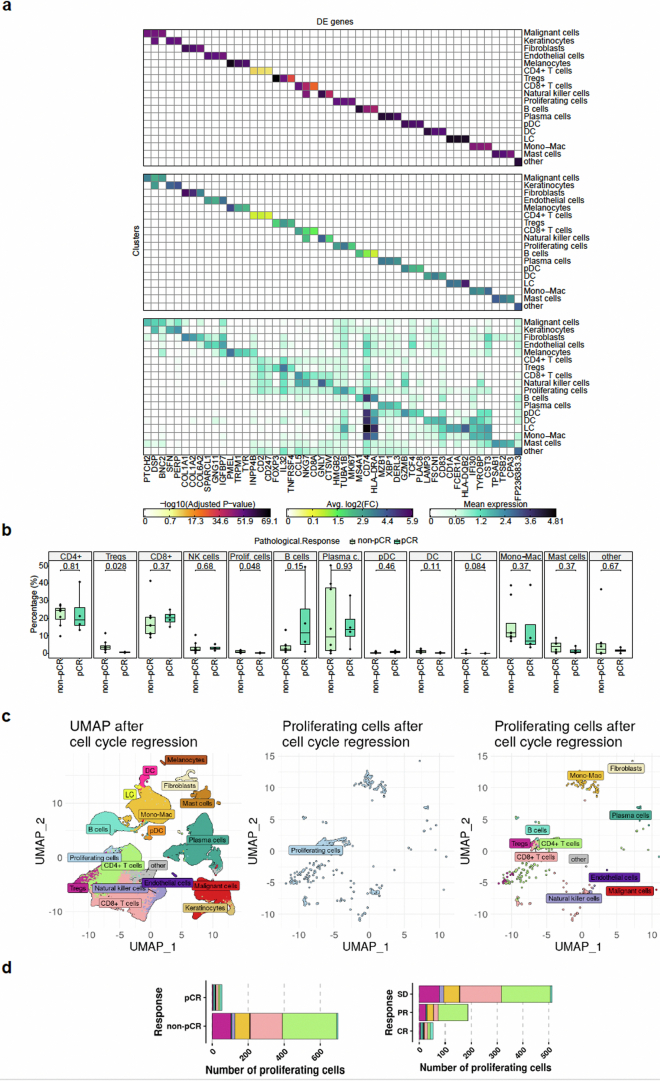
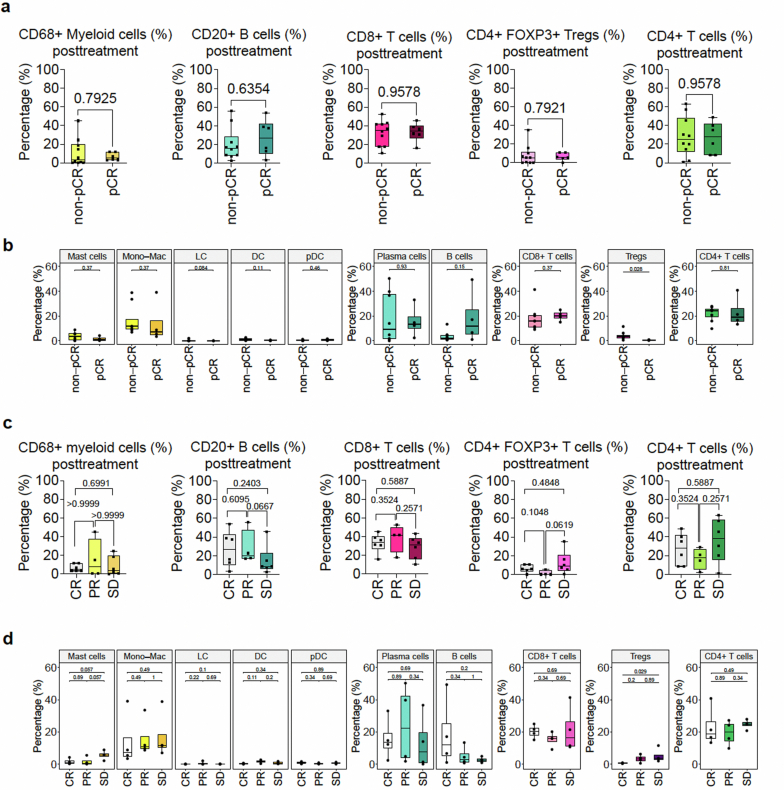
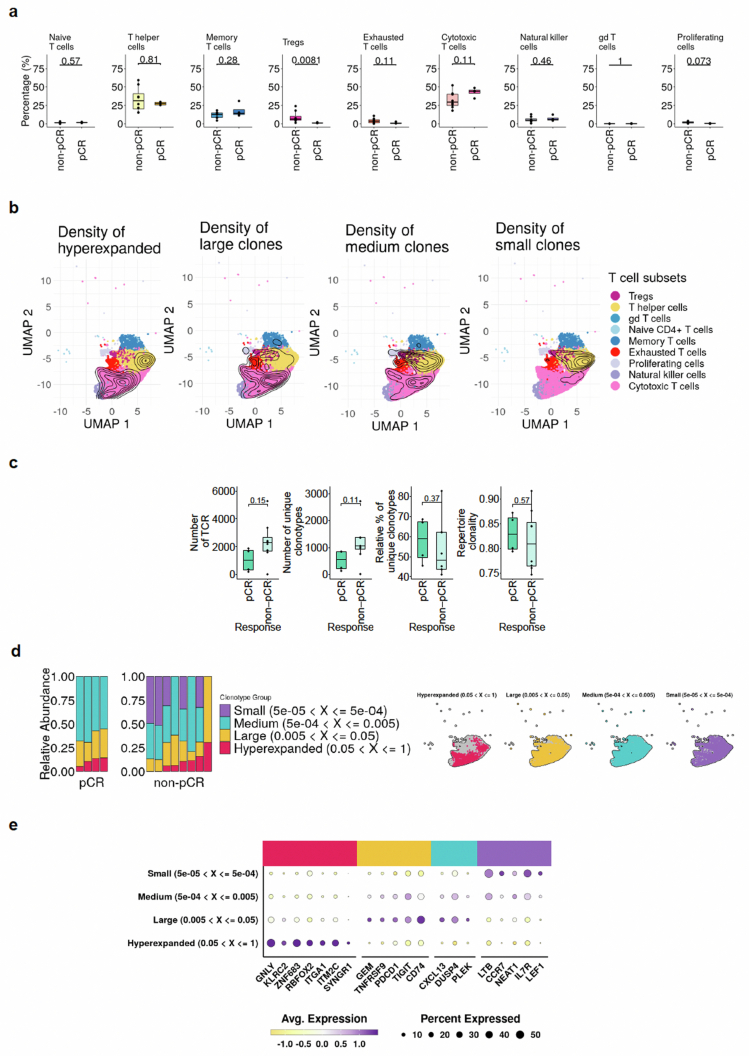
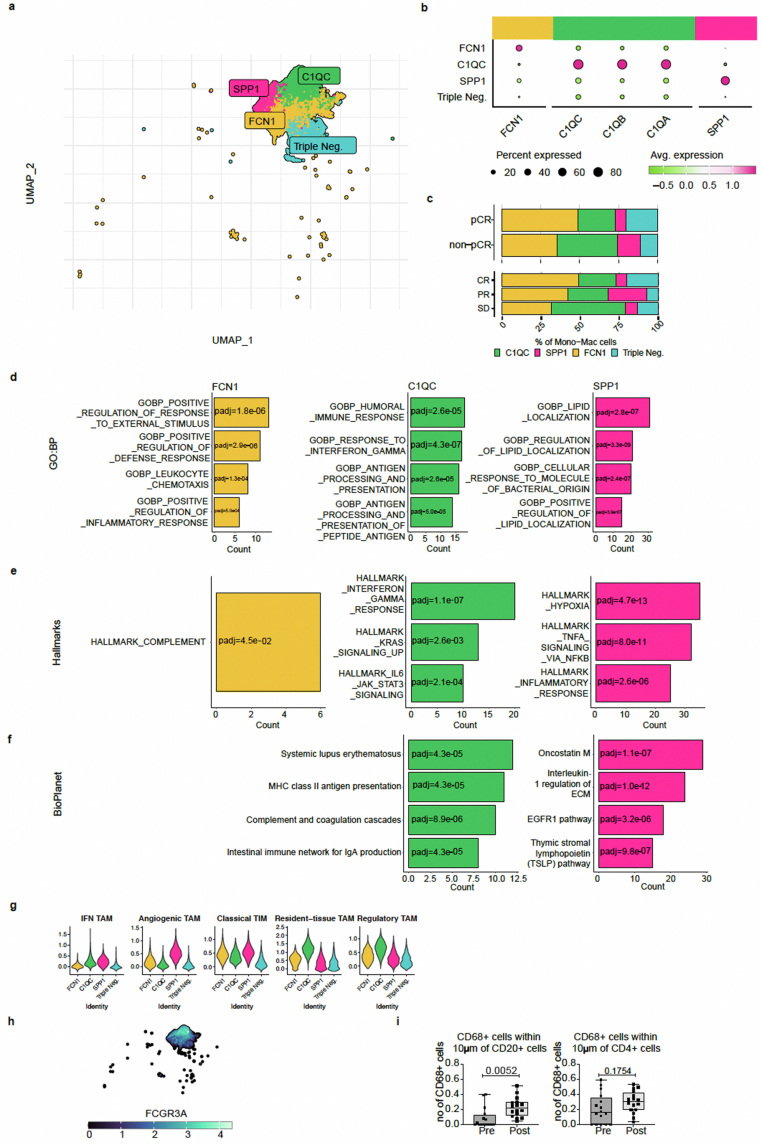
We present a single-arm, phase II, neoadjuvant trial with the oncolytic virus talimogene laherparepvec (T-VEC) in 18 patients with difficult-to-resect cutaneous basal cell carcinomas. The primary end point, defined as the proportion of patients, who after six cycles of T-VEC (13 weeks), become resectable without the need for plastic reconstructive surgery, was already achieved after stage I (9 of 18 patients; 50.0%); thus the study was discontinued for early success. The objective response rate was 55.6% and the complete pathological response rate was 33.3%. Secondary end points included safety, relapse-free survival and overall survival, time to occurrence of new basal cell carcinomas and biological read outs. Only mild adverse events occurred. The 6-month relapse-free survival and overall survival rates were 100%. In two patients a new basal cell carcinoma was diagnosed. T-VEC led to a significant increase in cytotoxic T cells (P = 0.0092), B cells (P = 0.0004) and myeloid cells (P = 0.0042) and a decrease in regulatory T cells (P = 0.0290) within the tumor microenvironment. Together, neoadjuvant T-VEC represents a viable treatment option for patients with difficult-to-resect basal cell carcinomas (EudraCT no. 2018-002165-19).


Conflict of interest statement

Competing interests: J.M.R. received speaker honoraria from Bristol-Myers Squibb, Roche, Amgen and Novartis and travel support by Sanofi, Roche and Bristol-Myers Squibb through the institution. P.T. received honoraria from Silverchair, unrestricted grants for education projects from Lilly, and honoraria for lectures from AbbVie, Lilly, FotoFinder and Novartis. J.T. reports an unrestricted grant from Lilly, consulting fees from Lilly, speaker honoraria from Lilly and Novartis, all outside the submitted work, as well as travel support from Almirall, AbbVie and Bristol-Myers Squibb through institution. C.H. reports speaker honoraria from Amgen, BMS, MSD, Novartis, Roche, participation in advisory Boards: Amgen, Astra Zeneca, BMS, Incyte, MSD, Novartis, Pierre Fabre, Roche and research funding by Amgen to the institution. The other authors declare no competing interests.

Figures

Fig. 1
Fig. 1. Clinical activity of neoadjuvant treatment with T-VEC in cutaneous basal cell carcinoma.
a, Illustrated study scheme and treatment schedule. Biomarker analysis was performed with mIF pre- and post-treatment, scRNA-seq and scTCR-seq and scBCR-seq post-treatment. Image was created in BioRender. b, Flowchart of the NeoBCC trial. In total, 18 patients started therapy and were included for the final analysis of the study. One patient requested premature termination of the study treatment due to a grade 2 AE. c, Patient response after six cycles of T-VEC administration was split into surgical outcome (with or without (w/o) skin flap/graft). d, Clinical response defined according to the WHO response criteria (CR, PR and SD). e, Pathological response classified in pCR and non-pCR. f, Exemplary clinical and dermoscopic images of two BCCs, pre- and post-treatment. One patient had a pCR with tumor regression and fibrosis post-treatment (top right) and one patient with a locally advanced BCC had a non-pCR with a tumor area reduction after T-VEC treatment (bottom right). g, Waterfall plots presenting the overall tumor area reduction (%) from baseline before first T-VEC injection until the time point of surgery in patients positive and negative for the primary end point (PE), including information about the pathological response (pCR, dark green; non-pCR, light green) on an individual patient level. Patient 20 had no change after two cycles of T-VEC and dropped out of the study due to an AE. The dashed line represents the 50% tumor area reduction threshold. h, A spider plot exemplifying the tumor area reduction (%) of each patient according to treatment time points. Source data
Fig. 2
Fig. 2. T-VEC reprograms the tumor immune microenvironment.
a, Representative images of a baseline sample with merged seven-plex immunofluorescence staining (PanCK (rose), CD4 (green), CD8 (red), Foxp3 (magenta), CD20 (blue) and CD68 (yellow) markers were targeted in addition to nuclear counterstaining with 4,6-diamidino-2-phenylindole (DAPI)) image (left) and tissue segmentation in tumor, tumor stroma and epidermis are displayed (right). Scale bar 100 µm. b, The immune cell infiltrate of patients with treatment-naive BCCs (n = 16) is presented separately in tumor and tumor stroma by box plots (√cells per mm2) (CD4+, P = 0.0041; CD4+Foxp3+, P = 0.0290; CD8+, P = 0.0092; CD68+, P = 0.0042; CD20+, P = 0.0004) (two-sided Wilcoxon signed-rank test, statistical significance determined with P < 0.05). Data are presented as mean ± s.e.m. Each box extends from the 25th (Q1, lower bound of box) to the 75th (Q3, upper bound of box) percentile, the horizontal line in the center of the box represents the median value (Q2), the lower bound of lower whiskers mark the 5th (min) and the upper bound of whiskers the 95th (max) percentiles, dots represent individual values. c, Distribution of immune cells (relative values, %) on an individual patient level pre- and post-treatment, in accordance with the surgical outcome (with or without (w/o) skin flap/graft) and pathological response (pCR and non-pCR) are displayed in bar plots. Immune cells (%) pre- versus post-treatment are displayed with bar plots (two-sided Wilcoxon signed-rank test, statistical significance determined with P < 0.05). d, Representative post-treatment histopathological picture (seven-plex immunofluorescence panel), 500 µm and 100 µm bar, from one patient (n = 1). Tumor cell density is presented in box plots pre- and post-treatment from patients with a non-pCR (n = 10). Data are presented as mean ± s.e.m. (two-sided Wilcoxon signed-rank test, statistical significance determined with P < 0.05). Each box extends from the 25th (Q1, lower bound of box) to the 75th (Q3, upper bound of box) percentile, the horizontal line in the center of the box represents the median value (Q2), the lower bound of lower whiskers mark the 5th (min) and the upper bound of whiskers the 95th (max) percentiles; dots represent individual values. Source data
Fig. 3
Fig. 3. Immune cell heterogeneity after T-VEC treatment.
a, UMAP of tumor cells and their microenvironment in post-treatment BCC samples (n = 102,093 cells) from a subset of patients (n = 12) by scRNA-seq analysis. A total of 18 cell clusters were identified and denoted by colors such as malignant cells, keratinocytes, fibroblasts, endothelial cells, melanocytes, three T cell subsets, NK cells, proliferating cells, B and plasma cells, pDCs, dendritic cells, LCs, mast cells and Mono-Mac, as well as a nondefined ‘other’ cluster. b, Bubble plot indicating the average (Avg.) expression of selected marker genes of the cell types in a. Source data
Fig. 4
Fig. 4. T-VEC favors the expansion of hyper-expanded, cytotoxic T cell clones.
a, UMAP presenting post-treatment T cells (eight clusters) and NK cells (one cluster) b, Bubble plot indicating the average (Avg.) expression of selected marker genes in each cell cluster, including a subclassification of T helper cells (13 clusters). c, Bar plots presenting the composition of T cells. The colors reflect the ones of the immune cell clusters of a, split by pathological (pCR versus non-pCR) and clinical (CR, PR and SD) response (two-sided Wilcoxon rank-sum test; statistical significance determined with P < 0.05). d, Violin plot demonstrating the ratio of cytotoxic T cells and Treg cells. Cytotoxic T cell/Treg ratio of patients according to pathological response (pCR (n = 4) and non-pCR (n = 8)) and clinical response (CR (n = 4), PR (n = 4) and SD (n = 4)) (two-sided Wilcoxon rank-sum test; statistical significance determined with P < 0.05). e, Bar plots presenting terms from the MSigDB Hallmarks database that were enriched in hyper-expanded T cell clones. Terms are ranked by the total number of genes overlapping differentially expressed genes and adjusted P values are indicated (enricher one-sided hypergeometric test with false discovery rate correction; Benjamini–Hochberg). The universe is defined by all detected genes in the T cell subset. f, Bar plots displaying the number of T cell clones aligned to the MacPAS-TCR database according to human HSV- and cancer-associated TCRs. Source data
Fig. 5
Fig. 5. T-VEC fosters a humoral immune response.
a, UMAP of plasma and B cells after treatment (nine clusters). b, Bubble plot indicating the average (Avg.) expression levels of selected marker genes in each cell cluster. c, Bar plots presenting the composition of B and plasma cells. The colors reflect the ones of the immune cell clusters of a, split by pathological response classified in pCR and non-pCR and clinical response categorized in CR, PR and SD. d, Bar plots showing immunoglobulin (Ig) types in B and plasma cells according to their clonality (left) and cell type (right). e, Exemplary merged mIF staining (IgG1+, yellow; CD138+, green; PanCK+, pink) of a pre-treatment BCC, and corresponding single stainings (IgG1+, yellow; CD138+, green; PanCK+, pink). Scale bar, 50 µm, ×40 magnification. CD138+ plasma cells pre- versus post-treatment (P = 0.0182) and IgG1+CD138+ plasma cells pre- versus post-treatment (P = 0.0155) from patients with paired tumor tissue samples (n = 16) are separately represented by box plots (cells per mm2), and according to pathological response (pCR (n = 6) (P = 0.013)/(P = 0.0312) and non-pCR (n = 10) (P = 0.275)/(P = 0.1602)) (two-sided Wilcoxon signed-rank test; statistical significance determined with P < 0.05). Data are presented as mean ± s.e.m. Each box extends from the 25th (Q1, lower bound of the box) to the 75th (Q3, upper bound of the box) percentile, the horizontal line in the center of the box represents the median value (Q2), the lower bound of lower whiskers mark the 5th (min) percentile and the upper bound of whiskers the 95th (max) percentile. Dots represent individual values. f, Bar plots displaying terms from the MSigDB Hallmarks database. Terms are ranked by P value and the total number of genes overlapping differentially expressed genes and adjusted P value are indicated (enricher one-sided hypergeometric test with false discovery rate correction; Benjamini–Hochberg). The universe is defined by all detected genes in the B cell/plasma cell subsets. Source data
Extended Data Fig. 1
Extended Data Fig. 1. Workflow of the analysis of 7-plex Immunofluorescence images.
Representative pictures of analysis workflow in HALO® quantitative pathology software (Indica Labs) of selected patients (n = 2). a, H&E staining of whole-tumor tissue and corresponding multispectral images (MSI, 1872x 1404) fused in HALO, 500 µm bar, 1x magnification. 3–6 equally sized areas, consisting of 50% tumor stroma and 50% tumor islands in case of available tumor islands, were selected from a representative patient tumor tissue sample (n = 1). b, Overview of the automated image analysis: Multispectral imaging, tissue segmentation in tumor and tumor stroma, cell phenotyping, infiltration analysis (tumor margin was set as the interface (red line) and an inside/outside range of 50 µm was split into 10 bands) and density analysis, 100 µm bar, 5× magnification from a representative patient tumor tissue sample (n = 1). c, Immune cell subsets are presented in merged and single stainings (PanCK / rose; CD4 / green; Foxp3 / magenta; CD8 / red; CD20 / blue; CD68 / yellow), 100 µm bar, 5× magnification. Analysis markup classified with the nuclei segmentation classifier Nuclei Seg (Plugin) - FL v1.0.0) and analyzed (Indica Labs – HighPlex FL v4.1.3 algorithm) from a representative patient tumor tissue sample (n = 1). The analysis was repeated once to ensure reproducibility.
Extended Data Fig. 2
Extended Data Fig. 2. Increased intratumoral immune cell infiltration in pathological non-complete responders after T-VEC treatment.
a, Schematic study workflow. Ten patients with a pathological non-complete response (non-pCR) were analyzed (left). Created in BioRender. Ressler, J. (2023) BioRender.com/h45s802. Tumor infiltration analysis was performed with HALO® quantitative pathology software. Tumor margin was set as the interface (dashed line) and an inside/outside range of 50 µm was split in a total of 10 bands (middle), 25 µm bar. Distance from the tumor margin is indicated by a rainbow color gradient (blue to dark green for extratumoral range (+; band 1-5) and light green to red for intratumoral range (-; band 6-10). Exemplary pre- and post-treatment samples are presented on the right (PanCK / rose; CD4 / green; Foxp3 / magenta; CD8 / red; CD20 blue; CD68 / yellow), 100 µm bar. b, Spatial analysis of immune cells pre- and post-treatment from patients with a non-pCR (n = 10): CD4 + T cell, CD8 + T cell, CD20 + B cell, CD4+ Foxp3+ Treg and CD68+ myeloid cell infiltration. c, The box plots illustrate differences between the sum of immune cells infiltrating all ten bands, pre- (light gray) and post-treatment (dark gray) from patients with a non-pCR (n = 10) and show a significant increase of CD8 + T cells (p = 0.002), CD20 + B cells (p = 0.002) and CD68+ myeloid cells (p = 0.002) and decrease of CD4 + T cells (p = 0.0488), CD4+Foxp3+ Tregs (p = 0.2754) (two-sided Wilcoxon signed-rank test; statistical significance determined with p < 0.05). Data are presented as mean values +/- SEM. Each box extends from the 25th (Q1, lower bound of box) to the 75th (Q3, upper bound of box) percentile, the horizontal line in the center of the box represents the median value (Q2). The lower whiskers extend to the 5th (min, lower bound) and the 95th percentile (max, upper bound). Individual data points are plotted as dots outside the whiskers and are defined as outliers. Source data
Extended Data Fig. 3
Extended Data Fig. 3. Increased immune cell infiltration in patients with a clinically meaningful tumor area reduction.
CD68+ myeloid cells, CD20 + B cells, CD8 + T cells, CD4+Foxp3+ T cells and CD4 + T cells presented by box plots (cells/mm2) analyzed with multiplex immunofluorescence from patients with paired tumor tissue samples (n = 16) a, according to clinical response (CR (n = 6) and PR (n = 4)), p-values are included in individual plots: CD8 + T cells (p = 0.0488), CD20 + B cells (p = 0.0020), CD68+ myeloid cells (p = 0.0020), CD4 + T cells (p = 0.0059), CD4+Foxp3+ Tregs (p = 0.0059); SD (n = 6): CD8 + T cells (p = 0.1562), CD20 + B cells (p = 0.2188), CD68+ myeloid cells (p = 0.4375), CD4 + T cells (p = 0.3125), CD4+Foxp3+ Tregs (p = 0.9999)) (two-sided Wilcoxon rank-sum test; statistical significance determined with p < 0.05). b, according to pathological response (pCR (n = 6), p-values are included in individual plots: CD20 + B cells (p = 0.0312), CD68+ myeloid cells (p = 0.0312), CD8 + T cells (p = 0.4375), CD4 + T cells (0.0938), Tregs (p = 0.0625); non-pCR (n = 10): CD8 + T cells (p = 0.0195), CD20 + B cells (p = 0.0137), CD68+ myeloid cells (p = 0.0645), CD4 + T cells (p = 0.0273), CD4+Foxp3+ Tregs (p = 0.3223)). Data are presented as mean values +/- SEM. The box plots display the distribution of cell counts for each immune cell population based on response categories. Each box extends from the 25th (Q1, lower bound of box) to the 75th (Q3, upper bound of box) percentile, the horizontal line in the center of the box represents the median value (Q2). The whiskers extend to the 5th (min, lower bound) and the 95th percentile (max, upper bound). Dots represent individual patient data points. Source data
Extended Data Fig. 4
Extended Data Fig. 4. Characterization of the immune cell landscape of T-VEC-treated basal cell carcinomas from a single-cell perspective.
a, Differentially expressed (DE) genes of different cell clusters are presented in a heatmap. b, Box plots indicating the abundance of cells in ten immune cell clusters split by patients with a pCR (n = 4) and non-pCR (n = 8). Data are presented as mean values +/- SEM, p-values are included in individual plots (two-sided Wilcoxon rank-sum test; statistical significance determined with p < 0.05; exact p-value Tregs = 0.028, proliferating cells = 0.048). Each box extends from the 25th (Q1, lower bound of box) to the 75th (Q3, upper bound of box) percentile, the horizontal line in the center of the box represents the median value (Q2). The whiskers extend to the 5th (min, lower bound) and the 95th percentile (max, upper bound). Dots outside the whiskers indicate outliers. c, UMAPs displaying all immune cell clusters after cell cycle regression analysis, proliferating cells after cell cycle regression and proliferating cells after cell cycle regression highlighting different cell clusters. d, Bar plot showing the abundance of immune cells within the proliferating cell cluster (The colors reflect the ones of the immune cell clusters of panel c) of patients according to the pathological response (pCR and non-pCR). Source data
Extended Data Fig. 5
Extended Data Fig. 5. Comparison of multiplex immunofluorescence and single-cell RNA-seq data.
a, Post-treatment immune cell compartments such as CD68+ myeloid cells, CD20 + B cells, CD8 + T cells, CD4+Foxp3+ T cells and CD4 + T cells, separately presented from patients with paired tumor tissue samples (n = 16) according to pathological response (pCR (n = 6) versus non-pCR (n = 10)) by box plots (cells/mm2). b, Box plots indicating the abundance of cells in ten immune cell clusters split by patients with a pCR (n = 4) and non-pCR (n = 8), p-values are included in individual plots (two-sided Wilcoxon rank-sum test; statistical significance determined with p < 0.05). c, Post-treatment immune cell compartments consisting of CD68+ myeloid cells, CD20 + B cells, CD8 + T cells, CD4+Foxp3+ T cells and CD4 + T cells, from patients with paired tumor tissue samples (n = 16), separately presented according to clinical response (CR (n = 6) and PR (n = 4) versus SD (n = 6)) by box plots (cells/mm2). d, Box plots indicating the abundance of cells in ten immune cell clusters split by patients with a CR (n = 4), PR (n = 4) and SD (n = 4). Data are presented as mean values +/- SEM, p-values are included in individual plots (two-sided Wilcoxon rank-sum test; statistical significance determined with p < 0.05). The box plots display the distribution of cell counts for each immune cell population based on response categories. Each box extends from the 25th (Q1, lower bound of box) to the 75th (Q3, upper bound of box) percentile, the horizontal line in the center of the box represents the median value (Q2). The whiskers extend to the 5th (min, lower bound) and the 95th percentile (max, upper bound). Dots outside the whiskers indicate outliers. Source data
Extended Data Fig. 6
Extended Data Fig. 6. Clonal analysis of T cells in T-VEC-treated basal cell carcinomas.
a, Box plots for eight T cell subclusters and one natural killer (NK) cell cluster (cp. Fig. 4) according to pathological and clinical response. Brackets and numbers indicate the p-value of each cell population (two-sided Wilcoxon rank-sum test; statistical significance determined with p < 0.05) (n = 12). b, Paired scRNA-seq and single-cell T cell receptor sequencing (scTCR-seq) are presented by UMAP showing the density of hyper-expanded, large, medium, and small T cell clones. c, Box plots illustrate the absolute number, the number of unique clones, relative percent of unique clonotypes, and repertoire clonality of T cell clones according to patients with a pathological complete response (pCR) and pathological non-complete response (non-pCR) (n = 12). Data are presented as mean values +/- SEM, p-values are included in individual plots (two-sided, Wilcoxon signed sum rank test; statistical significance determined with p < 0.05). Each box extends from the 25th (Q1, lower bound of box) to the 75th (Q3, upper bound of box) percentile, the horizontal line in the center of the box represents the median value (Q2). The whiskers extend to the 5th (min, lower bound) and the 95th percentile (max, upper bound). Dots outside the whiskers indicate outliers. d, Bar plots indicating the relative abundance of T cells by clonality in each paired single-cell RNA sequencing (scRNA-seq) and single-cell T cell receptor sequencing (scTCR-seq) dataset, split by pathological response. UMAP shows the distribution of cells by clonality. e, Bubble plot indicating the average expression of differentially expressed (DE) genes of T cell clones. Source data
Extended Data Fig. 7
Extended Data Fig. 7. Macrophage diversity in the TME of T-VEC-treated BCCs.
a, UMAP presenting post-treatment myeloid cells with a total of four cluster (FCN1 + , C1QC + , SPP1+ and one triple negative cluster). b, Bubble plot indicating the average expression of selected marker genes in each cluster (FCN1 + , C1QC + , SPP1 + ). c, Bar plots presenting the composition of myeloid cells, split by pathological and clinical response. The colors reflect the ones of the immune cell clusters of panel a). d-f, Functional enrichment analysis of FCN1 + (yellow), C1QC+ (green), SPP1 + (pink) macrophages with (d) the Gene Ontology Biological Processes (GOBP) (e) MSigDB Hallmarks and (f) BioPlanet gene sets, using enricher one-sided hypergeometric test with false discovery rate correction (Benjamini & Hochberg) [111]. Adjusted p-values are shown. The universe is defined by all detected genes in the macrophage subset. g, Violin plots showing inflammatory tumor-associated macrophages (TAMs) (IFN_TAM1), pro-angiogenic macrophages (Anigo_TAM1), classical tumor-infiltrating monocytes (Classical_TIM1), resident tissue macrophages (RTM_TAM1) and immune regulatory TAMs (Reg_TAM1) signatures in relation to FCN1 + , C1QC + , SPP1+ and triple negative cell clusters. h, Feature plot presenting the gene expression of FCGR3A (CD16). i, Box plots displaying the proximity analysis of CD68+ macrophages surrounding CD20 + B cells (p = 0.0052) and CD4 + T cells (p = 0.1754) within 10 µm, pre- versus post-treatment from patients with paired tumor tissue samples (n = 16) (two-sided Wilcoxon signed-rank test, statistical significance determined with p < 0.05). The box plots display the distribution of cell counts for each immune cell population based on response categories. Data are presented as mean values +/- SEM. Each box extends from the 25th (Q1, lower bound of box) to the 75th (Q3, upper bound of box) percentile, the horizontal line in the center of the box represents the median value (Q2). The whiskers extend to the 5th (min, lower bound) and the 95th percentile (max, upper bound). Dots represent individual patient data points. Source data
Extended Data Fig. 8
Extended Data Fig. 8. Distinct B and plasma cell features.
a, Box plots present the abundance of cells in the nine B and plasma cell subclusters split by patients (n = 12) with a pathological complete response (pCR) and pathological non-complete response (non-pCR) and clinical response (CR, PR and SD). Data are presented as mean values +/- SEM. Brackets and numbers indicate the p-value of each cell population (cp. Fig. 3) (two-sided, Wilcoxon signed sum rank test; statistical significance determined with p < 0.05). Each box extends from the 25th (Q1, lower bound of box) to the 75th (Q3, upper bound of box) percentile, the horizontal line in the center of the box represents the median value (Q2). The whiskers extend to the 5th (min, lower bound) and the 95th percentile (max, upper bound). Dots outside the whiskers indicate outliers. b, Feature and violin plots showing the expression of selected genes in B and plasma cells: antigen presenting (Ag) (major histocompatibility complex, class II, DR alpha (HLA-DRA)), cytotoxic (Granzyme K (GZMK)) and memory (CD27) phenotypes and transcription factor of X-box binding protein 1 (XBP1) (n = 12). The violin plots illustrate the distribution of cells of each cluster. Data are presented as mean values +/- SEM. The lower and upper bound represents the 5th (min) and the 95th (max) percentiles, respectively. Dots outside the plots indicate individual outlier values. The box within each violin extends from the 25th (Q1, lower bound of the box) to the 75th percentile (Q3, upper bound of the box), with the horizontal line within the box marking the median value (Q2). c, Feature and violin plots displaying the gene expression of selected genes in B and plasma cells. B cells show cytotoxic Perforin 1 (PRF1) features, but no immunosuppressive phenotypes such as Interleukin 10 (IL10), Transforming growth factor beta 1 (TGFB1) (n = 12). Data are presented as mean values +/- SEM. The violin plots illustrate the distribution of cells of each cluster. The lower and upper bound of the violin plot represents the 5th (min) and the 95th (max) percentiles, respectively. Dots outside the plots indicate individual outlier values. The box within each violin extends from the 25th (Q1, lower bound of the box) to the 75th percentile (Q3, upper bound of the box), with the horizontal line within the box marking the median value (Q2). Source data
Extended Data Fig. 9
Extended Data Fig. 9. Clonal analysis of B cells in T-VEC-treated basal cell carcinomas.
a, Paired single-cell RNA sequencing (scRNA-seq) and single-cell B cell receptor sequencing (scBCR-seq) demonstrated by uniform manifold approximation and projection (UMAP) showing the density of hyper-expanded, large, medium, and small B and plasma cell clones. b, Bar plots indicating the relative abundance of B and plasma cells by clonality in each paired single-cell RNA sequencing (scRNA-seq) and single-cell B cell receptor sequencing (scBCR-seq) dataset, split by pathological response. UMAPs indicate the distribution of cells by clonality. c, Box plots illustrate the absolute number of clonotypes, the number of unique clonotypes, relative percent of unique clonotypes, and repertoire clonality (calculated as 1 minus normalized entropy [109]) of B and plasma cell clones according to patients with a pathological complete response (pCR) and pathological non-complete response (non-pCR) (n = 12). Data are presented as mean values +/- SEM, p-values are included in individual plots (two-sided Wilcoxon rank-sum test; statistical significance determined with p < 0.05). Each box extends from the 25th (Q1, lower bound of box) to the 75th (Q3, upper bound of box) percentile, the horizontal line in the center of the box represents the median value (Q2). The whiskers extend to the 5th (min, lower bound) and the 95th percentile (max, upper bound). Dots outside the whiskers indicate outliers. d, Bubble plot demonstrating the average expression of differentially expressed (DE) genes in B and plasma cell clones. Source data

Similar articles

Cited by

References

    1. Verkouteren, J. A. C., Ramdas, K. H. R., Wakkee, M. & Nijsten, T. Epidemiology of basal cell carcinoma: scholarly review. Br. J. Dermatol.177, 359–372 (2017). - PubMed
    1. Kappelin, J., Green, A. C., Ingvar, Å., Ahnlide, I. & Nielsen, K. Incidence and trends of basal cell carcinoma in Sweden: a population-based registry study. Br. J. Dermatol.186, 963–969 (2022). - PubMed
    1. Lomas, A., Leonardi-Bee, J. & Bath-Hextall, F. A systematic review of worldwide incidence of nonmelanoma skin cancer. Br. J. Dermatol.166, 1069–1080 (2012). - PubMed
    1. Schreuder, K., Hollestein, L., Nijsten, T. E. C., Wakkee, M. & Louwman, M. W. J. A nationwide study of the incidence and trends of first and multiple basal cell carcinomas in the Netherlands and prediction of future incidence. Br. J. Dermatol.186, 476–484 (2022). - PubMed
    1. El-Khalawany, M. et al. Epidemiological and clinicopathological analysis of basal cell carcinoma in Egyptian population: a 5-year retrospective multicenter study. J. Cancer Res. Clin. Oncol.49, 3121–3129 (2023). - PMC - PubMed

Publication types

MeSH terms

Substances

Associated data

LinkOut - more resources