. 2025 Feb;6(2):259-277.
doi: 10.1038/s43018-024-00899-7. Epub 2025 Jan 16.

First-in-class ultralong-target-residence-time p38α inhibitors as a mitosis-targeted therapy for colorectal cancer

Affiliations

First-in-class ultralong-target-residence-time p38α inhibitors as a mitosis-targeted therapy for colorectal cancer

Ramona Rudalska et al. Nat Cancer. 2025 Feb.

Abstract

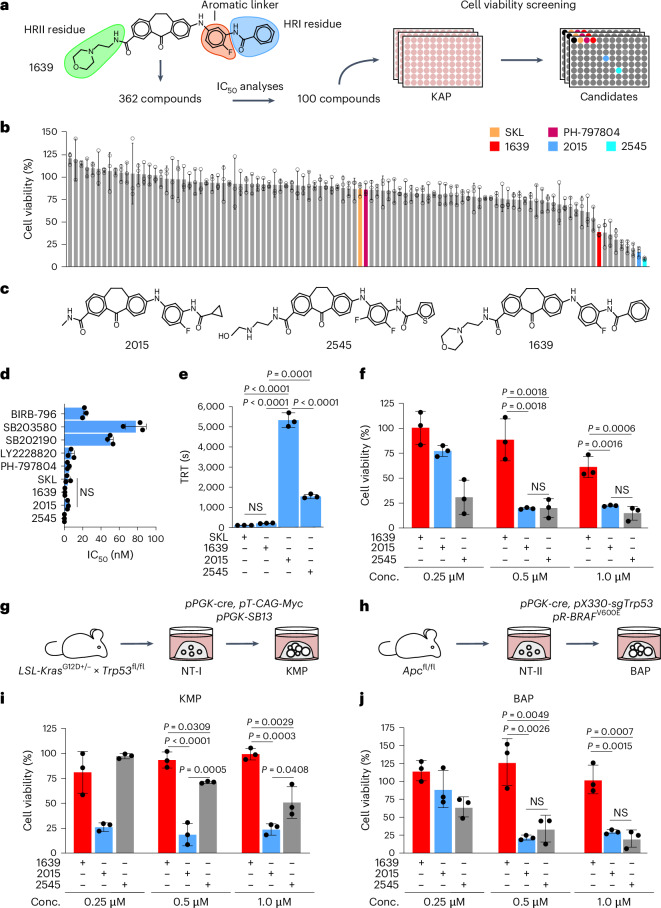
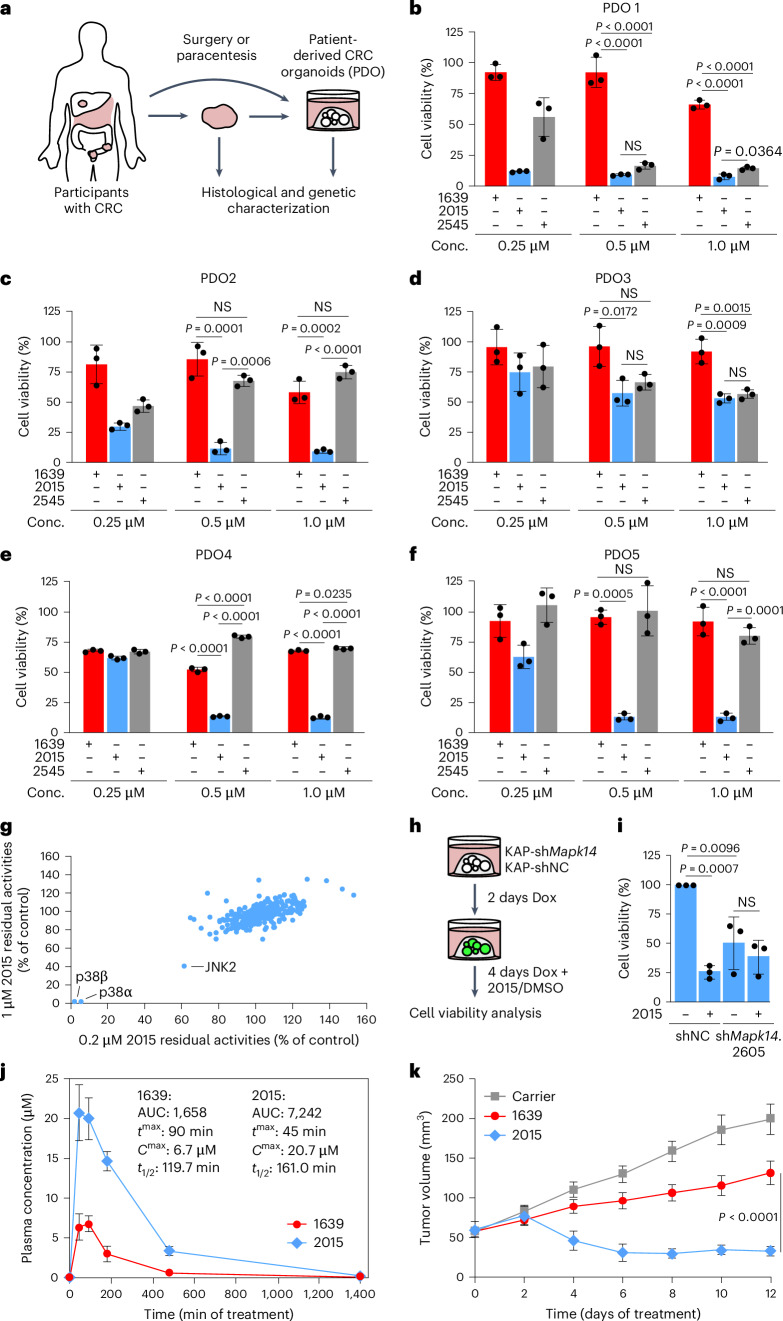
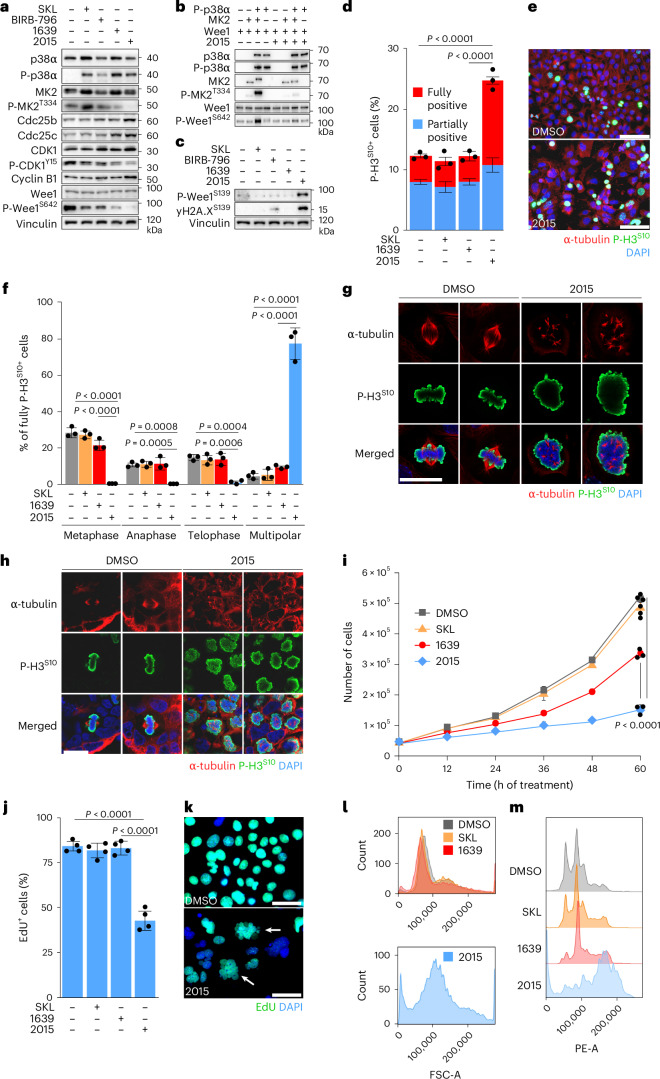
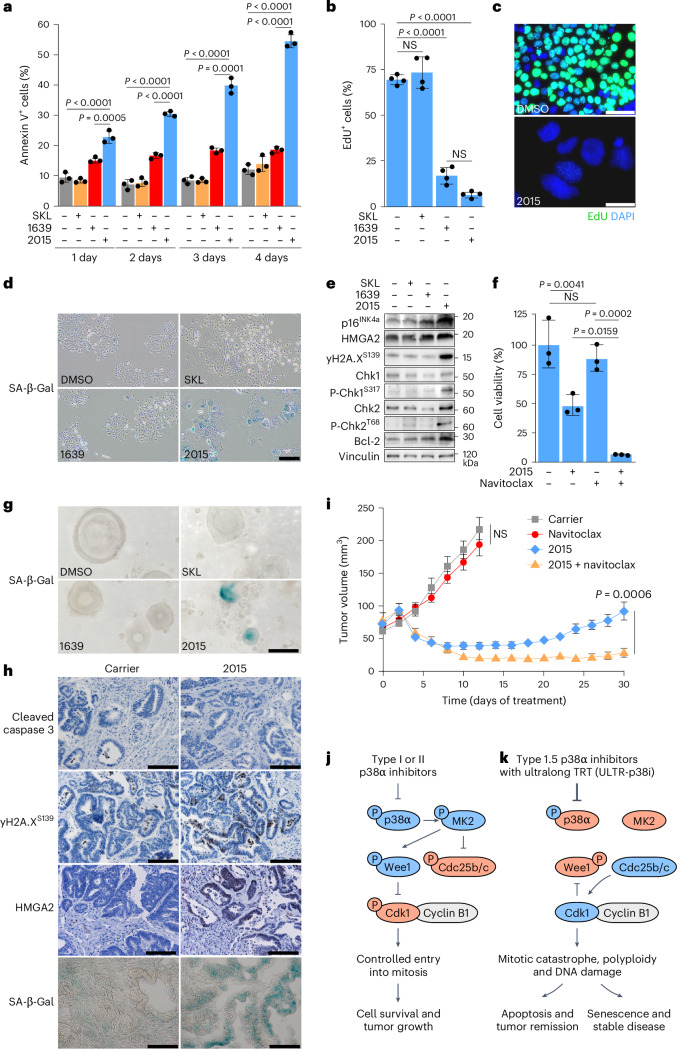
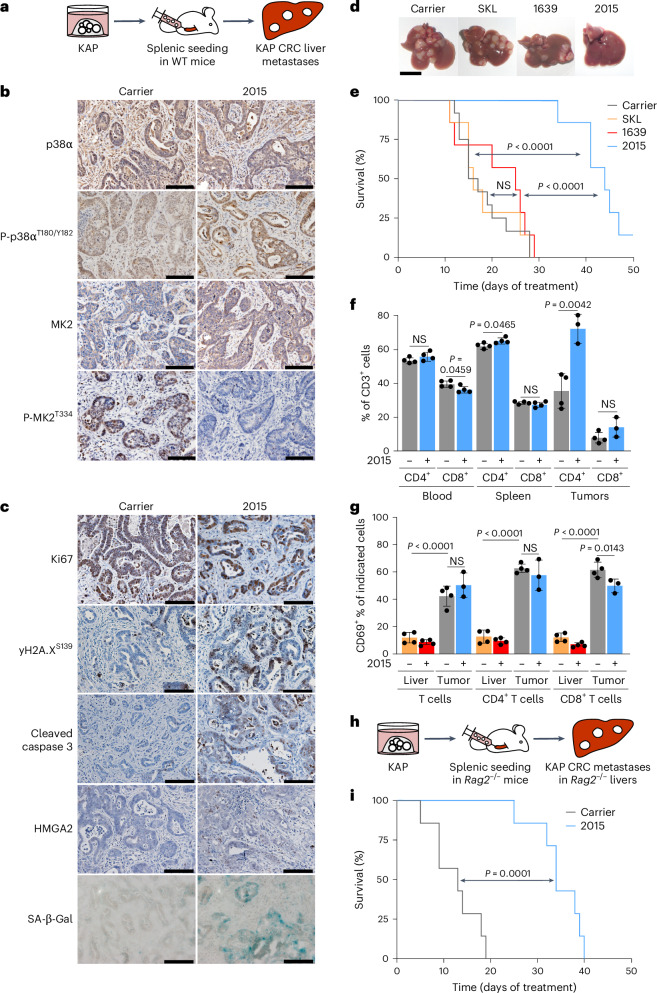
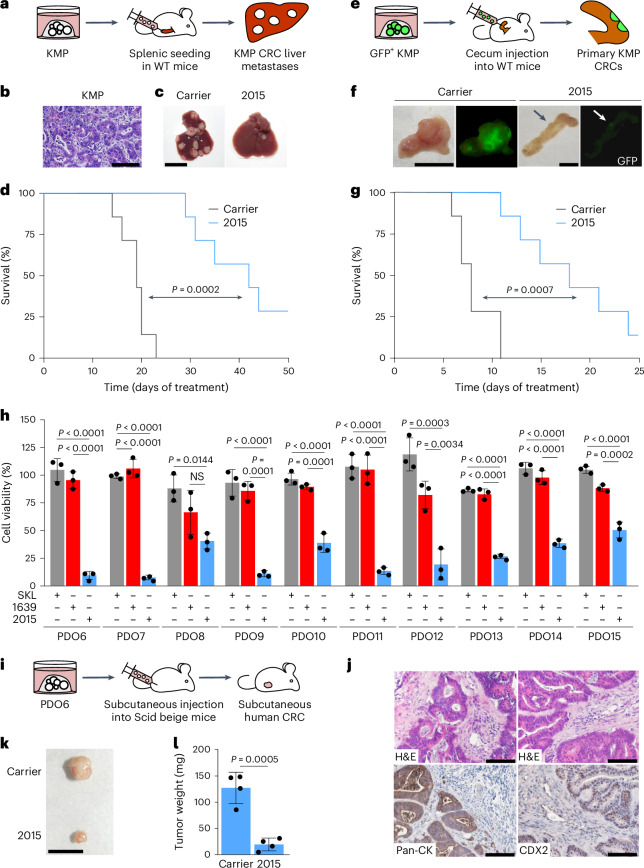
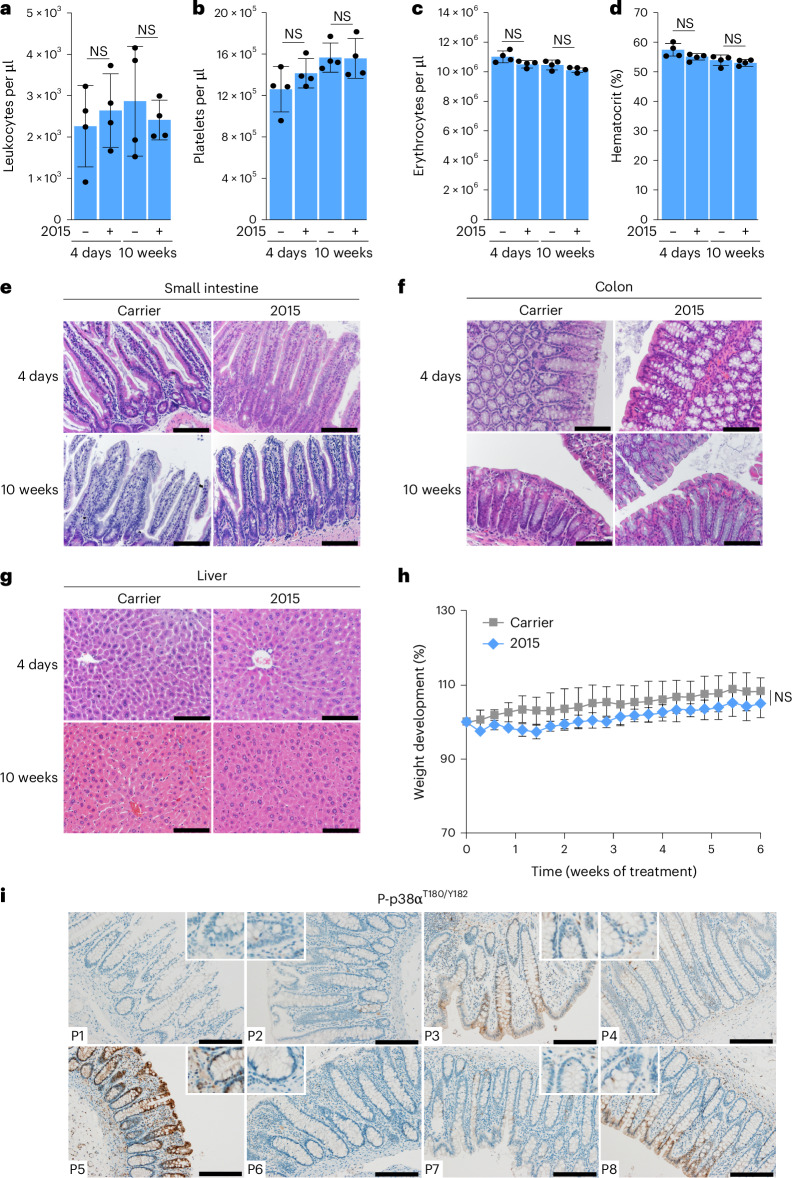
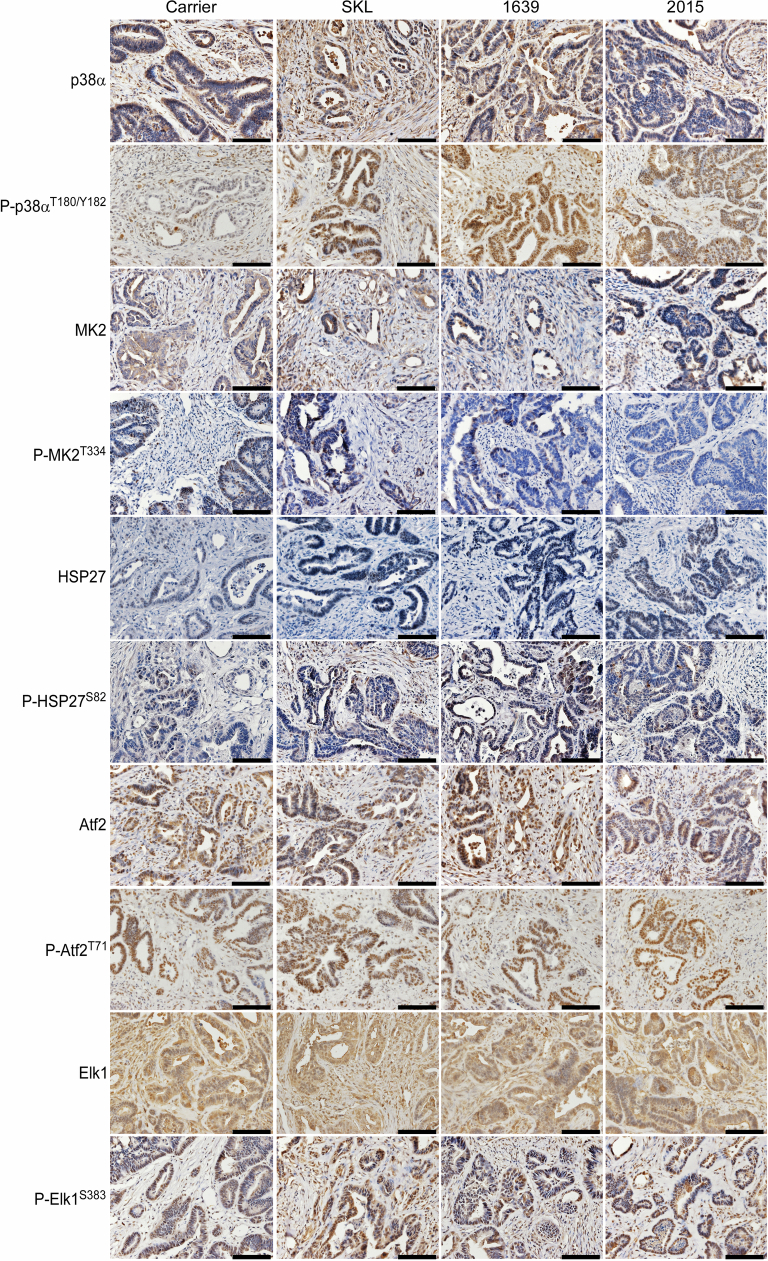
Colorectal cancer (CRC) constitutes the second leading cause of cancer-related death worldwide and advanced CRCs are resistant to targeted therapies, chemotherapies and immunotherapies. p38α (Mapk14) has been suggested as a therapeutic target in CRC; however, available p38α inhibitors only allow for insufficient target inhibition. Here we describe a unique class of p38α inhibitors with ultralong target residence times (designated ULTR-p38i) that robustly inhibit p38α downstream signaling and induce distinct biological phenotypes. ULTR-p38i monotherapy triggers an uncontrolled mitotic entry by activating Cdc25 and simultaneously blocking Wee1. Consequently, CRC cells undergo mitotic catastrophe, resulting in apoptosis or senescence. ULTR-p38i exhibit high selectivity, good pharmaco-kinetic properties and no measurable toxicity with strong therapeutic effects in patient-derived CRC organoids and syngeneic CRC mouse models. Conceptually, our study suggests ultralong-target-residence-time kinase inhibitors as an alternative to covalent inhibitors, which, because of the lack of cysteine residues, cannot be generated for many kinase cancer targets.


Conflict of interest statement

Competing interests: The authors declare no competing interests.

Figures

Fig. 1
Fig. 1. CRC organoids are resistant to type I but sensitive to type 1.5 p38α inhibitors.
a, Generation of KAP organoids expressing Mapk14 shRNAs. b, Knockdown test of Mapk14 shRNAs. Representative western blot analysis of p38α in KAP2D cells upon 6 days of treatment with doxycycline (Dox; cropped blot images, n = 3 biologically independent experiments). c, Cell viability analysis in KAP-shMapk14 and KAP-shNC organoids upon 12 days of treatment with doxycycline (n = 4 biologically independent experiments; data are presented as the mean ± s.d.). Statistical significance was calculated using an ANOVA and Dunnett’s multiple-comparisons test (P < 0.0001). d, Cell viability analysis in KAP organoids upon 4 days of treatment with SKL, PH-797804, LY2228820 or DMSO (n = 3 biologically independent experiments; data are presented as the mean ± s.d.). e, Representative western blot analysis of KAP2D cells upon 1 day of treatment with 5 µM SKL, PH-797804 or DMSO (cropped blot images; n = 3 biologically independent experiments). f, Schematic picture showing the binding of 1639 to HRI, HRII and R-spine of the p38α kinase. g, Cell viability analysis of KAP organoids upon 4 days of treatment with SKL, 1639 or DMSO (n = 3 biologically independent experiments; data are presented as the mean ± s.d.). Statistical significance was calculated using a two-tailed Student’s t-test (P < 0.0001). Conc., concentration. h, Generation of a CRC mouse model based on subcutaneous injection of KAP organoids into wild-type (WT) mice. i, Representative pictures of hematoxylin and eosin (H&E) and immunohistochemical staining for pan-CK and CDX2 in KAP subcutaneous tumors, 19 days after tumor initiation (n = 4 tumors per group). Scale bars, 100 µm. j, Treatment of subcutaneous KAP CRCs with SKL, 1639 or carrier (n = 10 tumors per group; data are presented as the mean ± s.e.m.). Statistical significance was calculated using an ANOVA and Dunnett’s multiple-comparisons test (P = 0.0192). NS, not significant. Treatment was started 1 week after organoid transplantation. The experiments in b, d, e and g were independently performed three times, the experiment in c was independently performed four times and the stainings in i were independently performed twice, all with similar results. Source data
Fig. 2
Fig. 2. Generation and screening of ULTR-p38i.
a, Generation of type 1.5 inhibitors and compound screen in KAP organoids. b, Cell viability analysis upon 4 days of treatment with the compound library or DMSO (compound concentration = 1 µM; n = 3 biologically independent experiments; data are presented as the mean ± s.d.). c, Chemical structures of 2015 and 2545 in comparison to 1639. d, Quantification of IC50 values of different p38α inhibitors on isolated protein (n = 3 independent ELISA assays; data are presented as the mean ± s.d.). Statistical significance was calculated using a two-tailed Student’s t-test. e, Quantification of TRTs of SKL, 1639, 2015 and 2545 (n = 3 independent TRT assays; data are presented as the mean ± s.d.). Statistical significance was calculated using an ANOVA and Tukey’s multiple-comparisons test (P ≤ 0.0001). f, Cell viability analysis in KAP organoids upon 4 days of treatment with 1639, 2015, 2545 or DMSO (n = 3 biologically independent experiments; data are presented as the mean ± s.d.). Statistical significance was calculated using an ANOVA and Tukey’s multiple-comparisons test (P < 0.005). g,h, Generation of KMP (g) and BAP (h) organoids. i, Cell viability analysis in KMP organoids upon 4 days of treatment with 1639, 2015, 2545 or DMSO (n = 3 biologically independent experiments; data are presented as the mean ± s.d.). Statistical significance was calculated using an ANOVA and Tukey’s multiple-comparisons test (P < 0.05). j, Cell viability analysis in BAP organoids upon 4 days of treatment with 1639, 2015, 2545 or DMSO (n = 3 biologically independent experiments; data are presented as the mean ± s.d.). Statistical significance was calculated using an ANOVA and Tukey’s multiple-comparisons test (P < 0.005). The experiments in b, df, i and j were independently performed three times, with similar results. Source data
Fig. 3
Fig. 3. ULTR-p38i are effective in human CRC organoids and CRC mouse models.
a, Generation of patient-derived CRC organoids from primary or secondary tumor tissue upon surgery or paracentesis. bf, Cell viability analysis in the patient-derived organoid cultures PDO1 (b), PDO2 (c), PDO3 (d), PDO4 (e) and PDO5 (f) upon 4 days of treatment with 1639, 2015, 2545 or DMSO (n = 3 biologically independent experiments; data are presented as the mean ± s.d.). Statistical significance was calculated using an ANOVA and Tukey’s multiple-comparisons test (P < 0.05). g, Selectivity profiling of 2015 in a panel of 340 kinases (Reaction Biology Europe, compound concentration = 1 µM and 0.2 µM). h,i, Experimental setup for treatment of KAP-shMapk14 and KAP-shNC organoids with 2015 or DMSO (h) and cell viability analysis (i) upon 6 days of treatment with doxycycline and 4 days of treatment with 2015 or DMSO (n = 3 biologically independent experiments; data are presented as the mean ± s.d.). Statistical significance was calculated using an ANOVA and Tukey’s multiple-comparisons test (P < 0.01). j, In vivo pharmacokinetic studies in mice treated with 2015 or 1639 (n = 3 mice per group; data are presented as the mean ± s.e.m.). k, Treatment of subcutaneous KAP tumors with 2015 in comparison to 1639 and carrier-treated tumors (Fig. 1j; n = 10 tumors per group; data are presented as the mean ± s.e.m.). Statistical significance was calculated using a two-tailed Student’s t-test (P < 0.0001). Treatment was started 1 week after organoid transplantation. The experiments in bf and i were independently performed three times, with similar results. Source data
Fig. 4
Fig. 4. ULTR-p38i manipulate the mitotic entry and induce mitotic catastrophe in CRC.
a, Representative western blot analysis in KAP2D cells upon 1 day of treatment with 1 µM SKL, BIRB-796, 1639, 2015 or DMSO (cropped blot images; n = 3 biologically independent experiments). b, Representative western blot analysis for p38α–Wee1 kinase assay (cropped blot images; n = 3 independent kinase assays). c, Representative western blot analysis in KAP2D cells upon 1 day of treatment with 1 µM SKL, BIRB-796, 1639, 2015 or DMSO (cropped blot images; n = 3 biologically independent experiments). df, Quantification (d), representative pictures (e) and determination of mitotic phases (f) of KAP2D cells stained for P-H3S10 and α-tubulin after 1 day of treatment with 1 µM, SKL, 1639, 2015 or DMSO (n = 3 cultures per condition; data are presented as the mean ± s.d.). Statistical significance was calculated using an ANOVA and Tukey’s multiple-comparisons test (P < 0.001). Scale bars, 100 µm. g,h, Representative confocal microscopy pictures of stained KAP2D (g) and PDO5 (h) after 1 day of treatment with 1 µM 2015 or DMSO (n = 3 cultures per condition). Scale bars, 15 µm. i, Quantification of viable KAP2D upon treatment with 1 µM SKL, 1639, 2015 or DMSO (n = 3 cultures per condition; data are presented as the mean ± s.d.). Statistical significance was calculated using an ANOVA and Tukey’s multiple-comparisons test (P < 0.0001). j,k, Quantification (j) and representative pictures (k) of EdU-labeled KAP2D after 2 days of treatment with 1 µM SKL, 1639, 2015 or DMSO (n = 4 cultures per condition; values represent the mean ± s.d.). Statistical significance was calculated using an ANOVA and Tukey’s multiple-comparisons test (P < 0.0001). Scale bars, 50 µm. l, Representative size analysis of KAP2D upon 2 days of treatment with 1 µM SKL, 1639, 2015 or DMSO (measurements without gating; n = 3 cultures per condition). m, Representative DNA content analysis in KAP2D upon 1 day of treatment with 1 µM SKL, 1639, 2015 or DMSO (gating strategy in Extended Data Fig. 6c; n = 3 cultures per condition). The experiments in ac were independently performed three times and the experiments in dm were independently performed twice, all with similar results. Source data
Fig. 5
Fig. 5. ULTR-p38i induce apoptosis and cellular senescence in CRC.
a, Annexin V+ KAP2D treated with SKL, 1639, 2015 or DMSO (gating strategy in Extended Data Fig. 6d; n = 3 cultures per condition; data are presented as the mean ± s.d.). Statistical significance was calculated using an ANOVA and Tukey’s multiple-comparisons test (P ≤ 0.0005). b,c, Quantification (b) and representative pictures (c) of EdU-labeled KAP2D after 5 days of treatment with 1 µM SKL, 1639, 2015 or DMSO (n = 4 cultures per condition; data are presented as the mean ± s.d.). Statistical significance was calculated using an ANOVA and Tukey’s multiple-comparisons test (P < 0.0001). Scale bars, 50 µm. d, Representative pictures of KAP2D stained for SA-β-Gal activity after 5 days of treatment with 1 µM SKL, 1639, 2015 or DMSO (n = 3 cultures per condition). Scale bar, 100 µm. e, Representative western blot analysis in KAP2D upon 5 days of treatment with 1 µM SKL, 1639, 2015 or DMSO (cropped blot images; n = 3 biologically independent experiments). f, Viability of KAP organoids upon 5 days of treatment with DMSO, 0.3 µM 2015, 0.5 µM navitoclax or their combination (n = 3 biologically independent experiments; data are presented as the mean ± s.d.). Statistical significance was calculated using an ANOVA and Tukey’s multiple-comparisons test (P < 0.05). g, Representative pictures of PDO3 stained for SA-β-Gal activity after 5 days of treatment with 1 µM SKL, 1639, 2015 or DMSO (n = 3 cultures per condition). Scale bar, 50 µm. h, Representative pictures of stained KAP subcutaneous tumors after 12 days of treatment with 2015 or carrier (n = 4 tumors per group). Scale bars, 100 µm. i, Treatment of subcutaneous KAP tumors with 2015, navitoclax or their combination (n = 10 tumors per group; data are presented as the mean ± s.e.m.). Statistical significance was calculated using a two-tailed Student’s t-test (P = 0.0006). Treatment was started 1 week after organoid transplantation. j,k, Schematics of type I or II p38α inhibitor’s (j) or ULTR-p38i’s (k) mode of action. Blue, activated proteins; red, inactivated proteins. The experiments in e and f were independently performed three times, and the experiments in ad and g and the stainings in h were independently performed twice, all with similar results. Source data
Fig. 6
Fig. 6. The ULTR-p38i 2015 inhibits CRC liver metastases.
a, Generation of an organoid-based CRC liver metastasis mouse model by splenic injection of KAP organoids into WT mice. b, Representative pictures of KAP metastases stained for p38α, P-p38αT180/Y182, MK2 and P-MK2T334 after 4 days of treatment with 2015 or carrier (n = 4 mice per group). Scale bars, 100 µm. c, Representative pictures of KAP metastases stained for Ki67, yH2A.XS139, cleaved caspase 3, HMGA2 and SA-β-Gal activity after 4 days of treatment with 2015 or carrier (n = 4 mice per group). Scale bars, 100 µm. d,e, Representative pictures of livers (d) and survival analysis of mice (e) with KAP liver metastasis that were treated with 2015, 1639, SKL or carrier (Kaplan–Meier curve; n = 7 (p38α inhibitor groups) or n = 12 (carrier) mice). Statistical significance was calculated using a log-rank test (P < 0.0001). Treatment was started 5 weeks after organoid transplantation. Scale bar, 1 cm. f, Quantification of CD4+ and CD8+ T cells in the CD3+ cell fraction in blood, spleen and tumors of mice with KAP metastases upon 4 days of treatment with 2015 or carrier (determined by FACS measurements; gating strategy in Extended Data Fig. 8a; n = 4 (tissues) or n = 3 (2015-treated tumors); data are presented as the mean ± s.d.). Statistical significance was calculated using a two-tailed Student’s t-test (P < 0.05). g, Quantification of CD69+ cells in tumor-free livers or KAP tumors of mice upon 4 days of treatment with 2015 or carrier (determined by FACS measurements; gating strategy in Extended Data Fig. 8a; n = 4 (tissues) or n = 3 (2015-treated tumors); data are presented as the mean ± s.d.). Statistical significance was calculated using an ANOVA and Tukey’s multiple-comparisons test (P < 0.05). h, Generation of a KAP liver metastasis model in Rag2−/− mice. i, Survival analysis of Rag2−/− mice with KAP liver metastasis that were treated with 2015 or carrier (Kaplan–Meier curve; n = 7 mice). Statistical significance was calculated using a log-rank test (P = 0.0001). The stainings in b and c were independently performed twice, with similar results. Source data
Fig. 7
Fig. 7. The ULTR-p38i 2015 shows strong activity in different CRC models.
a, Generation of an KMP CRC liver metastasis mouse model. b, Representative picture of H&E-stained KMP metastases 27 days after tumor initiation (n = 4 mice). Scale bar, 100 µm. c,d, Representative pictures of livers (c) and survival analysis of mice (d) with KMP liver metastasis that were treated with 2015 or carrier (Kaplan–Meier curve; n = 7 mice per group). Statistical significance was calculated using a log-rank test (P = 0.0002). Treatment was started 1 week after organoid transplantation. Scale bar, 1 cm. e, Generation of an organoid-based primary CRC mouse model by injecting KMP organoids into the cecum wall of WT mice. f,g, Representative pictures of the cecum inside (f) and survival analysis of mice (g) with KMP primary CRCs that were treated with 2015 or carrier (Kaplan–Meier curve; n = 7 mice per group). Statistical significance was calculated using a log-rank test (P = 0.0007). Treatment was started 9 days after organoid transplantation. Scale bars, 1 cm. h, Cell viability analysis in the patient-derived organoid cultures PDO6–PDO15 upon 4 days of treatment with 1 µM SKL, 1639, 2015 or DMSO (n = 3 biologically independent experiments; data are presented as the mean ± s.d.). Statistical significance was calculated using an ANOVA and Tukey’s multiple-comparisons test (P < 0.05). i, Generation of a human CRC mouse model based on subcutaneous injection of PDO6 into CB17 Scid beige mice. j, Representative pictures of H&E and immunohistochemical staining for pan-CK and CDX2 in subcutaneous PDO6 CRC 14 weeks after tumor initiation (n = 4 tumors per group). Scale bars, 100 µm. k,l, Representative pictures (k) and weight (l) of subcutaneous human PDO6 CRCs that were treated with 2015 or carrier (n = 4 tumors per group; data are presented as the mean ± s.d.). Statistical significance was calculated using a two-tailed Student’s t-test (P = 0.0005). Treatment was started 10 weeks after organoid transplantation. Scale bar, 1 cm. The experiments in h were independently performed three times and the stainings in b and j were independently performed twice, all with similar results. Source data
Fig. 8
Fig. 8. The ULTR-p38i 2015 is well tolerated by mice.
ad, Quantification of leukocytes (a), platelets (b), erythrocytes (c) and the hematocrit (d) in mice treated for 4 days or 10 weeks with 2015 or carrier (n = 4 mice per group; data are presented as the mean ± s.d.). Statistical significance was calculated using a two-tailed Student’s t-test. e,f, Representative pictures of H&E-stained small intestine (e) and colon (f) of mice treated for 4 days or 10 weeks with 2015 or carrier (n = 4 mice per group). Scale bars, 100 µm. g, Representative pictures of H&E-stained liver tissue in mice treated for 4 days or 10 weeks with 2015 or carrier (n = 4 mice per group). Scale bars, 100 µm. h, Weight development of mice treated with 2015 or carrier (n = 7 mice per group; data are presented as the mean ± s.d.). Statistical significance was calculated using a two-tailed Student’s t-test. i, Representative pictures of colon tissue of participants (n = 8) stained for P-p38αT180/Y182. Scale bars, 200 µm. The stainings in eg and i were independently performed twice, with similar results. Source data
Extended Data Fig. 1
Extended Data Fig. 1. Generation and treatment of CRC cultures.
a, Representative pictures of NT-I colonoids after 0, 1 and 5 d of isolation. Scale bar, 100 µm. b, Representative pictures of NT-I colonoids stained for CK20 and CDX2 (n = 2 biologically independent experiments). Scale bars, 100 µm. c, Representative pictures of NT-I and KAP organoids upon withdrawal of R-Spondin-1 (RSPO), Wnt and EGF. Scale bar, 100 µm. d, Representative PCR analysis of cre recombinase-mediated modifications of Trp53 in KAP organoids (in comparison to NT-I, n = 2 biologically independent experiments). 370 bp = floxed (fl), 612 bp = recombined (rb) allele. e, Representative PCR analysis of cre-mediated modifications of LSL-KrasG12D in KAP organoids (in comparison to NT-I, n = 2 biologically independent experiments). 500 bp = floxed (fl), 622 bp = WT and 650 bp = recombined (rb) allele. f, Representative western blot analysis of Apc in NT-I and KAP organoids (cropped blot images, n = 3 biologically independent experiments). g, Representative pictures of KAP organoids stained for CK20 and CDX2 (n = 2 biologically independent experiments). Scale bars, 50 µm. h, Representative pictures of KAP2D cells stained for CK20 and CDX2 (n = 2 biologically independent experiments). Scale bars, 100 µm. i, Schematic outline of medium exchange experiment in KAP2D. j, Representative western blot analysis in KAP2D donor- and KAP2D- recipient cells (cropped blot images, n = 3 biologically independent experiments). k, Cell viability analysis in KAP organoids upon 4 d of treatment with BIRB-796 or DMSO (n = 3 biologically independent experiments, data are presented as mean values +/- SD). l, Representative western blot analysis of p38α, P-p38αT180/Y182, MK2 and P-MK2T334 in KAP2D upon 1 d of treatment with 5 µM SKL, BIRB-796 or DMSO (cropped blot images, n = 3 biologically independent experiments). m, Representative western blot analysis of p38α, P-p38αT180/Y182, MK2 and P-MK2T334 in KAP2D cells upon 1 d of treatment with 1 µM SKL, 1639 or DMSO (cropped blot images, n = 3 biologically independent experiments). The experiments in Extended Data Fig. 1b, d, e, g, h were independently performed twice and the experiments in Extended Data Fig. 1f, j, k, l, m were independently performed three times, all with similar results. Source data
Extended Data Fig. 2
Extended Data Fig. 2. Analyzing an ULTRi-p38i therapy in CRC organoids.
Representative pictures of KAP organoids stained for p38α, P-p38αT180/Y182, MK2 and P-MK2T334 after 1 d of treatment with 1 µM SKL, 1639, 2015, 2545 or DMSO (n = 3 cultures per condition). Scale bar, 50 µm. The experiments were independently performed twice with similar results.
Extended Data Fig. 3
Extended Data Fig. 3. Generation of Myc- and BRAFV600E-driven, murine CRC organoids.
a, Representative pictures of KMP organoids stained for CK20 and CDX2 (n = 2 biologically independent experiments). Scale bars, 100 µm. b, Representative western blot analysis in NT-I and KMP organoids (cropped blot images, n = 3 biologically independent experiments). c, Representative pictures of BAP organoids stained for CK20 and CDX2 (n = 2 biologically independent experiments). Scale bars, 100 µm. d, Representative western blot analysis in NT-II and BAP organoids (cropped blot images, n = 3 biologically independent experiments). e, Representative pictures of KMP organoids stained for p38α, P-p38αT180/Y182, MK2 and P-MK2T334 after 1 d of treatment with 1 µM SKL, 1639, 2015, 2545 or DMSO (n = 3 cultures per condition). Scale bar, 50 µm. The experiments in Extended Data Fig. 3a, c, e were independently performed twice and the experiments in Extended Data Fig. 3b, d were independently performed three times, all with similar results.
Extended Data Fig. 4
Extended Data Fig. 4. Characterization of patient-derived CRC organoids.
a, Representative pictures of H + E and immunohistochemical staining for Pan-CK and CDX2 in human CRC tissues that were used for culture generation (PDO1-4) (n = 2 biologically independent experiments). Scale bars, 100 µm. b, Representative pictures of patient-derived CRC organoid cultures (PDO1-5) stained for CK20 and CDX2 (n = 2 biologically independent experiments). Scale bars, 100 µm. c, Panel sequencing of patient-derived CRC organoids (PDO1-5). Shown are INDELS (inframe, frameshift, stop gained), SNVs (missense, stop gained) and CNVs for selected, CRC related genes. For all data, see Supplementary Tables 4–13. The experiments in Extended Data Fig. 4a, b were independently performed twice with similar results.
Extended Data Fig. 5
Extended Data Fig. 5. Analyzing p38α-MK2 signaling in subcutaneous CRCs upon treatment with p38i.
Representative pictures of KAP subcutaneous tumors stained for p38α, P-p38αT180/Y182, MK2, P-MK2T334, HSP27, P-HSP27S82, Atf2, P-Atf2T71, Elk1, P-Elk1S383 after 12 d of treatment with SKL, 1639, 2015 or carrier (n = 4 tumors per group). Scale bars, 100 µm. The stainings were independently performed twice with similar results.
Extended Data Fig. 6
Extended Data Fig. 6. Analyzing mitotic catastrophe, DNA content, apoptosis and senescence in CRC.
a, Representative confocal microscopy pictures of KAP organoids stained for P-H3S10 and α-Tubulin after 1 d of treatment with 1 µM 2015 or DMSO (n = 3 cultures per condition). Scale bar, 15 µm. b, Representative confocal microscopy pictures of KAP-shMapk14.2605 or KAP-shNC organoids stained for P-H3S10 and α-Tubulin after 6 d of treatment with doxycycline (n = 3 cultures per condition). Scale bar, 15 µm. c, Representative pictures of the gating strategy for FACS-based DNA content analysis in KAP2D cells (see Fig. 4m, n = 3 cultures per condition). d, Representative pictures of the gating strategy for FACS-based quantification of Annexin V+ KAP2D cells (see Fig. 5a, n = 3 cultures per condition). e,f, Representative pictures of PDO4 (e) and PDO5 (f) organoids stained for SA-β-Gal activity after 5 d of treatment with 1 µM SKL, 1639, 2015 or DMSO (n = 3 cultures per condition). Scale bars, 100 µm. g, Representative pictures of KAP subcutaneous tumors (see Fig. 3k) stained for SA-β-Gal activity and p16INK4a after 12 d of treatment with 2015 or carrier (n = 4 tumors per group). Scale bars, 100 µm. The experiments in Extended Data Fig. 6a, b, c, d, e, f and the stainings in Extended Data Fig. 6g were independently performed twice, all with similar results.
Extended Data Fig. 7
Extended Data Fig. 7. Generation and treatment of an organoid-based CRC liver metastasis mouse model.
a, Representative pictures of liver, H + E and immunohistochemical staining for Pan-CK and CDX2 on hepatic KAP metastases (n = 4 mice). Scale bars, 1 cm (macroscopic picture) or 100 µm (microscopic pictures). b, Representative H + E stained pictures of KAP metastases after 4 d of treatment with 2015 or carrier (n = 4 mice per group). Scale bars, 100 µm. c, Representative pictures of KAP metastases stained for HSP27, P-HSP27S82, Atf2, P-Atf2T71, Elk1, P-Elk1S383 after 4 d of treatment with 2015 or carrier (n = 4 mice per group). Scale bars, 100 µm. The stainings in Extended Data Fig. 7a, b, c were independently performed twice with similar results.
Extended Data Fig. 8
Extended Data Fig. 8. Analyzing immune cells in ULTR-p38i-treated mice.
a, Representative pictures of the gating strategy for FACS-based quantification of immune cells (for Fig. 6f, g and Extended Data Fig. 8b, n = 4 tissues). b, Quantification of T cells, CD4+ T cells, CD8+ T cells, NK cells, B cells, monocytes, granulocytes and dendritic cells in the spleen of mice with or without KAP metastases upon 4 d of treatment with 2015 or carrier (determined by FACS measurements, gating strategy is depicted in Extended Data Fig. 8a, n = 4 tissues, data are presented as mean values +/- SD, statistical significance was calculated using two-tailed Student´s t-test, P < 0.05). Source data
Extended Data Fig. 9
Extended Data Fig. 9. Generation of Myc-driven CRC mouse models and treatment of human CRC cultures.
a, Representative pictures of hepatic KMP metastases and H + E and immunohistochemical staining for Pan-CK and CDX2 on tumor tissue (n = 4 mice). Scale bars, 1 cm (macroscopic picture) or 100 µm (microscopic pictures). b, Representative pictures of KMP primary tumors in the caecum and KMP liver and lung metastases (with GFP imaging of tumors) and H + E and immunohistochemical staining for Pan-CK and CDX2 on tumor tissues (n = 4 mice). Scale bars, 1 cm (macroscopic pictures) or 100 µm (microscopic pictures). c-h, Cell viability analysis in the human CRC cell lines HCT-15 (c), HCT 116 (d), COLO 205 (e), LS 174 T (f), RKO (g) and HT-29 (h) upon 4 d of treatment with SKL, 1639, 2015 or DMSO (drug response curves and IC50 values, data are presented as mean values +/- SD, n = 3 cultures per condition). i, Cell viability analysis in the patient-derived organoid cultures PDO6 – PDO15 upon 4 d of treatment with 0.5 µM of SKL, 1639, 2015 or DMSO (n = 3 biologically independent experiments, data are presented as mean values +/- SD, statistical significance was calculated using an ANOVA and Tukey’s multiple comparisons test, P < 0.05). The experiments in Extended Data Fig. 9c–h and the stainings in Extended Data Fig. 9a, b were independently performed twice, the experiments in Extended Data Fig. 9i were independently performed three times, all with similar results. Source data
Extended Data Fig. 10
Extended Data Fig. 10. Analyzing the effect of ULTR-p38i on healthy tissues in mice.
a, Hemoglobin concentration in mice treated for 4 d or 10w with 2015 or carrier (n = 4 mice per group, data are presented as mean values +/- SD, statistical significance was calculated using an ANOVA and Tukey’s multiple comparisons test, P = 0.0034). b-d, Determination of the mean corpuscular volume (MCV, b), the mean corpuscular hemoglobin (MCH, c) and the mean corpuscular haemoglobin concentration (MCHC, d) in mice treated for 4 d or 10w with 2015 or carrier (n = 4 mice per group, data are presented as mean values +/- SD, statistical significance was calculated using an ANOVA and Tukey’s multiple comparisons test, P < 0.005). e, Representative pictures of p38α stained colon tissue of patients (n = 8 patients). Scale bars, 200 µm. f,g, Cell viability analysis in SCC311 (f) and SCC321 (g) human colon organoids upon 4 d of treatment with 2015 or DMSO (n = 3 biologically independent experiments, data are presented as mean values +/- SD). The experiments in Extended Data Fig. 10f, g were independently performed three times and the stainings in Extended Data Fig. 10e were independently performed twice, all with similar results. Source data

References

    1. Bedard, P. L., Hyman, D. M., Davids, M. S. & Siu, L. L. Small molecules, big impact: 20 years of targeted therapy in oncology. Lancet395, 1078–1088 (2020). - PubMed
    1. Zhong, L. et al. Small molecules in targeted cancer therapy: advances, challenges, and future perspectives. Signal. Transduct. Target Ther.6, 201 (2021). - PMC - PubMed
    1. Bray, F. et al. Global cancer statistics 2022: GLOBOCAN estimates of incidence and mortality worldwide for 36 cancers in 185 countries. CA Cancer J. Clin.74, 229–263 (2024). - PubMed
    1. Dekker, E., Tanis, P. J., Vleugels, J. L. A., Kasi, P. M. & Wallace, M. B. Colorectal cancer. Lancet394, 1467–1480 (2019). - PubMed
    1. Xie, Y. H., Chen, Y. X. & Fang, J. Y. Comprehensive review of targeted therapy for colorectal cancer. Signal. Transduct. Target Ther.5, 22 (2020). - PMC - PubMed

MeSH terms