. 2025 Jan 16;16(1):732.
doi: 10.1038/s41467-025-56092-6.

Incomplete remyelination via therapeutically enhanced oligodendrogenesis is sufficient to recover visual cortical function

Affiliations

Incomplete remyelination via therapeutically enhanced oligodendrogenesis is sufficient to recover visual cortical function

Gustavo Della-Flora Nunes et al. Nat Commun. .

Abstract

Myelin loss induces neural dysfunction and contributes to the pathophysiology of neurodegenerative diseases, injury conditions, and aging. Because remyelination is often incomplete, better understanding endogenous remyelination and developing remyelination therapies that restore neural function are clinical imperatives. Here, we use in vivo two-photon microscopy and electrophysiology to study the dynamics of endogenous and therapeutic-induced cortical remyelination and functional recovery after cuprizone-mediated demyelination in mice. We focus on the visual pathway, which is uniquely positioned to provide insights into structure-function relationships during de/remyelination. We show endogenous remyelination is driven by recent oligodendrocyte loss and is highly efficacious following mild demyelination, but fails to restore the oligodendrocyte population when high rates of oligodendrocyte loss occur quickly. Testing a thyromimetic (LL-341070) compared to clemastine, we find it better enhances oligodendrocyte gain and hastens recovery of neuronal function. The therapeutic benefit of the thyromimetic is temporally restricted, and it acts exclusively following moderate to severe demyelination, eliminating the endogenous remyelination deficit. However, we find regeneration of oligodendrocytes and myelin to healthy levels is not necessary for recovery of visual neuronal function. These findings advance our understanding of remyelination and its impact on functional recovery to inform future therapeutic strategies.


Conflict of interest statement

Competing interests: M.B.W., D.A.M., A.A., A.D., J.A.V., and R.G. were employees of Autobahn Therapeutics and hold equity interests in the company. J.A.V. remains an employee of Autobahn Therapeutics. Autobahn Therapeutics developed LL-341070 and provided LL-341070 for experiments. In vitro data and rat gene expression data (Supplementary Fig. 6) were provided by Autobahn Therapeutics. This project was funded in part by a Sponsored Research Agreement between Autobahn Therapeutics and E.G.H. and D.J.D.; academic freedom was maintained in designing and analyzing experiments and in writing the manuscript. All other authors have no other current or past financial involvements with Autobahn Therapeutics, or other competing interests to declare.

Figures
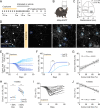
Fig. 1
Fig. 1. Endogenous remyelination fails to restore the oligodendrocyte population after moderate or severe demyelination.
A Experimental timeline. Untreated and vehicle-treated mice were used to study endogenous remyelination. B Mobp-EGFP mice underwent longitudinal in vivo two-photon imaging of OLs in V1. C Cranial window placement above V1. D Representative images of V1 OLs in one mouse at baseline (-3.5 weeks), end of cuprizone (0 weeks), and during remyelination (1.5 and 7 weeks). Lost OLs (dark blue) and new OLs (light blue) are encircled. E Cumulative OL loss and gain (as a percentage of baseline OLs) in individual mice over time (n = 15). F Three parameter Gompertz growth curve (95% CI) fit to group cumulative OL loss and gain shown for visualization. Statistical comparisons performed on parameters derived from three parameter growth curves fit to individual mice (Supplementary Fig. 4A, B). Maximum growth rate occurred earlier for loss than gain. Gain asymptote is lower than loss asymptote. G Cumulative OL gain and cumulative OL loss are tightly correlated at 7 weeks. H At <50% OL loss, mice make as many new OLs as they lose by 7 weeks. At ≥50% OL loss, mice make fewer new OLs than they lose. I OL number (as a percentage of baseline OLs) in individual mice over time (n = 15). Dashed line at 100%. J OL number and cumulative OL loss are tightly correlated at 7 weeks. Dashed line at 100%. In (F), Max. growth rate: paired t test (t(14) = 10.12, ***p < 0.0001, n = 15). Asymptote: paired t test (t(14) = 3.64, **p = 0.0027, n = 15). In (G), linear regression (F(1, 8) = 23.79, n = 10). In (H) < 50% loss, paired t test (t(3) = 1.87, p = 0.16, n = 4). In H ≥ 50% loss, paired t test (t(5) = 5.40, **p = 0.0029, n = 6). In (J), linear regression (F(1, 8) = 33.06, n = 10). n.s. not significant, **p < 0.01, ***p < 0.001; line of best fit ± 95% CI in (G, J); n=mice; two-sided statistical tests. See Supplementary Data 1 for statistical details and Source Data file for source data. OL = oligodendrocyte, V1 = primary visual cortex.
Fig. 2
Fig. 2. Endogenous remyelination is driven by recent oligodendrocyte loss.
A, C, E OL gain rate (as a percentage of baseline OLs per day) at 14 days is weakly correlated with OL number (as a percentage of baseline OLs) at 7 days (A), correlated with cumulative OL loss (as a percentage of baseline OLs) at 7 days (C), and strongly correlated with OL loss rate (as a percentage of baseline OLs per day) at 7 days (E). B, D, F OL gain rate at 7, 14, 21, or 28 days does not correlate well with OL number at −14, −11, −7, 0, 4, 7, 11, 14, or 18 days (B), correlates well with cumulative OL loss at several days during remyelination (D), and correlates best with OL loss rate approximately 7 days prior (F). Dot size represents R2 magnitude. R2 value is indicated for the strongest significant correlation. Dark blue dots signify significant correlations (linear regression, n = 15) given Bonferroni correction for multiple comparisons, p < 0.05/10 = 0.005 (B) or p < 0.05/13 = 0.0038 (D, F). G OL gain rate at 7, 14, 21, and 28 days is best predicted by OL loss rate 4, 7, 7, and 7 days prior, respectively. H Plot of strongest correlations from (F): OL gain rate at 7, 14, 21, and 28 days vs. OL loss rate at 4, 7, 14, and 21 days, respectively (black, light blue, dark blue, yellow, respectively). Dashed line of equality. In (A), linear regression (F(1, 13) = 5.22, n = 15). In (C), linear regression (F(1, 13) = 14.24, n = 15). In (E), linear regression (F(1, 13) = 37.20, n = 15). Line of best fit ± 95% CI in (A, C, E); n=mice. See Supplementary Data 1 for statistical details and Source Data file for source data. OL = oligodendrocyte.
Fig. 3
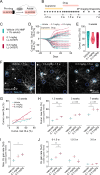
Fig. 3. Thyromimetic treatment enhances oligodendrocyte gain during remyelination.
A Hydrolysis of LL-341070 into its active form by CNS-enriched fatty acid amide hydrolase (FAAH). B Experimental timeline. C Treatment groups. D Cumulative OL loss and gain (as a percentage of baseline OLs) in individual mice over time (vehicle: n = 7, 0.1 mg/kg: n = 7, 0.3 mg/kg: n = 6). E Cumulative OL loss by 3 weeks does not differ between groups in mean or variance. F Representative images of V1 OLs at 1.5 weeks post-cuprizone. Locations of lost OLs (dark blue) and new OLs (light blue) are encircled. Additional timepoints in Supplementary Fig. 7. G ANCOVA with unequal slopes shows effect of treatment, cumulative OL loss, and interaction between cumulative OL loss and treatment on cumulative OL gain at 1.5 weeks. H High dose LL-341070 increases cumulative OL gain at 1.5 weeks. Low dose LL-341070 increases cumulative OL gain after 7 weeks. I High dose LL-341070 increases maximum OL gain rate (as a percentage of baseline OLs/day) during remyelination. J High dose LL-341070 increases OL gain rate (as a percentage of baseline OLs/day) only between 0 and 1.5 weeks. In (E), ANOVA (F(2, 14) = 0.29, p = 0.75). Brown-Forsythe (F(2, 14) = 1.05, p = 0.37). Vehicle: n = 7; 0.1 mg/kg: n = 7; 0.3 mg/kg: n = 6. In (G), ANCOVA with unequal slopes (F(5, 18) = 9.5, ***p = 0.0001). Effects: treatment (F = 7.91, **p = 0.0034), OL loss (F = 23.33, ***p = 0.0001), interaction (F = 6.41, **p = 0.0079). Vehicle: n = 8, 0.1 mg/kg: n = 9, 0.3 mg/kg: n = 7. In (H) 1.5w, Tukey’s HSD (0.3 mg/kg vs. vehicle: **p = 0.0025; 0.3 mg/kg vs. 0.1 mg/kg: *p = 0.049). Vehicle: n = 8, 0.1 mg/kg: n = 9, 0.3 mg/kg: n = 7. In (H) 3w, Tukey’s HSD (0.3 mg/kg vs. vehicle: p = 0.055). Vehicle: n = 7, 0.1 mg/kg: n = 7, 0.3 mg/kg: n = 6. In (H) 7w, Tukey’s HSD (0.3 mg/kg vs. vehicle, p = 0.051; 0.1 mg/kg vs. vehicle, *p = 0.034). Vehicle: n = 5, 0.1 mg/kg: n = 4, 0.3 mg/kg: n = 5. In (I), Tukey’s HSD (0.3 mg/kg vs. vehicle: *p = 0.018). Vehicle: n = 7, 0.1 mg/kg: n = 7, 0.3 mg/kg: n = 6. In (J) 0-1.5w, Tukey’s HSD (0.3 mg/kg vs. vehicle: **p = 0.0012; 0.3 mg/kg vs. 0.1 mg/kg: *p = 0.025). Vehicle: n = 8, 0.1 mg/kg: n = 9, 0.3 mg/kg: n = 7. In (J) 1.5-3w, ANCOVA with unequal slopes in Supplementary Fig. 8G not significant. Vehicle: n = 7; 0.1 mg/kg: n = 7; 0.3 mg/kg: n = 6. In (J) 3-5w, ANCOVA with unequal slopes in Supplementary Fig. 8H not significant. Vehicle: n = 6, 0.1 mg/kg: n = 4, 0.3 mg/kg: n = 5. *p < 0.05, **p < 0.01; least square mean ± SEM in (HJ); n=mice; two-sided statistical tests. See Supplementary Data 1 for statistical details and Source Data file for source data. OL=oligodendrocyte, V1=primary visual cortex.
Fig. 4
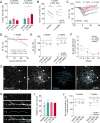
Fig. 4. Thyromimetic LL-341070 enhances oligodendrocyte gain to a greater extent after moderate or severe demyelination to restore oligodendrocytes and myelin.
A High dose LL-341070 increases cumulative OL gain only in mice with ≥50% cumulative OL loss (as a percentage of baseline OLs). B High dose LL-341070 rescues regeneration deficit after severe demyelination. C OL number (as a percentage of baseline OLs) in individual mice over time (vehicle: n = 7, 0.1 mg/kg: n = 7, 0.3 mg/kg: n = 6). Dashed line at 100%. D High dose LL-341070 eliminates correlation between OL number and cumulative OL loss at 7 weeks. Dashed line at 100%. E Low and high dose LL-341070 recover baseline but not healthy OL levels by 7 weeks. Vehicle does not recover baseline OL levels. F Oligodendrogenesis rate of remyelinating mice returns to that of healthy mice after 3 weeks. G Representative image of a new OL analyzed 7 days post-cuprizone and its traced sheaths (blue). H High magnification image of a single traced sheath (blue) from cell in (G). I No difference between groups in number of sheaths made by individual new oligodendrocytes. J LL-341070 recovers baseline myelin levels by 3 weeks of remyelination and achieves roughly healthy myelin levels by 7 weeks. See Methods for myelin level estimation protocol. In (A) < 50% loss, ANOVA (F(2, 9) = 2.80, p = 0.11). Vehicle: n = 3, 0.1 mg/kg: n = 5, 0.3 mg/kg: n = 4. In A ≥ 50% loss, ANOVA (F(2, 9) = 5.09, *p = 0.033). Tukey’s HSD (0.3 mg/kg vs. vehicle: *p = 0.032). Vehicle: n = 5, 0.1 mg/kg: n = 4, 0.3 mg/kg: n = 3. In (B) vehicle, paired t test (t(2) = 10.12, **p = 0.0096, n = 3). In (B) 0.3 mg/kg, paired t test (t(2) = 0.47, p = 0.69, n = 3). In (D) vehicle, linear regression (F(1, 3) = 13.4, n = 5). In (D) 0.1 mg/kg, linear regression (F(1, 2) = 25.53, n = 4). In (D) 0.3 mg/kg, linear regression (F(1, 3) = 0.0033, n = 5). In (E) 3w, ANOVA to compare to healthy (F(3, 19) = 18.33, ***p < 0.0001). Dunnett’s (vehicle vs. healthy: ***p = 0.0001; 0.1 mg/kg vs. healthy: ***p = 0.0001; 0.3 mg/kg vs. healthy: ***p = 0.0002). One-sample t tests to compare to baseline (vehicle vs. baseline: t(6) = 6.87, ***p = 0.0005; 0.1 mg/kg vs. baseline: t(6) = 3.55, *p = 0.012; 0.3 mg/kg vs. baseline: t(5) = 2.75, *p = 0.04). Vehicle: n = 7, 0.1 mg/kg: n = 7, 0.3 mg/kg: n = 6, healthy: n = 3. In (E) 7w, ANOVA to compare to healthy (F(3, 13) = 14.96, ***p = 0.0002). Dunnett’s (vehicle vs. healthy: ***p < 0.0001; 0.1 mg/kg vs. healthy: **p = 0.0073; 0.3 mg/kg vs. healthy: **p = 0.0025). One-sample t tests to compare to baseline (vehicle vs. baseline: t(4) = 2.99, *p = 0.04; 0.1 mg/kg vs. baseline: t(3) = 1.52, p = 0.22; 0.3 mg/kg vs. baseline: t(4) = 1.04, p = 0.36). Vehicle: n = 5, 0.1 mg/kg: n = 4, 0.3 mg/kg: n = 5, healthy: n = 3. In (F) 0-1.5w, ANOVA (F(3, 24) = 16.81, ***p < 0.0001). Dunnett’s (vehicle vs. healthy: *p = 0.011; 0.1 mg/kg vs. healthy: ***p = 0.0004; 0.3 mg/kg vs healthy: ***p = 0.0001). Vehicle: n = 8, 0.1 mg/kg: n = 9, 0.3 mg/kg: n = 7, healthy: n = 4. In (F) 1.5-3w, ANOVA (F(3, 19) = 3.95, *p = 0.024). Dunnett’s (vehicle vs. healthy: p = 0.39; 0.1 mg/kg vs. healthy: *p = 0.016; 0.3 mg/kg vs. healthy: p = 0.55). Vehicle: n = 7, 0.1 mg/kg: n = 7, 0.3 mg/kg: n = 6, healthy: n = 3. In (F) 3-5w, ANOVA (F(3, 14) = 0.21, p = 0.89). Vehicle: n = 6, 0.1 mg/kg: n = 4, 0.3 mg/kg: n = 5, healthy: n = 3. In (F) 5-7w, ANOVA (F(3, 13) = 0.78, p = 0.52). Vehicle: n = 5, 0.1 mg/kg: n = 4, 0.3 mg/kg: n = 5, healthy: n = 3. In (I), ANOVA (F(3,47) = 2.72, p = 0.055). Vehicle: n = 17 OLs from 7 mice, 0.1 mg/kg: n = 11 OLs from 6 mice, 0.3 mg/kg: n = 7 OLs from 5 mice, healthy: n = 16 OLs from 7 mice. Data points color-coded by mouse. In (J) 3w, ANOVA to compare to healthy (F(3, 19) = 10.06, ***p = 0.0003). Dunnett’s (vehicle vs. healthy: ***p = 0.0001; 0.1 mg/kg vs. healthy: **p = 0.0070; 0.3 mg/kg vs. healthy: *p = 0.012). One-sample t tests to compare to baseline (vehicle vs. baseline: t(6) = 4.45, **p = 0.0043; 0.1 mg/kg vs. baseline: t(6) = 1, p = 0.35; 0.3 mg/kg vs. baseline: t(5) = 0.63, p = 0.55). Vehicle: n = 7, 0.1 mg/kg: n = 7, 0.3 mg/kg: n = 6, healthy: n = 3. In (J) 7w, ANOVA to compare to healthy (F(3, 13) = 8.37, **p = 0.0023). Dunnett’s (vehicle vs. healthy: **p = 0.0010; 0.1 mg/kg vs. healthy: p = 0.27; 0.3 mg/kg vs. healthy: p = 0.090). One-sample t tests to compare to baseline (vehicle vs. baseline: t(4) = 0.96, p = 0.39; 0.1 mg/kg vs. baseline: t(3) = 3.45, *p = 0.041; 0.3 mg/kg vs. baseline: t(4) = 2.98, *p = 0.041). Vehicle: n = 5, 0.1 mg/kg: n = 4, 0.3 mg/kg: n = 5, healthy: n = 3. n.s. not significant, *p < 0.05, **p < 0.01, ***p < 0.001; mean ± SEM in (A, I); treatments: least square mean ± SEM and healthy: mean ± SEM in (E, F, J); lines of best fit in (D); n=mice unless otherwise specified; two-sided statistical tests. See Supplementary Data 1 for statistical details and Source Data file for source data. OL=oligodendrocyte.
Fig. 5
Fig. 5. Clemastine has subtler and more protracted actions on remyelination.
A Treatment groups. B Cumulative OL loss and gain (as a percentage of baseline OLs) in individual mice over time (vehicle: n = 4, clemastine: n = 7). C Cumulative OL loss at 3 weeks does not differ between groups in mean or variance. D Clemastine increases OL gain rate (as a percentage of baseline OLs/day) from 3 to 5 weeks. E Clemastine does not change maximum OL gain rate (as a percentage of baseline OLs/day) during remyelination. F Clemastine does not significantly increase cumulative OL gain. G OL number (as a percentage of baseline OLs) is correlated with cumulative OL loss at 7 weeks in mice treated with clemastine. In (C), t test (t(9) = −1.37, p = 0.20). Brown-Forsythe (F(1,9) = 0.043, p = 0.84). Vehicle: n = 4, clemastine: n = 7. In (D) 0-1.5w, ANCOVA with unequal slopes in Supplementary Fig. 11A not significant. Vehicle: n = 4, clemastine: n = 7. In (D) 1.5-3w, no effect of treatment in ANCOVA with unequal slopes in Supplementary Fig. 11B. Vehicle: n = 4, clemastine: n = 7. In (D) 3-5w, post-hoc t test (t(5) = 6.73, **p = 0.0011). Vehicle: n = 4, clemastine: n = 5. In (E), ANCOVA with unequal slopes in Supplementary Fig. 11F not significant. Vehicle: n = 4, clemastine: n = 7. In (F), ANCOVA with unequal slopes in Supplementary Fig. 11G-I not significant. 1.5 and 3w: vehicle: n = 4, clemastine: n = 7. 7w: vehicle: n = 3, clemastine: n = 7. In (G), linear regression (F(1, 2) = 25.75, n = 4). **p < 0.01; mean ± SEM in (C); least square mean ± SEM in (DF); line of best fit in (G); n=mice; two-sided statistical tests. See Supplementary Data 1 for statistical details and Source Data file for source data. OL=oligodendrocyte.
Fig. 6
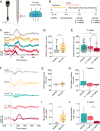
Fig. 6. LL-341070 treatment accelerates recovery of visual function after demyelination.
A As a terminal procedure, three Neuropixel probes inserted in V1 record neuronal activity during visual stimuli presentation. B Experimental timeline. C Representative traces (with SEM) of single-neuron responses to dark flash. Dashed line at stimulus onset. D Demyelination delays single neuron responses to flash (dark and bright). E High dose LL-341070 restores single neuron latencies to flash (dark and bright) by 3 weeks. F Representative VEPs in response to a dark flash. Dashed line at stimulus onset. G, H VEP N70 latency to flash (dark and bright) is not significantly altered by demyelination (G) or treatment at 3 weeks (H). I Demyelination distorts VEP shape in response to flash (dark and bright). J High dose LL-341070 rescues VEP shape distortion by 3 weeks. In (D), Wilcoxon (Z = 4.37, ***p < 0.0001). Healthy: n = 104 responses from 6 probes from 3 mice, demyelinated: n = 55 responses from 7 probes from 5 mice. In (E), Kruskal-Wallis (F(3) = 43.17, ***p < 0.0001). Steel-Dwass (vehicle vs. healthy: ***p < 0.0001; 0.1 mg/kg vs. healthy: ***p < 0.0001; 0.3 mg/kg vs. 0.1 mg/kg: ***p = 0.0002; 0.3 mg/kg vs. vehicle *** p = 0.0022). Vehicle: n = 157 responses from 8 probes from 3 mice, 0.1 mg/kg: n = 40 responses from 6 probes from 4 mice, 0.3 mg/kg: n = 76 responses from 4 probes from 2 mice, healthy: n = 104 responses from 6 probes from 3 mice. In (G), Wilcoxon (Z = −0.79, p = 0.43). Healthy: n = 6 VEPs from 3 probes from 2 mice, demyelinated: n = 20 VEPs from 10 probes from 4 mice. In (H), Kruskal-Wallis (F(3) = 6.11, p = 0.11). Vehicle: n = 18 VEPs from 9 probes from 3 mice, 0.1 mg/kg: n = 11 VEPs from 8 probes from 3 mice, 0.3 mg/kg: n = 12 VEPs from 6 probes from 2 mice, healthy: n = 6 VEPs from 3 probes from 2 mice. In (I), Wilcoxon (Z = −3.13, **p = 0.0017). Healthy: n = 6 VEPs from 3 probes from 2 mice, demyelinated: n = 20 VEPs from 10 probes from 4 mice. In (J), Kruskal-Wallis (F(3) = 20.38, ***p = 0.0001). Steel-Dwass (vehicle vs. healthy: *p = 0.024, 0.1 mg/kg vs. healthy: **p = 0.006, 0.3 mg/kg vs. 0.1 mg/kg ***p = 0.0005). Vehicle: n = 18 VEPs from 9 probes from 3 mice, 0.1 mg/kg: n = 11 VEPs from 8 probes from 3 mice, 0.3 mg/kg: n = 12 VEPs from 6 probes from 2 mice, healthy: n = 6 VEPs from 3 probes from 2 mice. *p < 0.05, **p < 0.01, ***p < 0.001; median, IQR (box), min./max. (whiskers) in (D, E, G, H, I, J); data points color-coded by mouse in (D, E, G, H, I, J); two-sided statistical tests. See Supplementary Data 1 for statistical details and Source Data file for source data. VEP=visual evoked potential.
Fig. 7
Fig. 7. Functional rescue of visual neuronal responses can be attained with remyelination below healthy levels.
A Vehicle and low dose LL-341070 improve single-neuron latency to flash (dark and bright) from 3-7 weeks. High dose LL-341070 already recovers by 3 weeks. B Low and high dose LL-341070 restore single-neuron latencies to flash (dark and bright) by 7 weeks. C, D No differences between groups in VEP N70 latency (C) or shape (D) to flash (dark and bright) at 7 weeks. E Recovery of oligodendrocytes, myelin, and single-neuron responses with time. In (A) vehicle, Wilcoxon (Z = −2.3, *p = 0.022). 3w: n = 157 responses from 8 probes from 3 mice, 7w: n = 144 responses from 11 probes from 4 mice. In (A) 0.1 mg/kg, Wilcoxon (Z = 4.05, ***p < 0.0001). 3w: n = 40 responses from 6 probes from 4 mice, 7w: n = 77 responses from 8 probes from 3 mice. In (A) 0.3 mg/kg, Wilcoxon (Z = 1.11, p = 0.27). 3w: n = 76 responses from 4 probes from 2 mice, 7w: n = 32 responses from 3 probes from 1 mouse. In (B), Kruskal-Wallis (F(3) = 10.85, *p = 0.013). Steel-Dwass (vehicle vs. healthy: *p = 0.013). Vehicle: n = 144 responses from 11 probes from 4 mice, 0.1 mg/kg: n = 77 responses from 8 probes from 3 mice, 0.3 mg/kg: n = 32 responses from 3 probes from 1 mouse, healthy: n = 104 responses from 6 probes from 3 mice. In (C), Kruskal-Wallis (F(3) = 3.32, p = 0.34). Vehicle: n = 17 VEPS from 9 probes from 3 mice, 0.1 mg/kg: n = 27 VEPs from 14 probes from 5 mice, 0.3 mg/kg: n = 13 VEPs from 9 probes from 3 mice, healthy: n = 6 VEPs from 3 probes from 2 mice. In (D), Kruskal-Wallis (F(3) = 13.22, p = 0.0042). Steel-Dwass (vehicle vs. healthy: *p = 0.043; 0.1 mg/kg vs. healthy: *p = 0.012; 0.3 mg/kg vs. healthy: *p = 0.023). Vehicle: n = 17 VEPs from 9 probes from 3 mice, 0.1 mg/kg: n = 27 VEPs from 14 probes from 5 mice, 0.3 mg/kg: n = 13 VEPs from 9 probes from 3 mice, healthy: n = 6 VEPs from 3 probes from 2 mice. n.s. not significant, *p < 0.05, ***p < 0.001; median, IQR (box), min./max. (whiskers) in (AD); data points color-coded by mouse in A-D; two-sided statistical tests. See Supplementary Data 1 for statistical details and Source Data file for source data. VEP=visual evoked potential.

Update of

References

    1. Mcdonald, W. I. & Sears, T. A. Effect of Demyelination on Conduction in the Central Nervous System. Nature221, 182–183 (1969). - PubMed
    1. Smith, K. J., Blakemore, W. F. & Mcdonald, W. I. Central remyelination restores secure conduction. Nature280, 395–396 (1979). - PubMed
    1. Irvine, K. A. & Blakemore, W. F. Remyelination protects axons from demyelination-associated axon degeneration. Brain131, 1464–1477 (2008). - PubMed
    1. Mei, F. et al. Accelerated remyelination during inflammatory demyelination prevents axonal loss and improves functional recovery. Elife5, e18246 (2016). - PMC - PubMed
    1. Duncan, G. J. et al. Remyelination protects neurons from DLK-mediated neurodegeneration. Nat. Commun.15, 9148 (2024). - PMC - PubMed

MeSH terms

LinkOut - more resources