. 2025 Jan 16;16(1):742.
doi: 10.1038/s41467-024-55780-z.

PHARAOH: A collaborative crowdsourcing platform for phenotyping and regional analysis of histology

Affiliations

PHARAOH: A collaborative crowdsourcing platform for phenotyping and regional analysis of histology

Kevin Faust et al. Nat Commun. .

Abstract

Deep learning has proven capable of automating key aspects of histopathologic analysis. However, its context-specific nature and continued reliance on large expert-annotated training datasets hinders the development of a critical mass of applications to garner widespread adoption in clinical/research workflows. Here, we present an online collaborative platform that streamlines tissue image annotation to promote the development and sharing of custom computer vision models for PHenotyping And Regional Analysis Of Histology (PHARAOH; https://www.pathologyreports.ai/ ). Specifically, PHARAOH uses a weakly supervised, human-in-the-loop learning framework whereby patch-level image features are leveraged to organize large swaths of tissue into morphologically-uniform clusters for batched annotation by human experts. By providing cluster-level labels on only a handful of cases, we show how custom PHARAOH models can be developed efficiently and used to guide the quantification of cellular features that correlate with molecular, pathologic and patient outcome data. Moreover, by using our PHARAOH pipeline, we showcase how correlation of cohort-level cytoarchitectural features with accompanying biological and outcome data can help systematically devise interpretable morphometric models of disease. Both the custom model design and feature extraction pipelines are amenable to crowdsourcing, positioning PHARAOH to become a fully scalable, systems-level solution for the expansion, generalization and cataloging of computational pathology applications.


Conflict of interest statement

Competing interests: The authors declare no competing interests.

Figures
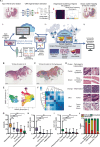
Fig. 1
Fig. 1. Image feature-based clustering segments complex WSIs into relatively uniform tissue partitions.
A (i) Workflow highlighting mapping of tissue patterns across entire Whole Slide Images (WSIs). Briefly, a pre-trained Convolutional Neural Network (CNN) is used as a feature extractor and the generated Deep Learning Feature Vector (DLFV)s are used to cluster and map image patches back onto the WSI. (ii–iv) Cartoon schematic of the PHARAOH workflow. (ii) Unlabeled WSIs are uploaded to the online portal. Users receive tile-clustered maps to help decipher proposed groupings. Users provide cluster-level annotations which are aggregated across multiple WSIs and used to finetune custom CNN models. The process can be repeated to refine accuracy/desired outputs. (iii) Once developed, trained classifiers are made publicly available. In addition to tissue segmentation, various regional histomic (DLFs) and cell-based phenotyping outputs are provided to serve as biomarkers of disease (e.g. tumor infiltrating lymphocytes). (iv) In addition to core PHARAOH outputs, users can also export segmented target regions of interest and carry out custom image analyses using other third-party tools on companion platforms (CODIDO; codido.co). Panels (ii–iv) created in BioRender. Diamandis, P. (2025) https://BioRender.com/y70k830. B, C Demonstrative input (WSI) (B) and output (tissue heterogeneity map) (C) images of a sample colorectal adenocarcinoma from The Cancer Genome Atlas (TCGA). Scale bars = 2 mm. (n = 984 tiles extracted/clustered from this sample). D Representative image patches highlighting stereotypical morphology from different partitions. Tiles = 256 × 256 pixels. E, F The relative degree of histomorphology similarities/differences align with cluster positioning on dimensionality reduction plots (UMAP) (E) and Pairwise Pearson correlation coefficients (r) (F) of the partition’s DLFVs. GI Box plots highlighting quantitative cellularity (G), epithelial (DLF66) (H), and fibrosis (DLF215) (I) marker differences between defined regions. Box plots show minimum, first quartile, median, third quartile, and maximum. Counts represent nuclear instances or overall activation per 67,488 µm2. ***p < 0.001 (2-sided t-test). J Regional cell composition differences (HoVer-Net outputs). All relevant source data including number of unique image patches (technical replicates) for each comparison group are provided as Supplementary Data files.
Fig. 2
Fig. 2. Automated analysis of TILs and morphometric features correlate with outcomes and biology in skin melanoma.
A Schematic of weakly supervised annotation pipeline to train Convolutional Neural Network (CNN) models for automated tumor delineation, coupled with Tumor Infiltrating Lymphocyte (TIL) inferencing and morphometric analysis. B Sample Hematoxylin & Eosin (H&E)-stained Whole Slide Image (WSI) case input (top) and Class Activation Map output (bottom) of a representative case from The Cancer Genome Atlas Skin Cutaneous Melanoma (TCGA-SKCM) cohort; custom region of interest (melanoma) shown in brown; adipose and fibroconnective tissue shown in red and yellow, respectively. Scale bars = 2 mm. C Representative output of HoverNet/PanNuke for nuclear segmentation and classification; nuclei from neoplastic cells delineated in red, TILs in yellow. Tile length = 129 µm. D Sample distribution of TIL counts in 200 tiles classified as tumor and computed sample-level TIL score (mean and standard deviation shown in red) from 200 target tiles extracted from this representative case. E Scatter plot of case-level correlation between PHARAOH-based TIL quantification and RNA-based Lymphocyte infiltration signature score across TCGA-SKCM cohort. (R2 and p-value generated by simple linear fit model). F Kaplan–Meier survival curves for TCGA-SKCM cohort split into “high” (yellow) and “low” (blue) PHARAOH-TIL scores based on the overall cohort’s median value. p-value derived from 2-sided log rank test. Shaded bands show 95% confidence intervals of the variance in survival estimates (standard deviation). G Top ranked morphometric features whose values were found to predict divergent values in the Mitotic spindle program (p < 0.05, 2-sided ANOVA). H Sample case images with low, intermediate and high activations for the feature “AreaOccupied_NucleiObjects”, showing an expected increase in nuclear density. Tiles = 256 × 256 pixels. I Volcano plot highlighting significant differences in Single Sample Gene Sets Enrichment (ssGSEA) between subgroups of cases with high and low values of the morphometric feature “AreaOccupied_NucleiObjects”. Legend is shown above plot (p-value generated by 2-sided ANOVA, no FDR). J Morphometric model of interpretable features that predict melanoma with elevated mitotic spindle activity. All relevant source data for this figure are provided as Supplementary Data files. Panels (A, J) created with Biorender.com. Diamandis, P. (2025) https://BioRender.com/c69l485.
Fig. 3
Fig. 3. Multivariate models developed using extracted morphometric features predict aggressiveness in ccRCC.
A Schematic of the hand-crafted 3-feature model designed to capture key aspects of clear cell Renal Cell Carcinoma (ccRCC) Fuhrman grading. Created with Biorender.com. Diamandis, P. (2025) https://BioRender.com/c69l485. B Sample case input (top) and Class Activation Map (CAM) output (bottom) of a representative case from The Cancer Genome Atlas Kidney Renal Clear Cell Carcinoma (TCGA-KIRC) cohort. Custom region of interest (ccRCC) is shown in brown while normal renal parenchyma and fibroconnective tissue are shown in cyan and yellow, respectively. Scale bars = 2 mm. C, D Box plots showing aggregate nuclear feature values, separated by their pathologist-reported nuclear grades, in the TCGA-KIRC study (test set, n = 446 subjects, G1-4: 12,194,183,57 respectively) and in a local cohort (n = 35 subjects, G1-4: 8,10,9,8 respectively) (Saint Michael’s Hospital; SMH), respectively. Legend is shown between panels. E Kaplan–Meier (KM) survival curves for the TCGA-KIRC cohort split into “high” (yellow) and “low” (blue) aggregate nuclear feature score groups based on the overall cohort’s median value. F Variable importance in the XGBoost model for survival, trained with the 160 morphometric features. G, H Box plots showing predicted risk scores stratified by nuclear grade, in the TCGA-KIRC study (test dataset, n = 242 subjects, G1-4: 5,111,98,28) and in a local cohort (n = 35 subjects, G1-4: as above), respectively. Legend is shown between panels. I KM analysis for the TCGA-KIRC cohort (test dataset, n = 242 subjects) split into groups with “high” (pink) and “low” (turquoise) risk scores shows a more pronounced survival difference than the former hand-crafted model. All box plots in this figure show minimum, first quartile, median, third quartile, and maximum. p-value thresholds for box plots are denoted as follows using a 2-sided ANOVA test: *p < 0.05, **p < 0.01 and ***p < 0.001. NS = not significant. P-values for KM survival curves represent 2-side log rank tests. Shaded bands show 95% confidence intervals of the variance in survival estimates (standard deviation). Corrections for multiple comparisons were not relevant to these analyses. All relevant source data for this figure are provided as Supplementary Data files.

References

    1. Djuric, U., Zadeh, G., Aldape, K. & Diamandis, P. Precision histology: how deep learning is poised to revitalize histomorphology for personalized cancer care. npj Precis. Oncol.1, 22 (2017). - PMC - PubMed
    1. Campanella, G. et al. Clinical-grade computational pathology using weakly supervised deep learning on whole slide images. Nat. Med.25, 1301–1309 (2019). - PMC - PubMed
    1. Bernard, J., Zeppelzauer, M., Lehmann, M., Müller, M. & Sedlmair, M. Towards user-centered active learning algorithms. Comput. Graph. Forum.37, 121–132 (2018).
    1. Shuyang, Z., Heittola, T. & Virtanen, T. Active learning for sound event detection. IEEE/ACM Trans. Audio Speech Lang. Process.28, 2895–2905 (2020).
    1. Dent, A. et al. HAVOC: Small-scale histomic mapping of cancer biodiversity across large tissue distances using deep neural networks. Sci. Adv.9, eadg1894 (2023). - PMC - PubMed

LinkOut - more resources