. 2025 Feb 3;222(2):e20240896.
doi: 10.1084/jem.20240896. Epub 2025 Jan 17.

Cigarette smoke components modulate the MR1-MAIT axis

Affiliations

Cigarette smoke components modulate the MR1-MAIT axis

Wael Awad et al. J Exp Med. .

Abstract

Tobacco smoking is prevalent across the world and causes numerous diseases. Cigarette smoke (CS) compromises immunity, yet little is known of the components of CS that impact T cell function. MR1 is a ubiquitous molecule that presents bacterial metabolites to MAIT cells, which are highly abundant in the lungs. Using in silico, cellular, and biochemical approaches, we identified components of CS that bind MR1 and impact MR1 cell surface expression. Compounds, including nicotinaldehyde, phenylpropanoid, and benzaldehyde-related scaffolds, bound within the A' pocket of MR1. CS inhibited MAIT cell activation, ex vivo, via TCR-dependent and TCR-independent mechanisms. Chronic CS exposure altered MAIT cell phenotype and function and attenuated MAIT cell responses to influenza A virus infection in vivo. MR1-deficient mice were partially protected from the development of chronic obstructive pulmonary disease (COPD) features that were associated with CS exposure. Thus, CS can impair MAIT cell function by diverse mechanisms, and potentially contribute to infection susceptibility and disease exacerbations.


Conflict of interest statement

Disclosures: L. Liu reported a patent to WO2015149130 licensed “National Institutes of Health (USA) and Immudex (Denmark)” and a patent to WO2014005194 licensed “National Institutes of Health (USA) and Immudex (Denmark).” J.Y.W. Mak reported a patent to WO2015149130A9 issued. J. McCluskey reported a patent to US 10011602B2, PCT/AU2013/000742 issued and a patent to US 10245262 B2 issued; and “MR1-Antigen dextramers are manufactured under a University of Melbourne license by Immudex MR1-Ag tetramers are manufactured and distributed by the NIH Tetramer facility at no cost to investigators.” A.J. Corbett reported a patent to WO2014/005194 and WO2015/149130 licensed “NIH Core tetramer facility” and a patent to WO2014/005194 and WO2015/149130 licensed “Immudex.” D.P. Fairlie reported a patent to WO/2015/149130 issued and a patent to WO/2014/005194 licensed “Immudex.” J. Rossjohn reported a patent to WO/2015/149130 issued and a patent to WO/2014/005194 licensed “Immudex.” No other disclosures were reported.

Figures

Figure 1.
Figure 1.
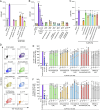
Impact of CS extract on MR1 upregulation and MAIT reporter cell activation. (A) Histogram and graph show surface expression of MR1 on C1R-MR1 cells in response to 3-h incubation with Ac-6-FP (100 µM or 10 µM) or CSE (5%–0.05 vol/vol%). (B) Time course shows dynamics of MR1 upregulation after adding Ac-6-FP (100 µM) or CSE (3% and 1%) to C1R.MR1 over 24 h. (C) CD69 expression in Jurkat.MAIT and Jurkat.LC13 (HLA-B8–EBV peptide-specific non-MAIT control) cells following activation with 5-OP-RU, Ac-6-FP, FLR, or CSE for 16-h co-culture with or without C1R.MR1 cells or with C1R.B8 as antigen-presenting cells. (D) Activation, detected by staining with anti-CD69, of Jurkat.MAIT cells after co-incubation with C1R.MR1 cells in the presence of 5-OP-RU or CSE, with or without anti-MR1 (26.5) or isotype control (W6/32) antibodies. The 26.5 and W6/32 antibodies were added to C1R.MR1 cells 2 h prior to co-incubation. (E) Activation of Jurkat.MAIT reporter cells expressing TRBV6-1, TRBV6-4, and TRBV20 TCRs, detected as CD69 expression, by 5-OP-RU, or CSE (5%, 2.5% and 1.25%) for 16 h in co-culture with C1R.MR1 as antigen-presenting cells. (F) Inhibition of Jurkat.MAIT reporter cell activation with 5-OP-RU by CSE. CSE was added to C1R.MR1 cells at the indicated concentrations and co-incubated with Jurkat.MAIT cells with or without 5-OP-RU. Data show emission at 492 nm, correlating with IL-2 production. (A–F) Data are shown as the mean ± SEM from three independent experiments. Statistical analysis by a one-way ANOVA followed by Dunnett’s multiple comparison test (* = P < 0.05, ** = P < 0.01, *** = P < 0.001, and **** = P < 0.0001).
Figure S1.
Figure S1.
Screening of compounds identified as CS components for antigen presentation. (A and B ) Proportion of cells in live cell gate after 3-h incubation with (A) Ac-6-FP (100–10 µM) or CSE (5–0.05), (B) DMSO, Ac-6-FP (100-10 µM), or 100-1 μM of indicated compounds. (C–E) Cell surface expression (geometric MFI [gMFI]) of MR1 (C), MHC I (D), and CD86 (E) on C1R cells in response to selected CS compounds or DMSO vehicle control, as labeled, at three concentrations (left to right 200, 100, and 50 μM), CSE (10%, 5%, 2.5%, and 1.25%), 5-OP-RU (10 μM to 0.1 nM, at 10-fold dilution), or Ac-6-FP (from 10 μM to 0.1 nM, at 10-fold dilution) for 3 h. The dotted line shows the gMFI value of Nil. Data are shown as the mean ± SEM from three independent experiments.
Figure 2.
Figure 2.
In silico and molecular docking of the chemical components of CS as prospective ligands for MR1. (A) CS is a complex mixture of products of tobacco combustion and other cigarette ingredients. (B) Prioritized compounds selected as putative ligands for MR1. (C and D) Chemical structures and molecular docking (using Glide) of CS components (pink) predicted to form a Schiff-based covalent bond with MR1-Lys43, including 5-membered and 6-membered aldehydes (C), or non-covalent bonds (cyan) within the putative ligand-binding cleft of MR1 (grey ribbon), including aromatic acetyls, chlorine-containing compounds, and acids (D). Key MR1 residues are shown as grey sticks and ligands are shown as ball and sticks (oxygen = red, nitrogen = blue, and chlorine = green).
Figure 3.
Figure 3.
CS components impact cell surface expression of MR1. (A) Histogram and column graph showing cell surface expression of MR1 on C1R.MR1 cells (measured as MFI) in response to 3-h incubation with Ac-6-FP and penconazole and anilazine at the indicated doses. (B) Surface expression of MR1 on C1R.MR1 cells after 3-h incubation with Ac-6-FP, nicotinaldehyde, salicylaldehyde, α-methyl-trans-cinnamaldehyde, veratraldehyde, 2,3-dihydroxybenzaldehyde, or 3,4-dihydroxybenzaldehyde at indicated doses. DMSO was the vehicle control for all compounds. The dotted line shows the gMFI value of DMSO. Data show fold increases over background intensity (mean ± SEM from three independent experiments). Statistical analysis by a one-way ANOVA followed by Dunnett’s multiple comparison test (* = P < 0.05, ** = P < 0.01, *** = P < 0.001, and **** = P < 0.0001). (C) Thermostability of soluble MR1-CS ligands measured by fluorescence-based thermal shift assay. Graph shows baseline corrected, normalized emission at 610 nm plotted against temperature (°C) and Boltzmann curve fits. Each point represents the mean of three replicates, error bars represent SD. The Tm50 is the dotted line. The table summarizes the mean Tm50 across three independent experiments, each in triplicate.
Figure 4.
Figure 4.
Crystal structures of MR1 with ligands corresponding to CS components. (A and B) Superposition of the ternary structures of TCR-MR1-CS–based ligands, with superposition of the CS-based ligands within the binding pocket shown as B. (C–F) The crystallographic unambiguous omit maps of nicotinaldehyde (C), salicylaldehyde (D), veratraldehyde (E), and 3,4-dihydroxybenzaldehyde (F) after simulated-annealing refinement (using the Phenix-refine crystallographic structure-refinement program), presented as an Fo− Fc map (observed structure factor − calculated structure factor; smudge mesh) contoured at 3σ that highlight unambiguous positions of the ligands within the MR1 cleft. (G) Superposition of the MR1-binding ligands shows similar docking of the ligands within the A′ pocket of MR1. (H–L) Interactions between nicotinaldehyde (H), salicylaldehyde (I), veratraldehyde (J), 3,4-dihydroxybenzaldehyde (K), Ac-6-FP (PDB 4PJ5) (L), and the residues of MR1-A` portal in the MR1-Ag structures. All MR1-ligand interacting residues are shown as white sticks and water molecules are red spheres. Nicotinaldehyde, lemon; salicylaldehyde, wheat; veratraldehyde, cyan; 3,4-dihydroxybenzaldehyde, salmon; and Ac-6-FP, orange. Hydrogen bonding and van der Waals interactions are shown as black and orange dashed lines, respectively.
Figure 5.
Figure 5.
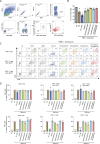
Effects of CS extract and its components on and MAIT cells and non-MAIT T cells. (A) Activation of Jurkat.MAIT AF-7 cells detected as CD69 expression, by penconazole or anilazine alone (100 μM) or in the presence of 0.01 nM 5-OP-RU, after 3-h co-culture with C1R.MR1 antigen-presenting cells. (B and C) Activation of Jurkat.MAIT AF-7 reporter cells, detected as CD69 expression, by indicated compounds alone (200 and 100 μM) (B) or in the presence of 0.01 nM 5-OP-RU (C), after overnight (∼16 h) co-culture with C1R.MR1 antigen-presenting cells. Data show mean ± SEM from three independent experiments. Statistical analysis by a one-way ANOVA followed by Dunnett’s multiple comparison test (* = P <0.05 and **** = P < 0.0001). (D–F) PBMCs were incubated for 6 h with 5-OP-RU (0.1 nM) ±5% CSE at a range of concentrations or CS compounds veratraldehyde, nicotinaldehyde, salicylaldehyde, or 3,4-dihydroxybenzaldehyde (100, 60, 20, 5, and 1 μM) or Ac-6-FP (100, 60, 20, 5, and 1 μM); including 5-h inhibition of cytokine secretion with Golgi plug (mean ± SEM, two independent experiments). Cells were stained intracellularly for cytokines IFNγ (four donors) and TNF (seven donors) and analyzed by flow cytometry to determine the impact on MAIT cell activation. Equivalent doses of DMSO were used as the vector control for the compounds. For gating strategy and % live cell data, see Fig. S5. (D) Contour plot shows intracellular staining profile of TNF and IFNγ by MAIT cells. (E and F) Plot shows the total percentage of MAIT cells positive for TNF (E) or for IFNγ (F) in response to 5-OP-RU in the presence or absence of CSE (5%, 2%, 1.25%, and 0.73%), 100 μM of indicated compounds or Ac-6-FP, normalized to the 5-OP-RU control. Statistical analysis by a one-way ANOVA with Holm–Sidak post hoc test (* = P < 0.05, ** = P < 0.01, and *** = P < 0.001).
Figure S2.
Figure S2.
Jurkat.MAIT activation by smoke compounds. (A–D) Activation of Jurkat.MAIT reporter cells expressing TRBV6-1 (A), TRBV6-4 (B), TRBV20 (C), or Jurkat.LC13 (HLA-B8–EBV peptide-specific non-MAIT control) (D), detected as CD69 expression following incubation with 5-OP-RU (from 10 μM to 0.0001 nM, at 10-fold dilution) (A–C), Ac-6-FP (from 10 μM to 1 nM, at 10-fold dilution) (A–C), or smoke candidate compounds (200 and 100 μM), for 16 h in co-culture with C1R.MR1 cells (A–C) or C1R.B8 (D) as antigen-presenting cells. FLR peptide gives maximal activation of Jurkat.LC13. Data are shown as the mean ± SEM from three independent experiments.
Figure S3.
Figure S3.
Activation/inhibition of MAIT cells and T cells within PBMCs by CSE, CS, and components. (A) Gating strategy for MAIT cells, which were defined as CD3+ MR1–5-OP-RU tetramer+ TRAV1-2+ CD161++ live lymphocytes. PBMCs were incubated for 6 h with 5-OP-RU (0.1 nM) ± CSE (5%); Ac-6-FP (100, 60, 40, 20, 5, and 1 μM); or the indicated CS compounds (100, 60, 40, 20, 5, and 1 μM), including 5-h inhibition of cytokine secretion with Golgi plug. Cells were stained intracellularly for cytokines analyzed by flow cytometry. (B–D) PBMCs were activated with PMA (5 ng/ml) and ionomycin (1 μg/ml) following 1-h incubation in the presence or absence 5% CSE or 100 μM of indicated compounds. BD Golgi plug was added and cells incubated for 18 h, before being stained with surface antibodies to identify MAIT, CD4+ (non-MAIT), and CD8+ (non-MAIT) T cells, stained intracellularly with antibodies to cytokines (TNF-APC and IFNγ-AF700) and analyzed by flow cytometry. (B) Proportion of cells in the live cell gate. (C) Representative plots showing the expression of cytokines IFNγ and TNF by MAIT and CD4+ and CD8+ T cell subsets. (D) Graphs summarize the proportion of indicated T cell subsets producing cytokines (mean ± SEM of three donors). Statistical analysis by a one-way ANOVA with Holm-Sidak post hoc test (* = P < 0.05, ** = P < 0.01, *** = P < 0.001).
Figure S4.
Figure S4.
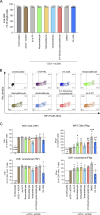
Effect of CSE and components on TCR independent (CD3/CD28) activation of T cells. (A–C) PBMCs were activated for 6 h with plate-bound α-CD3 (#555 329; 10 μg/ml; BD) and α-CD28 (#555 729; 2 μg/ml; BD) following 1-h incubation in the presence or absence 5% CSE or 100 μM of indicated compounds. BD Golgi plug was added and cells for the last 5 h of stimulation. Cells were then stained with surface antibodies to identify MAIT and CD4+ (non-MAIT) and CD8+ (non-MAIT) T cells, stained intracellularly with antibodies to cytokines (TNF-Pacific blue and IFNγ-BV650) and analyzed by flow cytometry. (A) The proportion of cells in the live cell gate. (B) Representative plots showing the expression of cytokines IFNγ and TNF by MAIT and CD4+ and CD8+ T cell subsets. (C) Plots showing the percentage of MAIT or CD8+ conventional T cells positive for either TNF or IFNγ, in response to CD3/CD28 stimulation in the presence or absence of CSE (5%), 100 μM of indicated compounds or Ac-6-FP; normalized to the CD3/CD28 control (% positive). Graphs show the mean ± SEM of three to four donors from one independent experiment. Statistical analysis by a one-way ANOVA with Holm-Sidak post hoc test (* = P < 0.05, ** = P < 0.01, *** = P < 0.001).
Figure S5.
Figure S5.
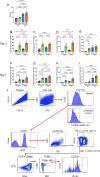
Airway inflammation during in vivo CS exposure and IAV infection, and gating strategy for characterization of murine lung MAIT cells. (A–I) Alveolar diameter as measured using the alveolar wall MLI technique in lung tissue sections and (B and F) total leukocytes, (C and G) macrophages, (D and H) neutrophils, and (E and I) lymphocytes in BALF from mice exposed to normal air or CS for 10 wk, followed by inoculation with IAV or sham inoculation, assessed at day 3 (B–E) or 7 (A and F–I) after inoculation. All data are presented as mean ± SEM. N = 5–8 mice. Statistical analysis by one-way ANOVA with Fisher’s least significant difference post hoc test. (J) Gating strategy for the identification and characterization of MAIT cells (CD45+ TCRβ+ MR1–5-OP-RU tetramer+ PLZF+ CD44hi NK1.1 CD19 CD11b) in single-cell suspensions of the mouse lung tissue. Doublets, debris, and dead cells were first excluded. Leukocytes (CD45+ cells) were then selected, followed by lymphocytes (forward scatter [FSC]lo-int side scatter [SSC]lo). FITC was used as a dump channel to exclude NK1.1+, CD19+, and CD11b+ cells. Following this, PLZF+ CD44hi cells were selected and then finally TCRβ+ MR1–5-OP-RU tetramer+ MAIT cells were identified. MR1 reactivity was determined by comparison of MR1–5-OP-RU tetramer staining to 6-FP control tetramer staining. MAIT cells were further characterized as CD103+/−.
Figure 6.
Figure 6.
CS exposure alters MAIT cell numbers and functional marker expression in vivo. (A) Representative flow cytometry plots, including MAIT cells (CD45+ TCRβ+ MR1–5-OP-RU tetramer+ PLZF+ CD44hi NK1.1 CD19 CD11b), in lung homogenates from mice exposed to normal air or CS for 2, 4, 6, 8, or 12 wk. (B–D) (B) Total numbers of MAIT cells per lung, (C) frequency of MAIT cells as a percentage of CD45+ cells, and (D) total numbers of CD45+ cells per lung, in lung homogenates from mice as in A. (E–J) Representative flow cytometry plots showing (E) CD103 expression on MAIT cells, (F) frequency of CD103+ MAIT cells as a percentage of total MAIT cells, and (G) MFI of CD103 staining on MAIT cells, in lung homogenates from mice as in A. Frequency of (H) IL-17+, (I) PD1+, and (J) CD38+ MAIT cells as a percentage of total MAIT cells, in lung homogenates from mice as in A. All data expressed as fold change to air exposed controls and presented as mean ± SEM. N = 7–8. Statistical analysis by one-way ANOVA with Fisher’s least significant difference post hoc test (* = P < 0.05, ** = P < 0.01, *** = P < 0.001, and **** = P < 0.0001).
Figure 7.
Figure 7.
CS exposure differentially alters CD103, IL-17, PD1, CD38 expression in MAIT, CD4 + , and CD8 + T cells. (A–L) Representative flow cytometry histograms comparing (A) CD103, (D) IL-17, (G) PD1, or (J) CD38 expression on MAIT cells (CD45+ TCRβ+ MR1–5-OP-RU tetramer+ PLZF+ CD44hi NK1.1 CD19 CD11b), as shown in Fig. 6, compared with CD4+ and CD8+ T cells (CD45+ TCRβ+); frequency of (B) CD103+, (E) IL-17+, (H) PD1+, or (K) CD38+ cells as a percentage of total MAIT and CD4+ and CD8+ T cells; MFI of positive cells for (C) CD103, (F) IL-17, (I) PD1, or (L) CD38 staining on MAIT and CD4+ and CD8+ T cells; in lung homogenates from mice exposed to normal air or CS for 12 wk from experiment as in Fig. 6. All data presented as mean ± SEM. N = 7–8 mice. Statistical analysis by one-way ANOVA with Fisher’s least significant difference post hoc test (* = P < 0.05, ** = P < 0.01, *** = P < 0.001, and **** = P < 0.0001).
Figure 8.
Figure 8.
CS exposure alters MAIT cell responses and CD103 expression during IAV infection in vivo. (A) Representative flow cytometry plots, including MAIT cells (CD45+ TCRβ+ MR1–5-OP-RU tetramer+ PLZF+ CD44hi NK1.1 CD19 CD11b). (B–G) (B and E) Total numbers of MAIT cells per lung, (C and F) frequency of MAIT cells as a percentage of CD45+ cells, and (D and G) total numbers of CD45+ cells per lung, in lung homogenates from mice exposed to normal air or CS for 10 wk, followed by infection with IAV or sham infection, at day 3 (A–D) or 7 (A and E–G) after inoculation. (H–L) Representative flow cytometry plots showing (H) CD103 expression on MAIT cells, (I and K) frequency of CD103+ MAIT cells as a percentage of total MAIT cells, and (J and L) MFI of CD103 staining on MAIT cells, in lung homogenates from mice as in A. All data presented as mean ± SEM. N = 5–8 mice. Statistical analysis by one-way ANOVA with Fisher’s least significant difference post hoc test (* = P < 0.05, ** = P < 0.01, *** = P < 0.001, and **** = P < 0.0001).
Figure 9.
Figure 9.
MAIT cell deficiency is associated with protection of COPD development. WT or MR1−/− mice were exposed to room air (Air) or CS from up to 12 cigarettes, twice/day, 5 days/wk for up to 8 wk. Mice were then put through lung function perturbations and BALF collected from the single lobe of the lung. (A–D) Total leukocytes (A) were counted and then cytospins for differential cell counts created to quantify macrophages (B), neutrophils (C), and lymphocytes (D). (E–H) Lung function parameters such as inspiratory capacity (E), forced vital capacity (F), and total lung capacity (G) were measured. Histological examination of the lung parenchyma and distance between alveoli was measured to calculate emphysema (H). (I) Representative images of the lung parenchyma in each of the groups are shown. Scale bar represents 20 μm. Data shown are the mean ± SEM. N = 7–8 mice. Statistical analysis was performed using a one-way ANOVA (* = P < 0.05, ** = P < 0.01, *** = P < 0.001, and **** = P < 0.0001).

References

    1. Adams, P.D., Afonine P.V., Bunkóczi G., Chen V.B., Davis I.W., Echols N., Headd J.J., Hung L.W., Kapral G.J., Grosse-Kunstleve R.W., et al. . 2010. PHENIX: A comprehensive python-based system for macromolecular structure solution. Acta Crystallogr. D Biol. Crystallogr. 66:213–221. 10.1107/S0907444909052925 - DOI - PMC - PubMed
    1. Awad, W., Ciacchi L., McCluskey J., Fairlie D.P., and Rossjohn J.. 2023. Molecular insights into metabolite antigen recognition by mucosal-associated invariant T cells. Curr. Opin. Immunol. 83:102351. 10.1016/j.coi.2023.102351 - DOI - PMC - PubMed
    1. Awad, W., Ler G.J.M., Xu W., Keller A.N., Mak J.Y.W., Lim X.Y., Liu L., Eckle S.B.G., Le Nours J., McCluskey J., et al. . 2020. The molecular basis underpinning the potency and specificity of MAIT cell antigens. Nat. Immunol. 21:400–411. 10.1038/s41590-020-0616-6 - DOI - PubMed
    1. Bahl, V., Shim H.J., Jacob P. III, Dias K., Schick S.F., and Talbot P.. 2016. Thirdhand smoke: Chemical dynamics, cytotoxicity, and genotoxicity in outdoor and indoor environments. Toxicol. In Vitro. 32:220–231. 10.1016/j.tiv.2015.12.007 - DOI - PMC - PubMed
    1. Beckett, E.L., Stevens R.L., Jarnicki A.G., Kim R.Y., Hanish I., Hansbro N.G., Deane A., Keely S., Horvat J.C., Yang M., et al. . 2013. A new short-term mouse model of chronic obstructive pulmonary disease identifies a role for mast cell tryptase in pathogenesis. J. Allergy Clin. Immunol. 131:752–762. 10.1016/j.jaci.2012.11.053 - DOI - PMC - PubMed

MeSH terms

LinkOut - more resources