. 2025 Apr 2;15(4):838-861.
doi: 10.1158/2159-8290.CD-24-0442.

The FBXO45-GEF-H1 Axis Controls Germinal Center Formation and B-cell Lymphomagenesis

Affiliations

The FBXO45-GEF-H1 Axis Controls Germinal Center Formation and B-cell Lymphomagenesis

Anagh A Sahasrabuddhe et al. Cancer Discov. .

Abstract

We describe the identification of a previously unrecognized ubiquitin ligase-substrate (FBXO45-GEF-H1) regulatory axis that plays an important role in germinal center formation and pathogenesis of common BCLs. These studies reveal novel insights linking dysregulated ubiquitin-mediated control to exploitable vulnerabilities and novel therapeutic strategies for these cancers.


Conflict of interest statement

R. Siebert reports grants from the BMBF (Bundesministerium fur Bildung und Forschung, German Federal Ministry of Education and Research), Deutsche Krebshilfe, and DFG (Deutsche Forschungsgemeinschaft) during the conduct of the study. M. Pagano reports having been an advisor for and having financial interests in SEED Therapeutics, Triana Biomedicines, CullGen, Kymera Therapeutics, and Serinus Biosciences. M.S. Lim reports grants from the NCI during the conduct of the study and having co-founder interests in Genomenon Inc, outside the submitted work. K.S.J. Elenitoba-Johnson reports grants from the NCI and Thermo Fisher Scientific during the conduct of the study and having been an advisor for and having founder interests in Genomenon, Inc. outside the submitted work. No disclosures were reported by the other authors.

Figures

Figure 1.
Figure 1.
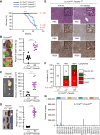
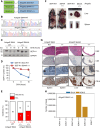
In vivo conditional targeting of Fbxo45 in GCB cells of transgenic mice results in abnormal GCB-cell expansion. Representative flow plots (A) and quantification (B) of GC cells pregated on live B220+CD19+ splenic cells from Cγ1Cretg/+-Fbxo45+/+, Cγ1Cretg/+-Fbxo45+/fl, and Cγ1Cretg/+-Fbxo45fl/fl mice analyzed 10 days after SRBC stimulation. A, Numbers in each panel indicate the frequencies of GC, B220+ B cells identified by CD95+PNA+. B, Graphs show percentages of GCB cells/spleen identified by CD95+PNA+ (n = number of mice per genotype at 4–6 months of age). C, Graph shows the percentages of GCB cells/spleen identified by CD95+GL7+ (n = number of mice per genotype at 4–6 months of age). Two-tailed Mann–Whitney unpaired Student’s t test was used for analysis. D, Graph shows the absolute number of GCB cells/spleen of SRBC immunized mice from the indicated genotype. Two-tailed Mann–Whitney unpaired Student’s t test was used for analysis. E, Graph shows the number of GCs/spleen of SRBC-immunized mice from the indicated genotype. Data are representative of three independent experiments. Two-tailed Mann–Whitney unpaired Student’s t test was used for analysis. F, Graph shows the area of GC (pixel2)/spleen after normalization to the total spleen area of SRBC-immunized mice from the indicated genotype. Two-tailed Mann–Whitney unpaired Student’s t test was used for analysis. G, IHC images of PNA in GC (brown) and nuclei (purple) stained by hematoxylin in representative spleen sections from indicated genotype 10 days after SRBC immunization. H, Quantitative analysis of PNA-stained sections of spleen was performed using ImageJ software. The quantification is represented as the mean ± SEM of pixel intensity (*, P < 0.05; **, P < 0.01; ***, P < 0.001). ns, not significant.
Figure 2.
Figure 2.
In vivo conditional deletion and haploinsufficiency of Fbxo45 in GCB- cells results in B-cell lymphomagenesis. A, Kaplan–Meier survival curves color-coded for the indicated genotype. B, HOM Fbxo45 KO mice (Cγ1Cretg/+-Fbxo45fl/fl) develop lymphomas. Representative images from three different animals with lymphoma masses circumscribed in green. Top left, Large cervical lymphoma. Middle and bottom left, Visceral lymphoma masses and retroperitoneal lymph nodes extensively involved by lymphoma. Right, Weight of mesenteric lymph nodes compared between Cγ1Cretg/+-Fbxo45+/+ and Cγ1Cretg/+-Fbxo45fl/fl mice. C, Left, representative images of large ileocecal lymphomas from three Cγ1Cretg/+-Fbxo45fl/fl animals juxtaposed to Peyer’s patches (white circles) from five Cγ1Cretg/+-Fbxo45+/+ animals. Right shows volume of lymph nodes from Cγ1Cretg/+-Fbxo45fl/fl compared with Cγ1Cretg/+-Fbxo45+/+ mice. D, Left, representative images of spleen from three pairs of Cγ1Cretg/+-Fbxo45+/+ and Cγ1Cretg/+-Fbxo45fl/fl littermates. Box and whisker plots show significantly (***, P < 0.001; ****, P < 0.0001) increased spleen size in Cγ1Cretg/+-Fbxo45fl/fl compared with Cγ1Cretg/+-Fbxo45+/+ mice. E, IHC staining of FL and DLBCL in Cγ1Cretg/+-Fbxo45fl/fl mice as indicated. F, Percent incidences of lymphomagenesis among Cγ1Cretg/+-Fbxo45+/+, Cγ1Cretg/+-Fbxo45+/fl, and Cγ1Cretg/+-Fbxo45fl/fl transgenic mice. G, Next-generation sequencing analysis of IGHV gene usage to assess clonal populations in tumors from Cγ1Cretg/+-Fbxo45fl/fl mice. H&E, hematoxylin and eosin.
Figure 3.
Figure 3.
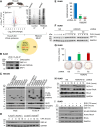
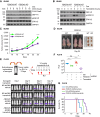
FBXO45 regulates GEF-H1 protein stability, RhoA activation, and colony formation. A, Venn diagram showing overlap of proteins from quantitative proteomic analysis of Cγ1Cretg/+-Fbxo45fl/fl GCB cells compared with GCB cells from Cγ1Cretg/+-Fbxo45+/+ transgenic mice and proteins enriched in FBXO45 IP and identified by MS/MS. B, BJAB cells expressing doxycycline-inducible FLAG-tagged FBXO45 (iFLAG FBXO45) were induced with vehicle control or doxycycline (2 μg/mL) for 72 hours followed by IP using FLAG-resin. The whole cell extract (WCE) and IP were immunoblotted with the indicated antibodies. C, HEK293 cells expressing empty vector (EV) or the indicated FLAG-tagged (FBXW1, FBXL1, FBXW2, FBXW4, FBXW5, FBXW7, FBXO45, and FBXO22 F-box proteins) were subjected to IP as indicated and analyzed along with WCE by Western blotting (WB) as indicated. D Splenic GCB cells were isolated, and pooled GCB cells from Cγ1Cretg/+-Fbxo45+/+ and pooled GCB cells from Cγ1Cretg/+-Fbxo45fl/fl transgenic mice were subjected to cycloheximide (CHX) pulse-chase experiments to measure GEF-H1 protein turnover. WCEs were immunoblotted with the indicated antibodies. E,FBXO45 mRNA levels were analyzed by qRT-PCR in BJAB cells stably transduced with two different target shRNA oligos for FBXO45 (****, P < 0.0001). The housekeeping gene GAPDH was used as control. F, BJABNS shRNA (NS) and BJABFBXO45 shRNA #1 and #2 shRNA-expressing cells treated with CHX for given time points were evaluated by WB as indicated. G, BJABNS shRNA and BJABFBXO45 shRNA #1 and #2 shRNA-expressing cells were tested using methylcellulose colony formation assays. Viable colonies after 3 weeks were counted and the data (± SD) from three independent experiments are presented (**, P < 0.01; ***, P < 0.001). H, BJABNS shRNA and BJABFBXO45#2 shRNA cells treated with CHX for given time points were evaluated by WB. The WCE was immunoprecipitated using active RhoA Purification Kit and analyzed for active RhoA. The same WCE was analyzed by WB for GEF-H1, RhoA, and GAPDH. I, The TET-inducible FLAG-tagged FBXO45 (iFLAG-FBXO45) expressing BJAB cells were treated with vehicle or doxycycline (4 μg/mL) as indicated, and the WCE was immunoprecipitated using active RhoA Purification Kit and analyzed for active RhoA. The same WCE was analyzed by WB for GEF-H1, RhoA, FLAG-FBXO45 and GAPDH. (Created with BioRender.com.)
Figure 4.
Figure 4.
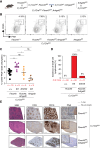
Abnormal expansion of GCB compartment and subsequent lymphomagenesis observed in Fbxo45-deficient mice are reverted by codeletion of Arhgef2. A, Schematic illustration of the strategy used to generate the indicated genotype. Representative flow plots (B) and quantification (C) of GCB cells pregated on live, B220+CD19+ splenic cells from Cγ1Cretg/+-Fbxo45+/+ (n = 10), Cγ1Cretg/+-Fbxo45fl/fl (n = 9), Cγ1Cretg/+-Fbxo45fl/fl; -Arhgef2fl/fl (n = 5), and Cγ1Cretg/+-Arhgef2fl/fl (n = 3) 4–6 months old mice analyzed 10 days after SRBC stimulation as indicated. Numbers in each panel indicate the frequencies of GC, B220+ B-cells depicted by CD95+PNA+ staining. Graphs showing the percentages of GCB cells. Data are representative of three independent experiments. Mann–Whitney unpaired Student’s t test was used for analysis (*, P < 0.05; **, P < 0.01). D, Percent incidences of lymphomagenesis among Cγ1Cretg/+-Fbxo45+/+ (n = 20), Cγ1Cretg/+-Fbxo45fl/fl (n = 20), and Cγ1Cretg/+-Fbxo45fl/fl; Arhgef2fl/fl (n = 11) transgenic mice (****, P < 0.0001). E, IHC staining of Cγ1Cretg/+-Fbxo45+/+, Cγ1Cretg/+-Fbxo45fl/fl, and Cγ1Cretg/+-Fbxo45fl/fl; Arhgef2fl/fl mice as indicated (scale bar, 1 mm). Inset shows PNA at higher magnification (scale bar, 50 μm). H&E, hematoxylin and eosin. (Created with BioRender.com.)
Figure 5.
Figure 5.
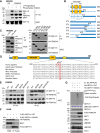
GEF-H1 S644 is critical for the interaction with FBXO45 and GEF-H1 polyubiquitylation. A, 293T cells were transfected with HA-tagged FBXO45 or empty vector (EV). At 48 hours after transfection, WCE was treated with λ-PPase with or without phosphatase inhibitor for 30 minutes and subjected to IP with anti-HA resin followed by blotting with the indicated antibodies. B, Schematic illustration of deletion map of GEF-H1. C, HEK293 cells coexpressing HA-tagged FBXO45 and the indicated V5-tagged truncated GEF-H1 mutants were immunoprecipitated as indicated and analyzed by Western blotting (WB) for the indicated proteins. D, Alignment of the amino acids corresponding to the binding region in human GEF-H1 and other species. A conserved serine 644 residue among GEF-H1 from various species examined (highlighted in red). The numbers indicate the position of the amino acid residue. E, HEK293 cells coexpressing HA-tagged FBXO45 and V5-tagged GEF-H1 WT or GEF-H1 S644A mutant were treated with MG132 (10 μmol/L) for 6 hours, immunoprecipitated with anti-V5 or anti-HA resin, and analyzed by WB for the indicated proteins. F, BJAB cells stably expressing doxycycline-inducible “i” FLAG-tagged GEF-H1 WT and GEF-H1 S644A mutant were transiently transduced with lentiviral particles containing HA-tagged FBXO45. Cells were induced with doxycycline for 72 hours (4 μg/mL) followed by MG132 treatment (10 μmol/L) for 6 hours. WCEs were subjected to IP and analyzed by WB as indicated. G,E. coli purified 10XHistidine tagged-GEF-H1 WT or GEF-H1 S644A mutant was stained by Coomassie brilliant blue (CBB) to validate its purity and was subjected to in vitro ubiquitylation assay using purified UBE2R1, UBE2D3, UBE1, ubiquitin, Mg-ATP, PLK1, and immunopurified FBXO45 E3 ligase complex from HEK293 cells. The reaction was immunoblotted for indicated antibodies. WCE, whole cell extract.
Figure 6.
Figure 6.
In vivo transgenic knock-in of Arhgef2 S644A results in disseminated BCL. A, Schematic illustration of design of constitutional Arhgef2 S644A knock-in transgenic mice in which Arhgef2 S644 WT express WT gene, Arhgef2 S644A +/- is HET knock-in, and Arhgef2 S644A +/+ is HOM knock-in. B, Sanger sequencing chromatogram from Arhgef2 S644 WT (WT) and Arhgef2 S644A +/+ (HOM) knock-in. Serine 644 (S644) encoded by codon “TCC” is mutated to alanine (A) encoded by codon “GCT” resulting in the S644A mutant ARHGEF2 protein. C, Splenic B cells from Arhgef2 S644 WT and Arhgef2 S644A +/+ mice were analyzed after cycloheximide pulse-chase experiment for GEF-H1 protein turnover. GAPDH serves as a loading control. D, Band intensity was measured using ImageJ from three independent experiments and plotted to show GEF-H1 protein turnover. Error bars represent ±SD. (n = 3) *, P < 0.05. E, Percent incidences of lymphomagenesis among Arhgef2 S644 WT, Arhgef2 S644A +/−, and Arhgef2 S644A +/+ knock-in transgenic mice. F, Left, Gross image of the abdominal organs between Arhgef2 S644 WT and Arhgef2 S644A +/+ mice showing enlarged liver in HOM mice; right, representative image of liver, spleen, and intestine compared between Arhgef2 S644 WT and Arhgef2 S644A +/+ mice as indicated. G, IHC staining as indicated. H, Next-generation sequencing analysis of IGHV gene usage to assess clonal populations in Arhgef2 S644A +/+ mice. Scale bare, 1mm. H&E, hematoxylin and eosin.
Figure 7.
Figure 7.
FBXO45 deficiency sensitizes BCL to MAPK pathway inhibition in vitro and in vivo. A,FBXO45 WT or CRISPR-Cas9–mediated FBXO45 KO iBJAB (“i”, doxycycline-inducible Cas9 expression) cells were treated with cycloheximide (CHX), and WCE was analyzed by WB with indicated antibodies. B,FBXO45 WT and KO iBJAB cells were treated with trametinib as indicated, and WCEs were analyzed by WB with the indicated antibodies. C,FBXO45 WT and KO iBJAB cells were xenografted in NSG mice and treated with trametinib as detailed in the “Methods” section. Tumor volumes of mice treated with trametinib for both FBXO45 WT and KO (n = 6 each) were individually measured every 3 days. Experiments were performed in triplicate. D,In vivo imaging studies at day 25 show decreased tumor sizes in response to trametinib treatment in FBXO45 KO xenografts. At the end of the study (day 25), tumors were surgically removed for imaging analysis, as shown in the right panel. E, The top panel shows a schematic illustration of the experimental plan to evaluate trametinib treatment on xenograft tumors originated by FL518-CBG luciferase cells. The bottom panel shows representative BLI at days 1,6, 8 and 13. F, Relative bioluminescence (RLU or relative luminescence units) for each group of mice was measured and plotted for day 13. Two-tailed Mann–Whitney unpaired Student’s t test was used for analysis (**, P < 0.01; ***, P < 0.001; ****, P < 0.0001). G, Kaplan–Meier survival curves of NS shRNA and FBXO45 shRNA expressing FL518-derived lymphoma xenografts in SCID-BEIGE mice. Log-rank (Mantel–Cox) test was used for analysis. WB, Western blotting; WCE, whole cell extract. Dox, doxycycline; ns, not significant.

References

    1. Klein U, Dalla-Favera R. Germinal centres: role in B-cell physiology and malignancy. Nat Rev Immunol 2008;8:22–33. - PubMed
    1. Teras LR, DeSantis CE, Cerhan JR, Morton LM, Jemal A, Flowers CR. 2016 US lymphoid malignancy statistics by World Health Organization subtypes. CA Cancer J Clin 2016;66:443–59. - PubMed
    1. Swerdlow SH, Campo E, Pileri SA, Harris NL, Stein H, Siebert R, et al. . The 2016 revision of the World Health Organization classification of lymphoid neoplasms. Blood 2016;127:2375–90. - PMC - PubMed
    1. Montoto S, Davies AJ, Matthews J, Calaminici M, Norton AJ, Amess J, et al. . Risk and clinical implications of transformation of follicular lymphoma to diffuse large B-cell lymphoma. J Clin Oncol 2007;25:2426–33. - PubMed
    1. Link BK, Maurer MJ, Nowakowski GS, Ansell SM, Macon WR, Syrbu SI, et al. . Rates and outcomes of follicular lymphoma transformation in the immunochemotherapy era: a report from the university of Iowa/MayoClinic Specialized Program of Research Excellence Molecular Epidemiology Resource. J Clin Oncol 2013;31:3272–8. - PMC - PubMed

MeSH terms

Substances

LinkOut - more resources