

Assessing the Risks of Potential Pathogens and Antibiotic Resistance Genes Among Heterogeneous Habitats in a Temperate Estuary Wetland: a Meta-analysis
- PMID: 39820498
- PMCID: PMC11739316
- DOI: 10.1007/s00248-024-02484-y
Assessing the Risks of Potential Pathogens and Antibiotic Resistance Genes Among Heterogeneous Habitats in a Temperate Estuary Wetland: a Meta-analysis
Abstract
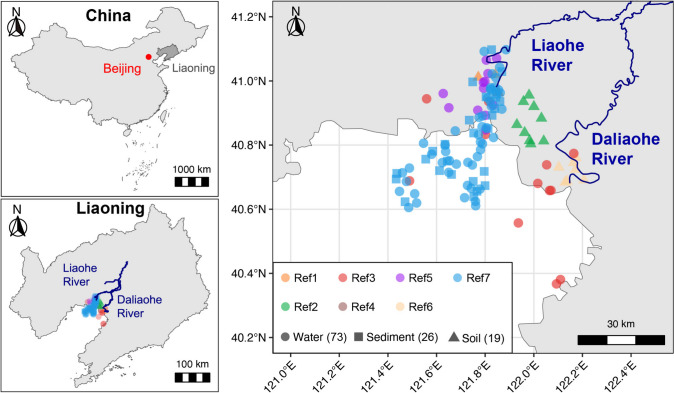
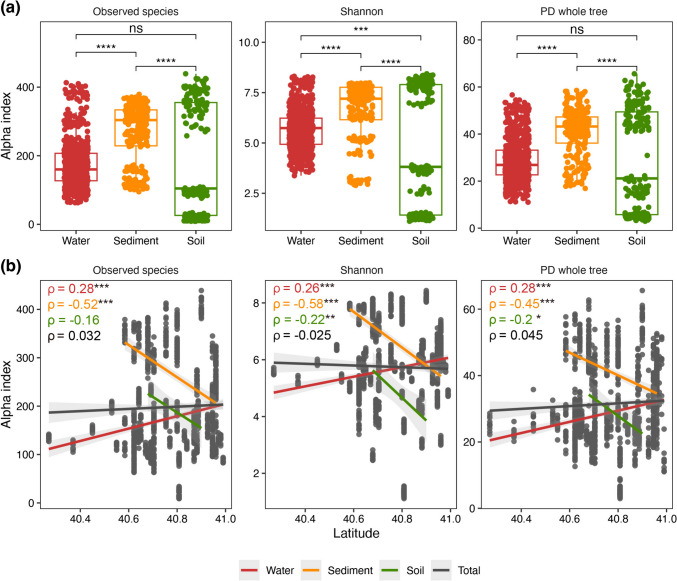
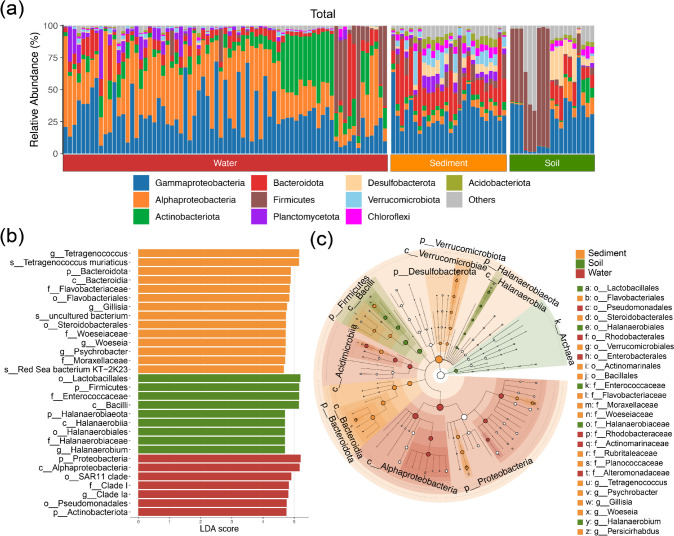
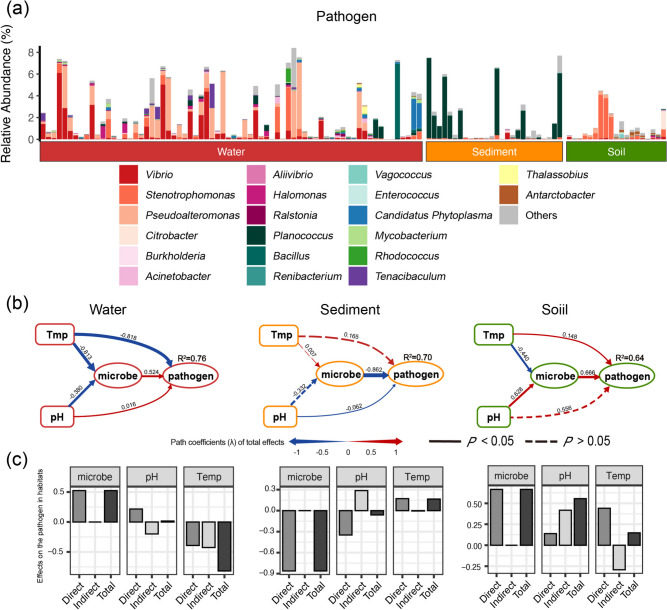
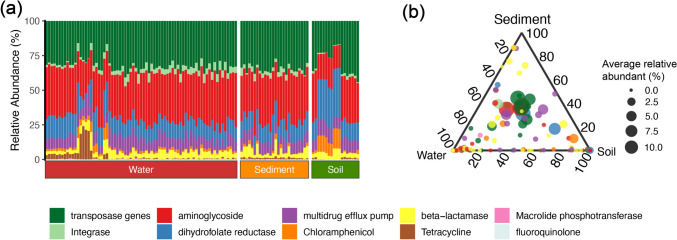
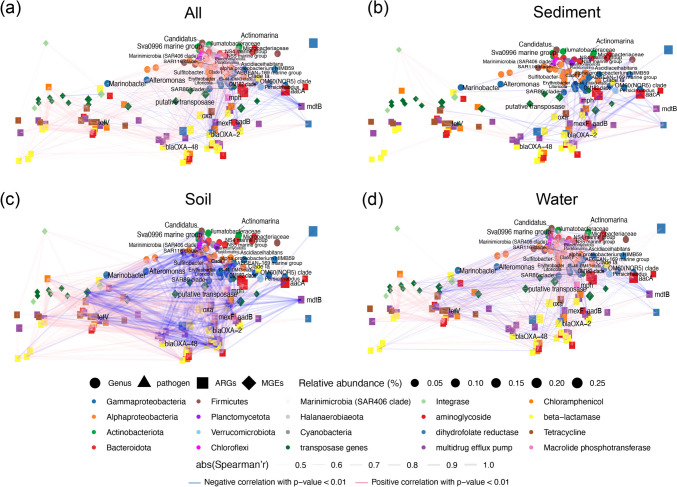
Temperate estuary wetlands act as natural filters for microbiological contamination and have a profound impact on "One Health." However, knowledge of microbiological ecology security across the different habitats in temperate estuarine wetlands remains limited. This study employed meta-analysis to explore the characteristics of bacterial communities, potential pathogens, and antibiotic resistance genes (ARGs) across three heterogeneous habitats (water, soil, and sediment) within the Liaohe Estuary landscape. The diversity and composition of the three bacterial communities differed with biogeography, temperature, and pH, with the highest α-diversity showing a significantly negative correlation along latitude in soil. Furthermore, aminoglycosides were significantly enriched in water and soil, while dihydrofolate was more likely to be enriched in soil. The potential pathogens, Pseudoalteromonas and Planococcus, were dominant in water and sediment, while Stenotrophomonas was the dominant bacterium in soil. The network topology parameter revealed interspecific interactions within the community. PLS-PM highlights the main direct factors affecting the abundance of potential pathogens and the spread of ARGs, while temperature and pH indirectly influence these potential pathogens. This study advances our understanding of bacterial communities in estuarine wetlands, while highlighting the need for effective monitoring to mitigate the risks associated with potential pathogens and ARGs in these ecosystems.
Keywords: Antibiotic resistance genes; Biogeography; Co-occurrence; Potential pathogens; Risk assessment; Temperate estuary.
© 2025. The Author(s).
Conflict of interest statement
Declarations. Consent to Participate: Informed consent was obtained from all individual participants included in the study. Competing Interests: The authors declare no competing interests.
Figures

Similar articles
-
Prevalence and proliferation of antibiotic resistance genes in the subtropical mangrove wetland ecosystem of South China Sea.Microbiologyopen. 2019 Nov;8(11):e871. doi: 10.1002/mbo3.871. Epub 2019 Jun 28. Microbiologyopen. 2019. PMID: 31251470 Free PMC article.
-
Flooding promotes the coalescence of microbial community in estuarine habitats.Mar Environ Res. 2024 Nov;202:106735. doi: 10.1016/j.marenvres.2024.106735. Epub 2024 Sep 3. Mar Environ Res. 2024. PMID: 39241542
-
[Co-occurrence of Tetracycline Antibiotic Resistance Genes and Microbial Communities in Plateau Wetlands Under the Influence of Human Activities].Huan Jing Ke Xue. 2023 Jan 8;44(1):169-179. doi: 10.13227/j.hjkx.202203109. Huan Jing Ke Xue. 2023. PMID: 36635805 Chinese.
-
Variability of faecal microbiota and antibiotic resistance genes in flocks of migratory gulls and comparison with the surrounding environment.Environ Pollut. 2024 Oct 15;359:124563. doi: 10.1016/j.envpol.2024.124563. Epub 2024 Jul 15. Environ Pollut. 2024. PMID: 39019307
-
Better ecosystem resistibility but with severer risk deriving from potential pathogens and antibiotic resistances in marine sediments adjacent to Yellow River estuary under oil contamination.Environ Res. 2025 Jul 1;276:121486. doi: 10.1016/j.envres.2025.121486. Epub 2025 Mar 26. Environ Res. 2025. PMID: 40147517
References
-
- Murray NJ, Worthington TA, Bunting P, Duce S, Hagger V, Lovelock CE, Lucas R, Saunders MI, Sheaves M, Spalding M et al (2022) High-resolution mapping of losses and gains of Earth’s tidal wetlands. Science 376:744–749. 10.1126/science.abm9583 - PubMed
-
- Wang X, Xiao X, Zhang X, Wu J, Li B (2023) Rapid and large changes in coastal wetland structure in China’s four major river deltas. Glob Change Biol 29:2286–2300. 10.1111/gcb.16583 - PubMed
-
- Ferreira LMR, Esteves LS, de Souza EP, dos Santos CAC (2019) Impact of the urbanisation process in the availability of ecosystem services in a tropical ecotone area. Ecosystems 22:266–282. 10.1007/s10021-018-0270-0
-
- McKinney ML (2002) Urbanization, biodiversity, and conservation: the impacts of urbanization on native species are poorly studied, but educating a highly urbanized human population about these impacts can greatly improve species conservation in all ecosystems. Bioscience 52:883–890. 10.1641/0006-3568(2002)052[0883:UBAC]2.0.CO;2
-
- Crump BC, Bowen JL (2024) The microbial ecology of estuarine ecosystems. Annu Rev Mar Sci 16:335–360. 10.1146/annurev-marine-022123-101845 - PubMed
Publication types
MeSH terms
Substances
Grants and funding
- H2022011/Horizontal scientific research project (microbial-enhanced treatment of petroleum hydrocarbon pollutants: technical and engineering demonstration)
- 32303039/National Natural Science Foundation of China
- 2021DG700024-KF202425/State Key Laboratory for Managing Biotic and Chemical Threats to the Quality, Safety of Agro-products
- 30501466/Top-Notch Talents Program of Henan Agricultural University
- 242102111013/Henan Province Science and Technology Key Project
LinkOut - more resources
Full Text Sources
Medical
