. 2025 Mar 17;31(6):1002-1015.
doi: 10.1158/1078-0432.CCR-24-1934.

An Exosome-Based Liquid Biopsy Predicts Depth of Response and Survival Outcomes to Cetuximab and Panitumumab in Metastatic Colorectal Cancer: The EXONERATE Study

Affiliations

An Exosome-Based Liquid Biopsy Predicts Depth of Response and Survival Outcomes to Cetuximab and Panitumumab in Metastatic Colorectal Cancer: The EXONERATE Study

Caiming Xu et al. Clin Cancer Res. .

Abstract

Purpose: The EXOsome and cell-free miRNAs of anti-EGFR ResistAnce (EXONERATE) study was an open-label, biomarker interventional study designed to develop, test, and validate a liquid biopsy predictive of progression-free survival (PFS), overall survival (OS), and objective response rate (ORR) for first-line EGFR inhibitors in metastatic colorectal cancer (mCRC).

Patients and methods: Patients with newly diagnosed RAS wild-type, chemotherapy-naïve mCRC, both right- and left-sided, were enrolled in two nationwide trials to receive cetuximab or panitumumab along with chemotherapy. The primary endpoint was 12-month PFS, which was hierarchically tested in left- and right-sided mCRCs to predict PFS, OS, and ORR.

Results: Genome-wide small RNA sequencing identified 12 cell-free and 14 exosomal candidates that were differentially expressed in both plasma and tumor tissue of good versus poor responders (based on PFS <12 months). The 8 and 9 best performing candidates, respectively, were used to generate the EXONERATE assay. In left-sided mCRC, 65% were EXONERATE-high, correlating with shorter median PFS (9.5 vs. 18.5 months; P < 0.001). In the independent right-sided mCRC cohort, 80.8% were EXONERATE-high and experienced a similarly shorter median PFS (8.6 vs. 41.2 months; P = 0.0004). In the right-sided group, EXONERATE predicted PFS ≥12 months with 100% sensitivity. A linear relationship existed between EXONERATE values and response depth. Multivariate analysis revealed that EXONERATE predicts PFS and OS independently of tumor sidedness.

Conclusions: The EXONERATE assay robustly predicted PFS and OS outcomes in patients with mCRC, both right- and left-sided, before they received either panitumumab or cetuximab. It stratified PFS, OS, and ORR better than a right versus left approach.


Conflict of interest statement

Conflicts of Interest: The authors report no competing interests.

Figures
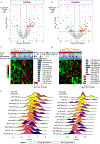
Figure 1.
Figure 1.. Discovery strategy.
(A,B) Volcano plots depict cf-miRNAs (A) and exo-miRNAs (B) that are significantly over-expressed (red) or under-expressed (blue) in patients with a good response to EGFR inhibitors; (C,D) Heatmaps depict unsupervised clustering of cf-miRNAs (C) and exo-miRNAs (D) based on their differential gene expression of the selected 12 cf-miRNA and 14 exo-miRNA candidates; (E) Ridge-line plots depict the normalized distribution of the expression levels of cf-miRNAs (left) and exo-miRNAs (right) in good vs. poor responders. Candidates are ranked based on the absolute differential gene expression (higher differences in the foreground, lower differences in the background).
Figure 2.
Figure 2.. Assay development and optimization.
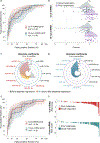
(A) ROC curves with confidence intervals for the 12-cf-miRNA and 14-exo-miRNA panels after machine-learning training; (B) Rain-cloud plots with overlapping box and whisker plots depict the normalized risk score of the 12-cf-miRNA panel (top) and the 14-exo-miRNA panel (bottom); (C, D) Spider-web plots depicting the absolute coefficients of the logistic regression model for the cf-miRNA (C) and exo-miRNA (D) panels before and after stepwise regression (grey-scaled and colored, respectively) to optimize the assay using only the best-performing candidates; (E) ROC curves with 95% confidence intervals for the best-performing 8-cf-miRNA and 9-exo-miRNA panels (F) Waterfall plots of the normalized risk scores for the 8-cf-miRNA (top) and 9-exo-miRNA panels (bottom) for good responders (colored) and poor responders (grey).
Figure 3.
Figure 3.. EXONERATE assay performance in left-sided mCRC.
(A) Violin plots with overlapping box and whisker plots depict the distribution of the EXONERATE risk score in good (red) vs. poor (blue) responders; (B) ROC curves with 95% confidence intervals for the EXONERATE panel; (C) Kaplan-Maier progression-free survival curves for EXONERATE-high (red) and EXONERATE-low (blue) patients; (D) Net benefit of a treatment algorithm based on the EXONERATE assay (azure), 8-cf-miRNA (red), 9-exo-miRNA (olive), and a treat-all approach (black dashed) for left-sided mCRC; (E) Decision Curve Analysis demonstrating the number of unnecessary treatments avoided in left-sided mCRC using a treatment algorithm based on the EXONERATE assay.
Figure 4.
Figure 4.. EXONERATE assay performance in right-sided mCRC.
(A) ROC curve for the EXONERATE assay in patients with mCRC originating from the right side; (B) Confusion matrix demonstrating the accuracy of the EXONERATE assay in predicting PFS benefit in patients with mCRC receiving EGFR inhibitors in first-line; (C) Swimmers plot demonstrating the PFS (horizontal bars) and OS (horizontal lines) in EXONERATE-high (grey) and EXONERATE-low (blue) right-sided mCRC. The grey vertical dashed line indicates 12 months; (D) Kaplan-Maier progression-free survival curves for EXONERATE-high (grey) and EXONERATE-low (blue) patients with right-sided mCRC.
Figure 5.
Figure 5.. EXONERATE assay and response to anti-EGFR treatment.
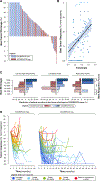
(A) The waterfall plot depicts the maximum tumor shrinkage achieved during anti-EGFR treatment from baseline measurement; (B) The scatter plot represents the EXONERATE value vs. the maximum tumor response achieved during anti-EGFR treatment from baseline measurement; (C) The inverted bar chart represents the prevalence of patients achieving complete response (100%), deep partial response (70–99%), moderate partial response (50–69%), mild partial response (30–49%), stable disease (−20; 30%), or progressive disease (<−20%) in patients considered EXONERATE-high (red) vs. EXONERATE-low (blue); the analyses were conducted in the complete data set (left) as well as in the subset of patients with left- and right-sided mCRC (center and right, respectively); (D) The spider plot represents the tumor shrinkage reached at each imaging evaluation during the treatment administration for each patient. Lines are color-coded based on the maximum depth of response achieved by the individual patient at any point during the trial.

References

    1. Siegel RL, Wagle NS, Cercek A, et al. Colorectal cancer statistics, 2023. CA Cancer J Clin 2023;73(3):233–54. doi: 10.3322/caac.21772 - DOI - PubMed
    1. Murphy CC, Harlan LC, Lund JL, et al. Patterns of Colorectal Cancer Care in the United States: 1990–2010. J Natl Cancer Inst 2015;107(10) doi: 10.1093/jnci/djv198 - DOI - PMC - PubMed
    1. Kopetz S, Chang GJ, Overman MJ, et al. Improved survival in metastatic colorectal cancer is associated with adoption of hepatic resection and improved chemotherapy. Journal of clinical oncology 2009;27(22):3677. - PMC - PubMed
    1. Piawah S, Venook AP. Targeted therapy for colorectal cancer metastases: A review of current methods of molecularly targeted therapy and the use of tumor biomarkers in the treatment of metastatic colorectal cancer. Cancer 2019;125(23):4139–47. - PubMed
    1. Venook AP, Niedzwiecki D, Innocenti F, et al. Impact of primary (1°) tumor location on overall survival (OS) and progression-free survival (PFS) in patients (pts) with metastatic colorectal cancer (mCRC): Analysis of CALGB/SWOG 80405 (Alliance): American Society of Clinical Oncology, 2016.

MeSH terms