. 2025 Mar;22(3):499-509.
doi: 10.1038/s41592-024-02558-2. Epub 2025 Jan 16.

Enhanced sensitivity and scalability with a Chip-Tip workflow enables deep single-cell proteomics

Affiliations

Enhanced sensitivity and scalability with a Chip-Tip workflow enables deep single-cell proteomics

Zilu Ye et al. Nat Methods. 2025 Mar.

Abstract

Single-cell proteomics (SCP) promises to revolutionize biomedicine by providing an unparalleled view of the proteome in individual cells. Here, we present a high-sensitivity SCP workflow named Chip-Tip, identifying >5,000 proteins in individual HeLa cells. It also facilitated direct detection of post-translational modifications in single cells, making the need for specific post-translational modification-enrichment unnecessary. Our study demonstrates the feasibility of processing up to 120 label-free SCP samples per day. An optimized tissue dissociation buffer enabled effective single-cell disaggregation of drug-treated cancer cell spheroids, refining overall SCP analysis. Analyzing nondirected human-induced pluripotent stem cell differentiation, we consistently quantified stem cell markers OCT4 and SOX2 in human-induced pluripotent stem cells and lineage markers such as GATA4 (endoderm), HAND1 (mesoderm) and MAP2 (ectoderm) in different embryoid body cells. Our workflow sets a benchmark in SCP for sensitivity and throughput, with broad applications in basic biology and biomedicine for identification of cell type-specific markers and therapeutic targets.


Conflict of interest statement

Competing interests: D.B.B.-J. and N.B. are employees of Evosep Biosystems. D.H., F.I. and A.S. are employees of Cellenion SASU. H.H., M.H. and X.L. are employees of Thermo Fisher Scientific. The other authors declare no competing interests.

Figures

Fig. 1
Fig. 1. Workflow and results of Chip-Tip SCP.
a, Schematic of the Chip-Tip workflow. b, Number of proteins identified in single, 10, 20 and 40 HeLa cells using variable nDIA settings. c, Number of peptides identified in single, 10, 20 and 40 HeLa cells using variable nDIA settings. d, Protein sequence coverage percentages for single-, 10- and 20-cell samples. For the boxplots, the lower and upper hinges correspond to the first and third quartiles. The upper whisker extends from the hinge to the largest value no further than 1.5× IQR from the hinge (where IQR is the inter-quartile range). The lower whisker extends from the hinge to the smallest value at most 1.5× IQR of the hinge. e, Distribution of iBAQ values showing quantification range and consistency across different cell counts. f, Overview of protein localization across cellular compartments. Spectronaut (v.18) was used for the search. Panel a was created with BioRender.com. Source data
Fig. 2
Fig. 2. Evaluating the carrier proteome effect in SCP.
a, Protein identifications in single-cell samples using DIA-NN with and without MBR feature, compared across various nDIA methods. b, Protein identifications in single-cell samples with and without carrier proteomes in Spectronaut. c, Trend analysis showing the increase in protein identifications when single-cell data is searched with a growing number of single-cell files and with carrier proteomes in Spectronaut. d, Histogram illustrating the distribution of protein abundances identified across different search strategies, highlighting the advantage of carrier proteomes in detecting low-abundance proteins. e, Venn diagram comparing protein identifications in two single-cell samples in DIA-NN and Spectronaut. f, Venn diagram of protein identifications comparing two 20-cell samples using DIA-NN and Spectronaut. g, Scatter plot displaying the quantification correlation of proteins identified between two single-cell runs in DIA-NN. h, Scatter plot displaying the quantification correlation of proteins identified between two single-cell runs in Spectronaut. i, Scatter plot presenting the quantification correlation between Spectronaut and DIA-NN for the same single-cell sample, with correlation coefficients indicating the degree of agreement. In e and gi, 08 and 09 are two different HeLa cells of similar sizes. Source data
Fig. 3
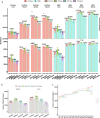
Fig. 3. Faster LC methods and FAIMS further enhance SCP performance.
a, Protein identifications in single-cell samples and blank samples using 40SPD, 80SPD and 120SPD Whisper Zoom methods in Evosep One LC. b, Representative total ion current at MS2 level of single-cell samples using 40SPD, 80SPD and 120SPD methods in Evosep One. c, Protein identifications in single-cell samples and blank samples using Vanquish Neo with FAIMS Pro Duo interface. d, Representative total ion chromatogram (TIC) at MS2 level of a single cell and a blank sample. In c and d, individual HeLa cell samples were prepared in a 96-well plate and directly injected into an Orbitrap Astral mass spectrometer coupled with FAIMS Pro Duo interface and Vanquish Neo LC system. Samples were analyzed in a 14-min gradient method. Source data
Fig. 4
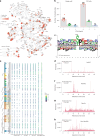
Fig. 4. PTM profiling in SCP.
a, Kinome tree representation showing the quantification of 168 kinases across major kinase families in single cells, with node color and size indicating iBAQ abundances. b, Bar graph depicting the number of phosphosites identified for serine (S), threonine (T) and tyrosine (Y) residues in single- and 20-cell samples. c, Sequence logo analysis illustrating the most common phosphorylation motifs identified in single-cell samples. d, XIC of immonium ion for phosphor-Tyr (m/z 216.0426) across the LC elution profile. e, Visualization of the glycogenes identified in single cells. f, XIC of oxonium ion for HexNAc (m/z 204.087) indicating glycan presence in the MS2 spectra. g, XIC of oxonium ion for NeuAc (m/z 274.092) reflecting glycan abundance in the MS2 spectra. h, XIC of oxonium ion for the disaccharide Hex-HexNAc (m/z 366.139) reflecting glycan abundance in the MS2 spectra. Source data
Fig. 5
Fig. 5. Analysis of the 5-FU impact on spheroid cells using Chip-Tip.
a, Comparative images illustrating the morphological changes in spheroids untreated and treated with 5-FU, showing increased disintegration and cell detachment in treated spheroids over time. The experiment was performed once. Scale bars, 500 μm. b, Metabolic pathway diagram of 5-FU indicating the downregulation of NME1 and upregulation of TYMP, proteins integral to the metabolism and activation of 5-FU. c, Hierarchical clustering of GO terms related to cellular processes affected by 5-FU treatment, highlighting the involvement of cyclase cytoplasmic activity and ribose purine synthesis in its action mechanism. d, UpSet plot of the top GO terms, and its associated grouped mechanisms, post-5-FU treatment, detailing the upregulation and downregulation of biological processes associated with 5-FU treatment. The horizontal line in the boxplots represent the median, 25th and 75th percentiles and whiskers represent measurements to the 5th and 95th percentiles. e, Heatmap of protein alterations across identified GO terms.
Fig. 6
Fig. 6. Single-cell analysis of EB induction from hiPSCs.
a, EB induction from hiPSCs. b, PCA of normalized protein abundances in hiPSCs and EB cells. Points corresponding to single cells are colored according to the abundance of specific markers (OCT4, SOX2, GATA4, HAND1 and MAP2) normalized to the median abundance in all samples. n = 12 for hiPSCs and n = 50 for EB cells. c, Abundance of OCT4 and SOX2 divided by the median abundance in hiPSCs. The horizontal line in the boxplots represent the median, 25th and 75th percentiles and whiskers represent measurements to the 5th and 95th percentiles. The P values were calculated using a two-sided Student t-test and no adjustments were made for multiple comparisons. P < 0.05 was considered as significant. n = 12 for hiPSCs and n = 53 for EB cells. d, Unsupervised hierarchical clustering using canberra and ward.D2 methods of proteins that shows significant regulation (P < 0.05 from ANOVA) between cell clusters (1–6) (left). GO biological processes enrichment analysis of the protein clusters from the heatmap (right). n = 12 for hiPSCs and n = 53 for EB cells. ER, endoplasmic reticulum. Source data
Extended Data Fig. 1
Extended Data Fig. 1. Examples of each step in the SCP workflow.
a) Example of a droplet in cellenONE. This is used in buffer dispensing. b) Example of an isolated HeLa cell in cellenONE. c) Picture of a proteoCHIP EVO 96. This is the picture taken after the sample transfer from the chip to Evotips. d) Example of a total ion current (TIC) and an MS/MS spectrum in a single cell sample.
Extended Data Fig. 2
Extended Data Fig. 2. iBAQ distribution of the single cell proteome.
a) Distribution of the iBAQ values a single cell sample, with labels indicating some of the highest and lowest abundant proteins. b) Gene ontology enrichment analysis specifically focusing on the 1500 proteins with the lowest abundance. P values were calculated using a one-sided Fisher’s Exact Test and subsequently adjusted using the Benjamini-Hochberg (BH) correction method.
Extended Data Fig. 3
Extended Data Fig. 3. Carrier proteome effect in label-free single cell proteomics.
a) Number of proteins and precursors identified in the HeLa samples in DIA-NN. b) Number of modified peptides identified in the single cell HeLa samples in Spectronaut. c) Trend analysis showing the numbers in peptide identifications when single-cell data is searched with different number of single-cell files and with carrier proteomes in Spectronaut.
Extended Data Fig. 4
Extended Data Fig. 4. Error rate estimation in single cell proteomics through entrapment analysis.
(a-b) Number of proteins identified in SCP using a 1x mimic database using Spectronaut (a) and DIA-NN (b). (c-d) Density plot for the distribution of PG.Qvalues of false and target identifications in single-cell samples using Spectronaut (c) and DIA-NN (d). Note, raw files were searched in Spectronaut with Method Evaluation option checked, and the first pass results were used from DIA-NN.
Extended Data Fig. 5
Extended Data Fig. 5. Number of phosphosites identified using the Vanquish Neo and FAIMS approach.
Bar and dot plots showing the number of phosphosites on different residues identified in single HeLa cell samples. The single cell samples were prepared and analyzed using the Vanquish Neo and FAIMS approach.
Extended Data Fig. 6
Extended Data Fig. 6. Analysis of the phosphosites using Chip-Tip method.
(a-b) Identifications of phosphoproteins (a) and phosphosites (b) in the single cell and 20-cell samples. (c) Identified phosphosites per protein in single cell samples. (d) GO enrichment analysis of the phosphoproteins in the single cell samples. (e-f) UpSet plot of the identified phosphosites in single cell (e) and 20-cell (f) samples.
Extended Data Fig. 7
Extended Data Fig. 7. Number of proteins and peptides quantified in single cells from EBs and hiPSCs and changes in SBDS abundance.
a) Number of proteins. b) Number of peptides. The horizontal line in the boxplots represent the median, 25th and 75th percentiles and whiskers represent measurements to the 5th and 95th percentiles. n = 12 for hiPSCs and n = 50 for EB cells. c) Example of a large EB cell (top) compared to a HeLa cell (bottom) before dispensing with cellenONE. d) Principal component analysis of normalized protein abundances in hiPSCs and EB cells. Points corresponding to single cells are colored according to the abundance of SBDS protein normalized to the median abundance in all samples as in Fig. 6b. Source data

References

    1. Consortium, T. S. et al. The Tabula Sapiens: a multiple-organ, single-cell transcriptomic atlas of humans. Science376, eabl4896 (2022). - PMC - PubMed
    1. Chen, G., Ning, B. & Shi, T. Single-cell RNA-seq technologies and related computational data analysis. Front. Genet.10, 317 (2019). - PMC - PubMed
    1. Kulkarni, A., Anderson, A. G., Merullo, D. P. & Konopka, G. Beyond bulk: a review of single cell transcriptomics methodologies and applications. Curr. Opin. Biotechnol.58, 129–136 (2019). - PMC - PubMed
    1. Labib, M. & Kelley, S. O. Single-cell analysis targeting the proteome. Nat. Rev. Chem.4, 143–158 (2020). - PubMed
    1. Zhu, Y. et al. Nanodroplet processing platform for deep and quantitative proteome profiling of 10–100 mammalian cells. Nat. Commun.9, 882 (2018). - PMC - PubMed

LinkOut - more resources