. 2025 Mar;22(3):510-519.
doi: 10.1038/s41592-024-02559-1. Epub 2025 Jan 16.

Challenging the Astral mass analyzer to quantify up to 5,300 proteins per single cell at unseen accuracy to uncover cellular heterogeneity

Affiliations

Challenging the Astral mass analyzer to quantify up to 5,300 proteins per single cell at unseen accuracy to uncover cellular heterogeneity

Julia A Bubis et al. Nat Methods. 2025 Mar.

Abstract

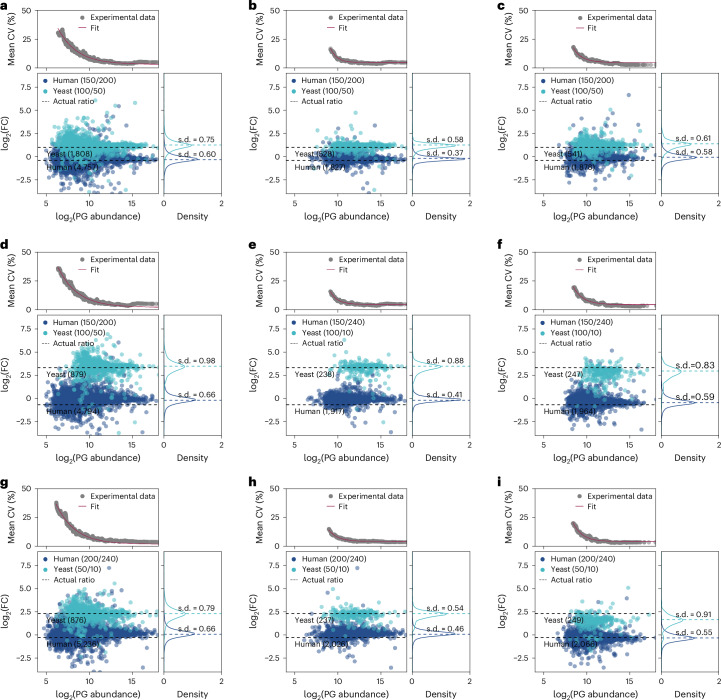
Despite significant advancements in sample preparation, instrumentation and data analysis, single-cell proteomics is currently limited by proteomic depth and quantitative performance. Here we demonstrate highly improved depth of proteome coverage as well as accuracy and precision for quantification of ultra-low input amounts. Using a tailored library, we identify up to 7,400 protein groups from as little as 250 pg of HeLa cell peptides at a throughput of 50 samples per day. Using a two-proteome mix, we check for optimal parameters of quantification and show that fold change differences of 2 can still be successfully determined at single-cell-level inputs. Eventually, we apply our workflow to A549 cells, yielding a proteome coverage ranging from 1,801 to a maximum of >5,300 protein groups from a single cell depending on cell size and search strategy used, which allows for the study of dependencies between cell size and cell cycle phase. Additionally, our workflow enables us to distinguish between in vitro analogs of two human blastocyst lineages: naive human pluripotent stem cells (epiblast) and trophectoderm-like cells. Our data harmoniously align with transcriptomic data, indicating that single-cell proteomics possesses the capability to identify biologically relevant differences within the blastocyst.


Conflict of interest statement

Competing interests: T.N.A., E.D. and B.D. are employees of Thermo Fisher Scientific. The other authors declare no competing interests.

Figures

Fig. 1
Fig. 1. Finding optimal parameters to maximize PG IDs and maintain data quality.
ah, Two hundred and fifty picograms of HeLa (ad) or K562 (eh) cell peptides from diluted bulk digests were injected. Peptides were separated using a gradient of altered length ranging from throughputs of 30 to 80 SPD. Data were recorded in DIA mode on an Orbitrap Astral mass spectrometer. Circles in a and e indicate identified PGs or precursors at a 1% FDR in individual replicates, bars indicate their means, and error bars indicate standard deviation with n = 3 technical replicates. Dots in b and f indicate the obtained median CV on protein levels for each gradient length for DirectDIA+ analysis when performing quantification at the MS1 or MS2 level, respectively. Dots in c and g indicate the median number of data points per precursor that were used for quantification (DirectDIA+) for each gradient length at the MS1 or MS2 level, respectively, as well as the median full-width at half-maximum (FWHM) of elution peaks. Different search strategies on 250 pg of HeLa (d) and K562 (h) 50 SPD data at a 1% FDR and default settings or optimized settings (OS) were compared. The last bar ‘Library 10 ng’ corresponds to the tailored library itself that we used for a library search (LS) of 250-pg runs. i,j, For FDR assessment, data were analyzed in method evaluation mode at a 1% FDR using default settings against a target (that is, the human proteome), a shuffled target (that is, a shuffled human proteome; i) or a C. elegans database (j). Venn plots show the overlap of peptides between target and shuffled or entrapment databases, respectively. k, Bars indicate means of identified PGs in the target database (top) and false-positive PGs (FP PG) from the shuffled target or C. elegans database (bottom). Error bars indicate standard deviation with n = 3 technical replicates. DB, database. Source data
Fig. 2
Fig. 2. Tuning coverage and signal to noise by FAIMS.
ag, Two hundred and fifty picograms of HeLa cell peptides from diluted bulk digests were injected. Peptides were separated at a throughput of 50 SPD; n = 3 technical replicates. Data were recorded with or without the FAIMS Pro interface unit attached and at the given compensation voltage. Circles in a indicate identified PGs or precursors at a 1% FDR in individual replicates, bars indicate their means, and error bars indicate standard deviations. Dots in b indicate the median CV at the protein level when performing quantification at the MS1 or MS2 level using Spectronaut 18 (DirectDIA+). Dots in c indicate the median number of data points recorded per precursor when performing at the MS1 or MS2 level as indicated (DirectDIA+). The log2 abundance ranks and their density plots for PGs (d) and precursors (e) are shown. The Venn diagrams show the number of PGs (f) or peptides (g) quantified in one representative replicate each using either no FAIMS or FAIMS with a compensation voltage of –48 V or –58 V. Source data
Fig. 3
Fig. 3. Human–yeast proteome mix to assess quantitative performance.
ai, From diluted bulk digests, 250 pg of two-proteome mixes consisting of 150 pg of HeLa + 100 pg of yeast, 200 pg of HeLa + 50 pg of yeast and 240 pg of HeLa + 10 pg of yeast were injected. Peptides were separated at a throughput of 50 SPD. Data were recorded in DIA mode using optimal, but not the same, settings for the Orbitrap Astral mass spectrometer and Orbitrap Exploris 480 mass spectrometer and analyzed using DirectDIA+ in Spectronaut 18 at a 1% FDR. Quantification was performed at the MS1 level. Dots within the Bland–Altman plots (bottom) represent proteins with given log2 average PG abundance and log2 fold change of abundance across both proteome mixes. Density plots (right) depict the distribution of measured log2 fold change (FC) values, and CV diagrams (top) show the local CV of 100 proteins quantified with a rolling window over the entire abundance range; n = 3 technical replicates. For the Orbitrap Astral mass spectrometer, all quantified proteins (a, d and g) or only those proteins that were commonly quantified using the Orbitrap Exploris 480 mass spectrometer (b, e and h) are shown. For the Orbitrap Exploris 480 mass spectrometer, all quantified proteins are shown (c, f and i). Source data
Fig. 4
Fig. 4. Heterogeneity of single A549 and H460 epithelial-like human lung cancer cells.
af, Individual cells of 20–30 µm in diameter were prepared using the One-Pot workflow and analyzed at 50 SPD using the previously optimized settings for LC and MS on the Orbitrap Astral mass spectrometer. First, A549 and H460 cells were analyzed. In a, circles indicate identified PGs or precursors at a 1% FDR of each individual cell, bars indicate mean values, and error bars indicate standard deviations. The search was performed library free with matching across biological replicates but not across all samples; n = 20 individual cells for each cell type. The PCA (b) was based on protein quantities, with each dot representing a cell or blank sample, and heat map clustering (c) was performed with each column representing a cell or blank sample and color codes depicting relative protein abundance. In total, n = 66 A549 cells in predefined size groups of 15–20 µm, 20–25 µm or 25–30 µm in diameter were analyzed (df). In d, circles indicate identified PGs at a 1% FDR of each individual cell, bars indicate the mean values, and error bars indicate standard deviations. The search was performed library free in method evaluation mode, DirectDIA+ or DirectDIA+ optimized settings or against a tailored library created from three replicates of 20 or 40 cells. The PCA (e) and UMAP (f) are based on protein quantities (DirectDIA+ analysis) of the 66 A549 cells, with each dot representing a cell and colors reflecting the actual cell size as determined by the camera system of the cellenONE. All samples (af) were prepared and measured in the exact same way. Blanks were processed in the same 384-well plate and contained all reagents and buffers but no cells. Source data
Fig. 5
Fig. 5. Analysis of single TE and hPS cells.
Individual cells were isolated using FACS into a 384-well plate. Digested cells were analyzed at 50 SPD using the optimized settings for LC and MS on the Orbitrap Astral mass spectrometer. a, Circles indicate identified PGs at a 1% FDR of each individual cell, bars indicate the mean values, and error bars indicate standard deviations. The dataset contains 21 and 12 individual hPS cells and TE-like cells, respectively. The search was performed library free in method evaluation mode or DirectDIA+ or against a tailored library created from three replicates of 100 cells each prepared in the exact same way but recorded with adopted settings (that is, 60 ms IT and m/z 20 windows for single cells, 10 ms IT and m/z 5 windows for 100 cells). Blanks (n = 4) were processed in the same 384-well plate and contained all reagents and buffers but no cells. b,c, The PCA (b) and UMAP (c) are based on protein quantities, with each dot representing a cell and colors reflecting the cell type based on fluorescent marker proteins. Source data
Extended Data Fig. 1
Extended Data Fig. 1. PCA & UMAP of A549 cells with relative abundancies of selected cell-cycle specific proteins color coded.
an, Individual A549 cells were prepared using the One-Pot workflow. Digested cells were analyzed at 50 SPD using the previously optimized settings for LC and MS on the Orbitrap Astral MS. The color scale bars depict the log2-transformed protein abundance. PCA (a-g) and UMAP (h-n) are based on protein quantities with each dot representing a cell and colors reflecting the relative abundance of the protein given. Source data
Extended Data Fig. 2
Extended Data Fig. 2. PCA & UMAP of hPSC & TE cells with relative abundancies of selected cell-type specific proteins color coded.
ap, Individual hPSC and TE cells were prepared in a 384-well plate using the FACS. Digested cells were analyzed at 50 SPD using the previously optimized settings for LC and MS on the Orbitrap Astral MS. PCA on protein quantities with each dot representing a cell and colors reflecting the relative abundance of the protein given. The color bar corresponds to log2-transformed protein abundance. Selected markers of TE cells (a-l) and hPSC (m-p). Source data

References

    1. Budnik, B., Levy, E., Harmange, G. & Slavov, N. SCoPE-MS: mass spectrometry of single mammalian cells quantifies proteome heterogeneity during cell differentiation. Genome Biol.19, 161 (2018). - PMC - PubMed
    1. Leduc, A., Huffman, R. G., Cantlon, J., Khan, S. & Slavov, N. Exploring functional protein covariation across single cells using nPOP. Genome Biol.23, 261 (2022). - PMC - PubMed
    1. Ctortecka, C. et al. An automated nanowell-array workflow for quantitative multiplexed single-cell proteomics sample preparation at high sensitivity. Mol. Cell. Proteomics22, 100665 (2023). - PMC - PubMed
    1. Zhu, Y. et al. Proteomic analysis of single mammalian cells enabled by microfluidic nanodroplet sample preparation and ultrasensitive NanoLC–MS. Angew. Chem. Int. Ed.57, 12370–12374 (2018). - PMC - PubMed
    1. Liang, Y. et al. Fully automated sample processing and analysis workflow for low-input proteome profiling. Anal. Chem.93, 1658–1666 (2021). - PMC - PubMed

LinkOut - more resources