. 2025 Jan 16;11(1):18.
doi: 10.1038/s41522-025-00654-5.

A human oral commensal-mediated protection against Sjögren's syndrome with maintenance of T cell immune homeostasis and improved oral microbiota

Affiliations

A human oral commensal-mediated protection against Sjögren's syndrome with maintenance of T cell immune homeostasis and improved oral microbiota

Yu-Chao Tseng et al. NPJ Biofilms Microbiomes. .

Abstract

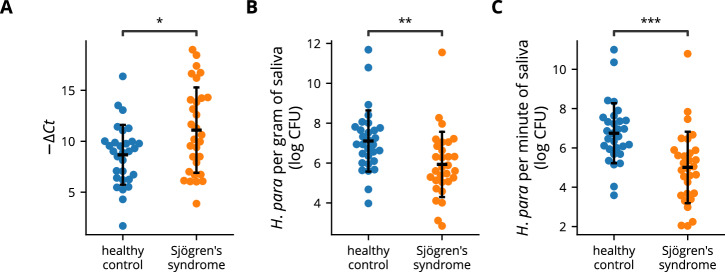
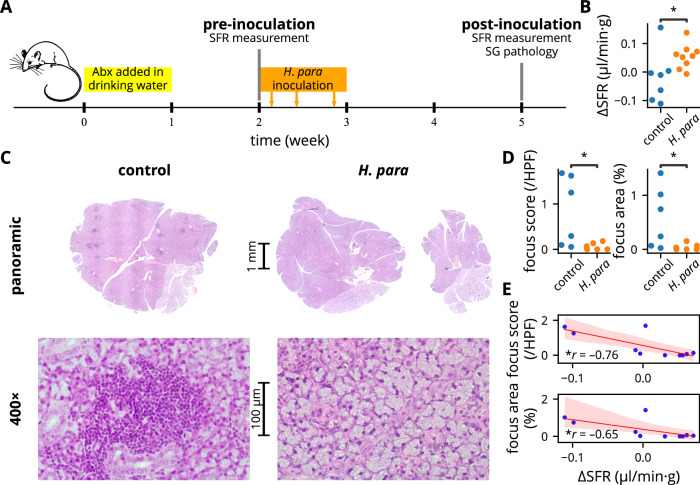
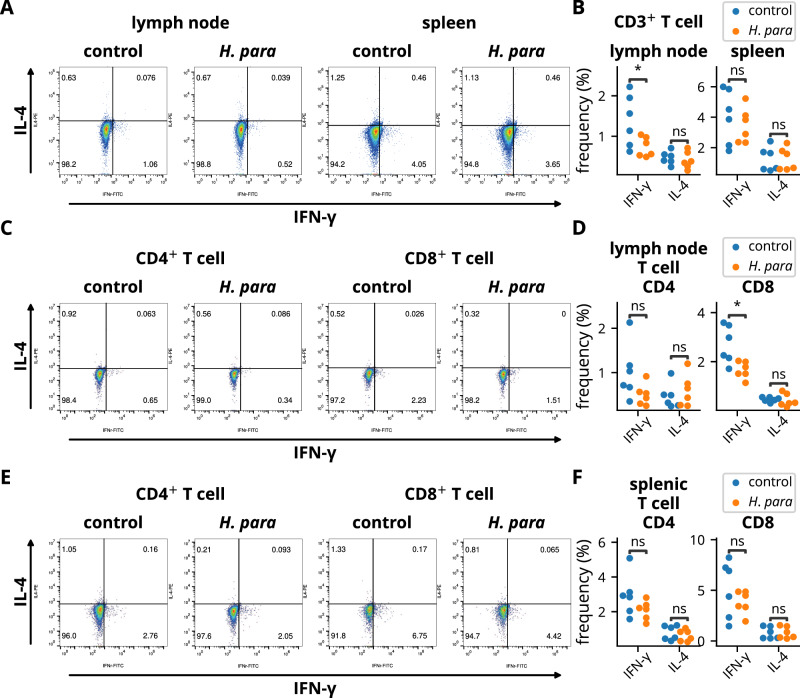
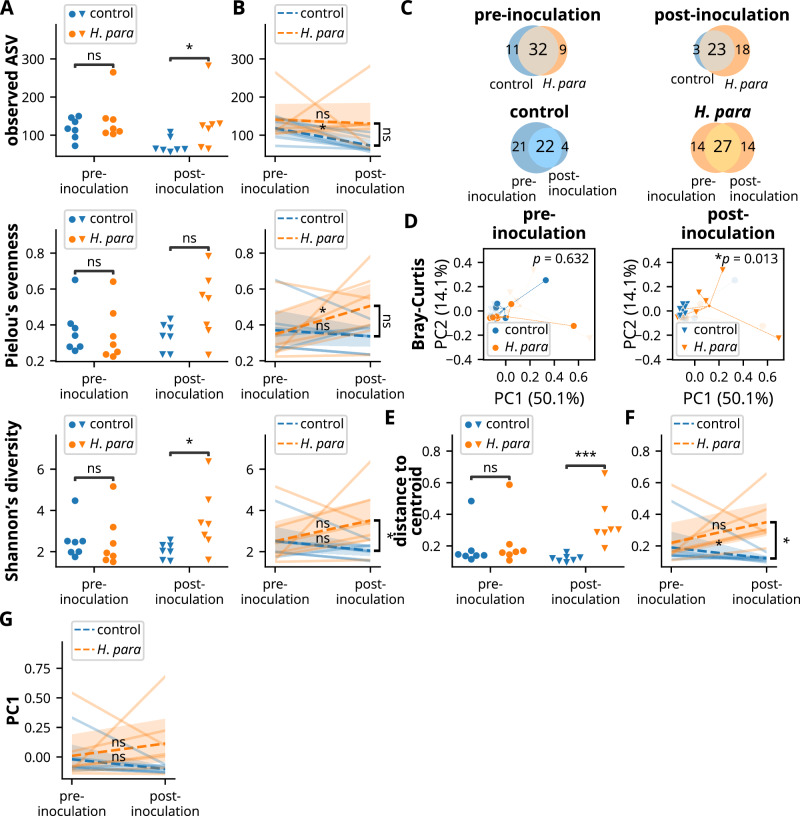
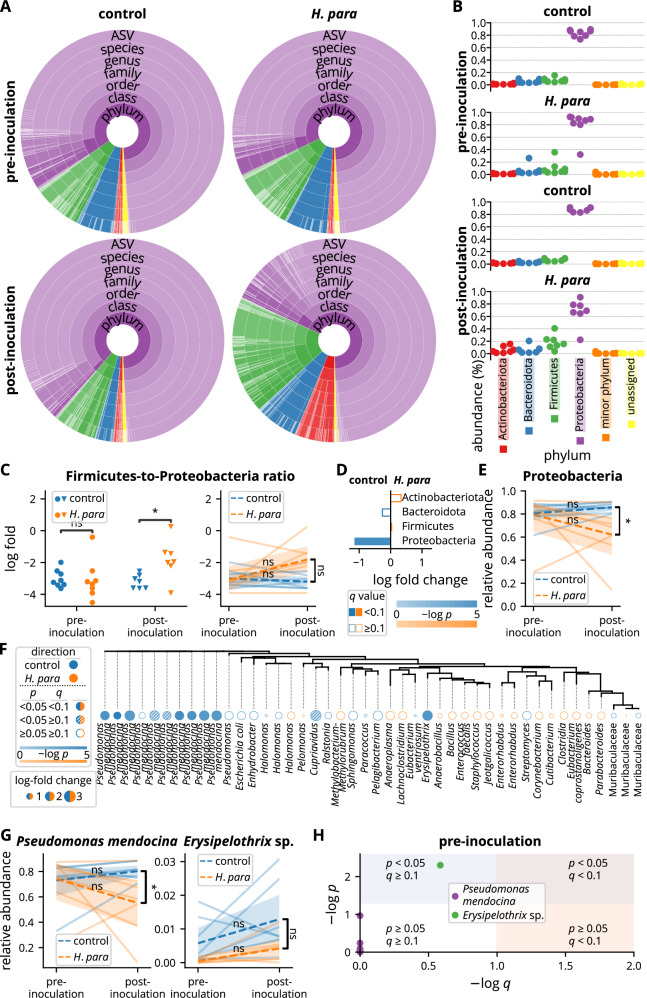
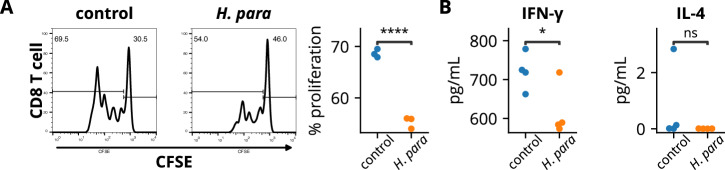
Sjögren's syndrome (SS) is a prevalent systemic autoimmune disease with substantial impacts on women's health worldwide. Although oral Haemophilus parainfluenzae is reduced in SS, its significance remains unclear. This study aimed to elucidate the pathophysiological role of H. parainfluenzae in SS. Reduced salivary H. parainfluenzae levels in SS patients were confirmed through quantitative PCR. Oral H. parainfluenzae inoculation in NOD mice alleviated focal sialadenitis, improved salivary function, and reduced IFN-γ+CD3+ and IFN-γ+CD8+ T cells in salivary gland-draining lymph nodes, maintaining immune homeostasis against a biased type 1 response. Inoculation also enhanced salivary microbiota diversity, balanced the Firmicutes-to-Proteobacteria ratio, and reduced the overwhelming presence of Pseudomonas mendocina. In vitro, H. parainfluenzae-preconditioned A253 cells limited CD8 T cell expansion with reduced IFN-γ production. These findings suggest that H. parainfluenzae improves oral microbial diversity, promotes homeostatic T-cell immunity, and protects against SS, supporting its potential as a next-generation probiotic.


Conflict of interest statement

Competing interests: The authors declare no competing interests.

Figures

Fig. 1
Fig. 1. Decreased abundance of salivary H. parainfluenzae in Sjögren’s syndrome patients.
Salivary DNA from Sjögren’s syndrome patients (n = 30) and healthy controls (n = 30) was analyzed using qPCR. A A swarm plot depicting the difference in Ct values obtained with H. parainfluenzae-specific and universal eubacteria primers. A greater −ΔCt value indicates lower relative abundance. B Salivary H. parainfluenzae concentration was calculated by sample weight and the Ct values obtained with H. parainfluenzae-specific primers. C Total salivary H. parainfluenzae was defined as CFU per minute of saliva production and was calculated using the unstimulated whole salivary flow rate, sample weight, and the Ct values obtained with H. parainfluenzae-specific primers. Statistical significance was determined by Student’s t-test (*p < 0.05, **p < 0.01, ***p < 0.001). Error bars represent standard deviation. H. para: Haemophilus parainfluenzae.
Fig. 2
Fig. 2. H. parainfluenzae inoculation ameliorates Sjögren’s syndrome-like disease in NOD mice.
A Summarized experiemental procedure. Mice were randomly allocated to either the control or H. parainfluenzae group in alternating sequence after the first SFR measurement. Pilocarpine preparation used for SFR measurement and H. parainfluenzae preparation for inoculation were both derived from the same batch. B Change in SFR normalized by body weight, with statistical significance determined using Student’s t test. Of a total of 22 mice (11 mice for each group), SFR measurement failed in two and four mice at baseline and after H. parainfluenzae inoculation respectively. These mice were excluded from the analysis. C Representative salivary gland histology by H&E stain. Salivary glands were harvested from six randomly selected mice in each group. Focal sialadenitides were represented by dark-stained areas in the panoramic view showing mononuclear aggregates (see 400× magnification), evident in the control mouse but almost absent in the H. parainfluenzae-inoculated mouse. D Focus score and focus area analysis with statistical significance determined using the Mann-Whitney U test. E Regression plot between the degree of focal sialadenitis and change in SFR, with Pearson’s correlation coefficient presented. Abx: antibiotic, SFR: salivary flow rate, SG: salivary gland, H. para: Haemophilus parainfluenzae, *p < 0.05.
Fig. 3
Fig. 3. Immunomodulatory effect of H. parainfluenzae inoculation on T cells.
Cells from the salivary gland-draining lymph nodes and spleens of six randomly selected NOD mice in each group were harvested two weeks after the completion of H. parainfluenzae inoculation and subjected to flow cytometry. A, B Cells were gated on CD3 and stained for IFN-γ and IL-4. Representative dot plots and statistical analyses are shown. CF Cells were gated on CD3 and CD4 or CD8 and stained for IFN-γ and IL-4. Representative dot plots and statistical analyses of salivary gland-draining lymph nodes (C-D) or splenic T cells (E-F) are presented. Statistical significance was determined by Student’s t-test (*p < 0.05). H. para: Haemophilus parainfluenzae.
Fig. 4
Fig. 4. H. parainfluenzae inoculation improves oral microbial diversity and resilience in NOD mice.
Since paired saliva samples (pre- and post-inoculation) were available from seven control mice, an additional seven paired saliva samples were randomly selected from H. parainfluenzae-inoculated mice. Saliva was then subjected to 16S ribosomal sequencing, with diversity computed based on amplicon sequencing variants (ASVs). Statistical significance was determined using the Mann-Whitney U test in non-paired analysis whenever not otherwise indicated. The Wilcoxon rank-sum test was utilized for paired analysis within individual groups, and the Mann-Whitney U test was used for comparison of paired changes between control and H. parainfluenzae-inoculated mice. A, B Species richness, evenness, and diversity of salivary microbiota in unpaired (A) and paired (B) analyses. C Venn diagrams depicting common and unique core ASVs. D Principal coordinate analysis utilizing Bray-Curtis distance showing compositional differences. The central point indicates the centroid of each group. Statistical significance was determined by PERMANOVA. E, F Within-group dispersion was evaluated by distance to the group centroid of principal coordinates. Unpaired (E) and paired (F) analyses. G Paired analysis on PC1. H. para: Haemophilus parainfluenzae, *p < 0.05, ***p < 0.001.
Fig. 5
Fig. 5. Reduced salivary Proteobacteria and Pseudomonas mendocina following H. parainfluenzae inoculation.
A Summarized salivary microbiota. Colors correspond to taxa belonging to phyla as indicated in B. Each color depth corresponds to an individual taxon. The arc angle represents relative abundance. B Relative salivary abundance at the phylum level. C Analyses on Firmicutes-to-Proteobacteria ratio. The y-axis represents log fold with the base of e. Statistical significance was determined using the Mann-Whitney U test or the Wilcoxon rank sum test. D Comparison at the phylum level analyzed by ANCOM-BC. E Paired analysis of Proteobacteria abundance with statistical significance determined using the Wilcoxon rank sum test or the Mann-Whitney U test. F Comparison at the ASV level by ANCOM-BC. The tree was built based on phylogenetic similarity. Each tree label indicates the lowest annotated taxon of an ASV. G Paired analyses of Pseudomonas mendocina and the differentially abundant ASV annotated as Erysipelothrix sp. in F. Statistical significance was determined using the Wilcoxon rank sum test or the Mann-Whitney U test. H Analysis of the pre-inoculational abundance of ASVs annotated to Pseudomonas mendocina and the differentially abundant ASV annotated as Erysipelothrix sp. in F by ANCOM-BC. ASV amplicon sequencing variant, H. para: Haemophilus parainfluenzae, *p < 0.05.
Fig. 6
Fig. 6. H. parainfluenzae-pre conditioned A253 cells suppressed CD8 T cell proliferation with reduced IFN-γ production.
A253 cells preconditioned with heat-inactivated H. parainfluenzae at a bacteria-to-cell ratio of 100:1 were cocultured with CD8 T cells. A Cells undergoing proliferation exhibited diminished fluorescent intensity of carboxyfluorescein succinimidyl ester (CFSE). The percentage of CD8 T cells undergoing proliferation was analyzed. B Supernatant cytokine assay. Statistical significance was determined using the Student’s t-test. H. para: Haemophilus parainfluenzae, *p < 0.05, ****p < 0.0001.

Similar articles

References

    1. Ramos-Casals, M. et al. Primary Sjögren syndrome in Spain: clinical and immunologic expression in 1010 patients. Medicine87, 210–219 (2008). - PubMed
    1. Weng, M.-Y., Huang, Y.-T., Liu, M.-F. & Lu, T.-H. Incidence of cancer in a nationwide population cohort of 7852 patients with primary Sjogren’s syndrome in Taiwan. Ann. Rheum. Dis.71, 524–527 (2012). - PubMed
    1. Meijer, J. M. et al. Health-related quality of life, employment and disability in patients with Sjogren’s syndrome. Rheumatol. Oxf. Engl.48, 1077–1082 (2009). - PubMed
    1. Qin, B. et al. Epidemiology of primary Sjögren’s syndrome: a systematic review and meta-analysis. Ann. Rheum. Dis.74, 1983–1989 (2015). - PubMed
    1. Brito-Zerón, P. et al. Sjögren syndrome. Nat. Rev. Dis. Prim.2, 16047 (2016). - PubMed

MeSH terms

Substances