. 2025 May;641(8061):222-231.
doi: 10.1038/s41586-025-08634-7. Epub 2025 Jan 16.

Brain-wide neuronal circuit connectome of human glioblastoma

Affiliations

Brain-wide neuronal circuit connectome of human glioblastoma

Yusha Sun et al. Nature. 2025 May.

Abstract

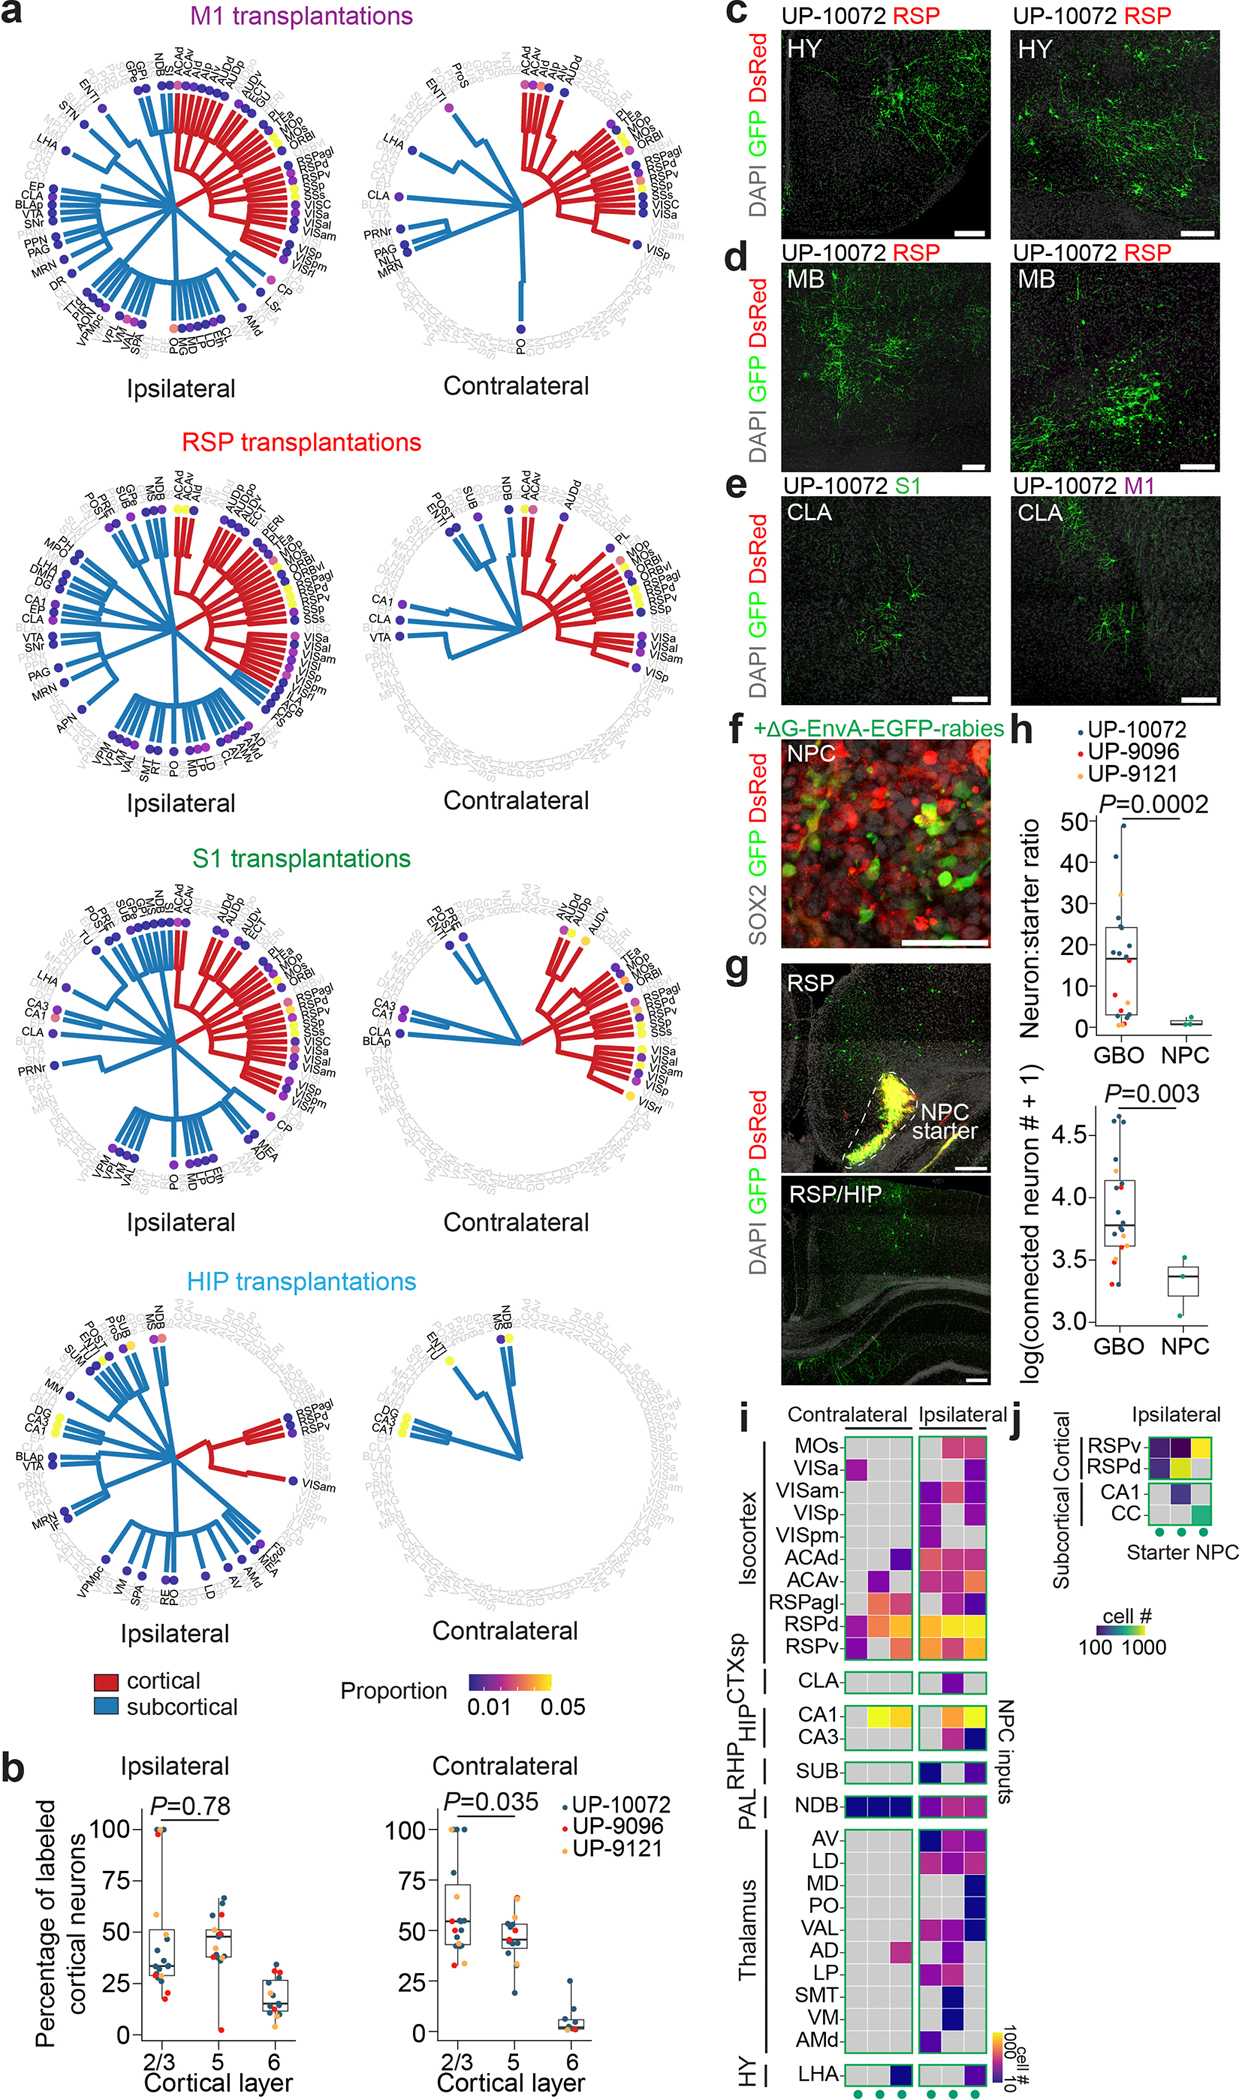
Glioblastoma (GBM) infiltrates the brain and can be synaptically innervated by neurons, which drives tumour progression1,2. Synaptic inputs onto GBM cells identified so far are largely short range and glutamatergic3,4. The extent of GBM integration into the brain-wide neuronal circuitry remains unclear. Here we applied rabies virus-mediated and herpes simplex virus-mediated trans-monosynaptic tracing5,6 to systematically investigate circuit integration of human GBM organoids transplanted into adult mice. We found that GBM cells from multiple patients rapidly integrate into diverse local and long-range neural circuits across the brain. Beyond glutamatergic inputs, we identified various neuromodulatory inputs, including synapses between basal forebrain cholinergic neurons and GBM cells. Acute acetylcholine stimulation induces long-lasting elevation of calcium oscillations and transcriptional reprogramming of GBM cells into a more motile state via the metabotropic CHRM3 receptor. CHRM3 activation promotes GBM cell motility, whereas its downregulation suppresses GBM cell motility and prolongs mouse survival. Together, these results reveal the striking capacity for human GBM cells to rapidly and robustly integrate into anatomically diverse neuronal networks of different neurotransmitter systems. Our findings further support a model in which rapid connectivity and transient activation of upstream neurons may lead to a long-lasting increase in tumour fitness.


Conflict of interest statement

Competing interests: The authors declare no competing interests.

Figures

Extended Data Fig. 1.
Extended Data Fig. 1.. Synaptic gene enrichment in IDH-wt GBM and GBOs.
a-c, Uniform manifold approximation and projection (UMAP) plots of scRNAseq data from UP-10072 GBOs (a, mean 5,525 genes per cell), UP-9096 GBOs (b, mean 6,153 genes per cell), and UP-9121 GBOs (c, mean 6,937 genes per cell). Cells are colored by assigned cell state via marker genes defined by Neftel et al. Circled clusters represent cycling cells as determined by MKI67 expression. AC, astrocyte; MES, mesenchymal; NPC, neural progenitor cell; OPC, oligodendrocyte progenitor cell. d, Copy number aberration (CNA) analysis of UP-10072, UP-9121, and UP-9096 scRNAseq data from a – c. e – f, UMAP plots of UP-10072, UP-9121, UP-9096, and neural stem cells (NSC, i), colored by either Chr7 minus Chr10 CNV level (e) or cell identity (f). g, Representative confocal images of UP-9096 GBOs, UP-9121 GBOs, and UP-10072 GBOs. Scale bars, 50 μm. h, Quantification of percentages of DAPI+ cells that were SOX2+ (n = 3 patients, n = 4 GBOs per patient). i, UMAP plot of 100-day human SNOs, colored by cluster identity. ExN, excitatory neuron; UL, upper layer; DL, deeper layer. j, Same as a-c but for Neftel et al. adult primary GBM. k, Plot of enrichment scores of post-synaptic density genes (GO: 0014069) across SNO-derived nonmalignant clusters versus glioma. l, Same as k but for glioma datasets split by cell state. m, Same as k but for enrichment by location (periphery versus tumor core) with the Darmanis et al. dataset (n = 665 cells). n, Gene expression dot plot as in Fig. 1a, but comparing between states for the Neftel et al. dataset. Comparisons in l, m with two-tailed Mann-Whitney tests.
Extended Data Fig. 2.
Extended Data Fig. 2.. Virus-based trans-monosynaptic tracing with GBOs.
a, Schematic illustrations of the retroviral helper and EnvA-pseudotyped ΔG rabies virus vector. b, Principle of rabies virus spread. c, Control experiments to establish specificity of rabies virus towards infecting GBO cells expressing TVA. Nontransduced (WT, wild-type) GBOs and GBOs expressing DsRed-G-TVA were infected with ΔG rabies virus for 5 days. Nontransduced GBOs were unable to be infected by ΔG rabies virus. Scale bars, 50 μm. d, Quantification of percentages of cells infected by the helper retrovirus (DsRed+/DAPI+) and percentages of DsRed+ tumor cells infected by ΔG rabies virus after 5 days (GFP+DsRed+/DsRed+) (n = 3 GBOs from n = 3 patients). e, Representative confocal images of monosynaptic labeling of neurons 3 dpt of pre-labeled UP-10072 GBM cells (representative of n = 3 mice). Scale bars, 200 μm. f – g, Schematic illustrations of paradigm (f) to perform HSV-based polysynaptic anterograde tracing (g) with GBOs and freshly resected human hippocampal tissue in culture. h, Representative image of the fusion of GBOs with hippocampal tissues. Yellow arrow denotes fused GBO. Scale bar, 4 mm. i, Representative confocal image showing infection of NeuN+ neurons in human hippocampal tissue by HSV, resulting in GFP expression. Yellow arrow denotes infected neuron (representative of hippocampal tissue from n = 3 patients). Scale bar, 20 μm. j, Control experiments showing no direct infection of GBM cells by HSV from culture medium of infected slices. Conditioned media from slices 24 hours after medium refresh (4 days since initial infection) were added to UP-10072 GBOs for 3 days, then fixed for immunohistology and confocal imaging (n = 6 GBOs). Scale bars, 50 μm. k, Representative images of tumor cells infected by HSV 3 days after fusion with human hippocampal tissues (n = 2 samples). Scale bars, 20 μm.
Extended Data Fig. 3.
Extended Data Fig. 3.. Selectivity and specificity of rabies virus transmission in GBOs.
ab, Schematic (a) and representative confocal images (b) of a control helper vector with deletion of the G protein, thus preventing G protein-mediated transsynaptic rabies virus transmission. UP-10072 GBO cells expressing DsRed-TVA were pre-infected with ΔG rabies and transplanted into the RSP for 10 days, with no evidence of GFP+ neurons (n = 4 mice) (b). Scale bars, 200 μm. c, Representative confocal images from control experiments showing that release of rabies virus from infected GBO cells is not a mechanism of mouse neuronal labeling (n = 2 mice). UP-10072 GBOs (n = 3 organoids) expressing DsRed-G-TVA were pre-infected with ΔG rabies virus, lysed after 1 day and subsequently injected into the RSP for 9 days (Day 1 lysis + 9-day transplant). To allow for maximal viral load within GBOs prior to transplantation, the same experiment was repeated with lysis after 5 days and injected into the RSP for 5 days (Day 5 lysis + 5-day transplant). Low numbers of GFP+ mouse neurons were observed in the latter condition, suggesting successful extraction of infection-competent rabies virus. Scale bars, 200 μm. d – e, Sample confocal immunostaining images for IBA1 (microglia), NeuN (neurons), OLIG2 (oligodendrocytes), NG2 (oligodendrocyte precursor cells), and S100B (astrocytes) (d) and quantification of proportions of these cells co-labeled with GFP (e) to establish selectivity of viral transmission to neurons in vivo. Scale bars, 50 μm. Each dot represents a separate section from n = 4 mice including n = 3 pre-labeling experiments with n = 3 patients and n = 1 long-term experiment with UP-10072.
Extended Data Fig. 4.
Extended Data Fig. 4.. Representative brain sections across GBO transplantation sites.
a – h, Confocal brain section images of GFP+ cells following transplantation of ΔG rabies virus pre-infected GBOs expressing RTG for 10 days. Images are coronal sections and are arranged from anterior to posterior. Sections are arranged by GBO patients: UP-10072 (a – d), UP-9096 (e, f), UP-9121 (g, h). Location of transplantations include hippocampus (HIP) (a, e, g), retrosplenial cortex (RSP) (b, f, h), primary somatosensory cortex (S1) (c), and primary motor cortex (M1) (d). Scale bar, 1 mm. i, Representative images from whole-brain clearing and light-sheet microscopy of a pre-labeling experiment with injection of UP-10072 into the RSP at 10 dpt for one mouse. Images are presented as top-down maximum intensity projections obtained by collapsing a span of every 500 μm in the z-direction in the rostral to caudal direction. Scale bar, 4 mm. See Supplementary Video 1.
Extended Data Fig. 5.
Extended Data Fig. 5.. Additional characterization of monosynaptic projections onto GBM cells and human iPSC-derived NPCs.
a, Dendrogram plots showing relative proportions of input projections across cortical (red) and subcortical (blue) for ipsilateral and contralateral sites averaged across all experiments (n = 20 mice as described in Fig. 2e). b, Percentages of input cortical neurons distributed across layers for ipsilateral and contralateral neurons. Each dot represents data from one mouse (n = 20 mice across n = 3 GBOs), and data were plotted only if neurons from that cortical layer were detected. Two-tailed Student’s t-tests. c – e, Representative confocal images of GFP+ projections onto GBM cells from the hypothalamus (c), midbrain (d), and claustrum (e), each representative of n = 3 sections. Scale bars, 200 μm. f, Representative confocal images of SOX2+ human iPSC-derived NPCs expressing DsRed-G-TVA infected with ΔG rabies virus for 5 days, representative of n = 4 coverslips. Scale bar, 50 μm. g, Representative confocal images of monosynaptic tracing with ΔG rabies virus pre-infected NPCs transplanted into the RSP (n = 3 mice). Starter cells are circled (left), and images show projections either near (left) or distal (right) to the transplantation site. Scale bars, 200 μm. h, Comparison of neuron to starter cell ratio and total labeled neuron number for GBO transplantation (n = 20 mice) and NPC transplantation (n = 3 mice). Two-tailed Student’s t-tests with Welch’s correction. i, Quantification as in Fig. 2e but for the n = 3 NPC transplantation experiments across brain regions. j, Quantification as in Fig. 2f but for the starter NPC cells from the NPC transplantation experiments.
Extended Data Fig. 6.
Extended Data Fig. 6.. Trans-monosynaptic tracing following long-term engraftment of GBO cells.
a, Schematic illustration of two-step GBO retrograde trans-monosynaptic tracing. GBOs expressing DsRed-G-TVA were transplanted into the RSP, and ΔG rabies virus was injected one month following engraftment. Mice were examined 10 days following ΔG rabies virus injection (n = 5 mice). b, Representative confocal images after trans-monosynaptic tracing, with GFP+DsRed+ GBM starter cells (circled), GFPDsRed+ GBM cells that were unable to transmit rabies virus, and GFP+DsRed upstream neuronal inputs (n = 3 mice). Scale bars, 200 μm. c, Representative coronal sections from anterior to posterior. Scale bar, 500 μm. d, Sample confocal immunostaining images for glial marker GFAP and apoptosis marker cleaved caspase 3 (cCas3), with no evidence of glial labeling by rabies virus either proximal (inset 3) or distal (inset 1) to the starter cell site and no evidence of massive cell death of GFP+ GBM cells at this timescale (inset 2). Representative of n = 3 mice. Scale bars, 200 μm (low magnification images) and 50 μm (high magnification images). e – f, Qualitative analysis of input neuron (e) and starter cell (f) locations from the areas in Fig. 2e for n = 3 mice.
Extended Data Fig. 7.
Extended Data Fig. 7.. Additional characterization of input neuron subtype identities upon GBO cell transplantation.
a, Sample confocal images of SATB2+GFP+ and CTIP2+GFP+ cortical glutamatergic neurons that project to GBM cells. b, Sample confocal images showing PV+GFP+ (left, hippocampus/HIP) or SST+GFP+ (right, ipsilateral cortex/ipsi CTX) GABAergic neurons. Arrowheads indicate GABAergic neurons. c, Schematic illustration of paradigm to perform trans-monosynaptic tracing with 3-week-old 2D iPSC-derived 1:1 mixed glutamatergic and GABAergic neuron-tumor co-culture. d, Representative confocal images of 2D co-culture 10 days after seeding of GBM cells. GFP+NKX2.1 cells denote glutamatergic neurons infected by ΔG rabies, GFP+NKX2.1+ cells denote GABAergic neurons infected by ΔG rabies, and GFP+DsRed+ cells indicate starter GBM cells. Scale bars, 200 μm (large images) and 20 μm (insets). e, Quantification of the proportion of GFP+DsRed cells in 2D co-culture that were either GABAergic or glutamatergic (n = 7 cultures). IN, interneuron; MGE, median ganglionic eminence. f, Quantification of neuron-starter cell ratio for 2D co-culture (n = 7 cultures). Two-tailed paired t-test. g – i, Sample confocal images of either VAChT+GFP+ or ChAT+GFP+ cholinergic neurons that projected to GBM cells from either the diagonal band nucleus (NDB) (g – h) or pedunculopontine nucleus (PPN) (i). For NDB images, RNA in situ hybridization for GAD1 (white) and immunostaining for VAChT and GFP were performed. Arrowheads indicate either VAChT+GAD1GFP+ or VAChT+GAD1+GFP+ cholinergic neurons of interest. j, Sample confocal images showing TPH2+GFP+ serotonergic neurons (inset 1) and TH+GFP+ dopaminergic neurons (inset 2) in the midbrain (MB). For all images, GBOs and corresponding transplantation sites are as indicated. For all scale bars in this figure, 200 μm (low magnification images) and 20 μm (high magnification images). Images in a – b, g – j are representative of at least n = 3 mice.
Extended Data Fig. 8.
Extended Data Fig. 8.. Additional validation of neuromodulatory cholinergic projections onto GBM cells.
a, Left, confocal images of a primary human GBM sample (UP-10319) immunostained for NeuN+ cortical neurons and NESTIN+ tumor cells, revealing a distinct tumor-cortical boundary. Right, confocal images of a consecutive section with VAChT+ puncta near EGFR+ tumor cells. Scale bars, 200 μm (low magnification) and 20 μm (high magnification). b – c, Confocal immunostaining images of human GBM samples (b, UP-10212; c, UP-10006) with enrichment of either VAChT+ (b) or ChAT+ (c) puncta near EGFR+ tumor cells. Scale bars, 20 μm. d, Representative images of cholinergic axon terminals in the RSP (by VAChT+ and/or ChAT+ expression) 7 days after viral injection to BF. GFP+ puncta co-express VAChT and/or ChAT, confirming Cre-dependent GFP expression of long-range cholinergic neurons. Arrowheads indicate examples GFP+ cholinergic puncta. Scale bars, 50 μm (low magnification) and 20 μm (high magnification). BF: basal forebrain. e, Representative images to confirm monosynaptic HSV infection of starter neurons in BF. A mixture of H129-LSL-ΔTK-tdTomato, AAV-ChAT-Cre and AAV-EF1a-DIO-EGFP-TK was injected into the BF, and immunostaining 6 days post infection revealed GFP+tdTomato+ starter cells. Scale bars, 200 μm (low magnification) and 20 μm (high magnification). f – h, Representative images of postsynaptic GBM cells infected by monosynaptic HSV (tdTomato) in the HIP (f), the CC/HIP boundary (g), and the RSP (h). Arrowheads indicate tdTomato+STEM121+ GBM cells. Scale bars, 200 μm (low magnification) and 20 μm (high magnification). i, Confocal image of a 3D-reconstructed, tdTomato+ GBM cell in the HIP with VAChT+ cholinergic presynaptic boutons in proximity from experiments in f. Scale bar, 1 μm. Representative images in a – c are derived from primary tissue from n = 1 patient each; images from d – e are from n = 3 mice; images from f – h represent n = 3 mice.
Extended Data Fig. 9.
Extended Data Fig. 9.. ACh-driven responses in GBM cells.
a, Representative traces of Ca2+ response of UP-10072 GBOs to 1 mM ACh (Base; red), 1 mM ACh with 100 μM 4-DAMP (4D; blue), and 1 mM ACh with 100 μM mecamylamine (Mec; yellow). Data are plotted for n = 10 cells from one representative organoid for each condition with shaded s.e.m. b, Quantification of the maximal Ca2+ response to ACh normalized to baseline intensity. P-values by LMM (see Methods); multiple comparisons adjustment with Tukey’s method. c, Representative Ca2+ imaging confocal images of acute brain slices with transplanted jRGECO1α-expressing GBM cells and optogenetic stimulation following the paradigm in Fig. 4e. Inset, GBM cell showing an increase in Ca2+ levels upon first and second stimulations but not after the addition of 4D. Representative of n = 9 cells from 3 mice. Scale bars, 50 μm (low magnification) and 20 μm (high magnification). d, Dye-filling of patched UP-10072 GBM cells (arrowheads) after transplantation, showing representative DsRed+Alexa Fluor 488+ cells. Representative of n = 3 patched and filled cells. Scale bar, 10 μm. e, Representative membrane potential changes to injected current steps in a GBM cell under current clamp. Inset, magnification of the box area showing a current injection-induced action potential-like response in the recorded cell. f, Relationship of membrane potential change (measured at the end of the step) and injected current. g, Representative current responses to voltage steps in a GBM cell under voltage clamp (holding potential −60 mV). Depolarizing voltage steps induced inward current followed by outward current. h, Relationship of induced current (measured at the end of the step) and voltage step. i, Blue (470 nm) light-induced inward current in an NDB ChR2+ neuron following the paradigm in Fig. 4h, with Vm = −70 mV. j, Representative trace showing change in Vm of a DsRed+ GBM cell after 470 nm light stimulation (I = 0 pA; resting Vm = −77 mV). k, Representative Ca2+ imaging GBOs in vitro at baseline or 30 minutes after a pulse of ACh, similar to Fig. 5a. Insets (white squares) correspond to example cells with traces shown. Scale bars, 50 μm. l, Cumulative distribution plots of the number of spontaneous Ca2+ peaks per minute in UP-9096 or UP-9121 GBOs either under baseline conditions (blue) or 30 minutes after a pulse of 1 mM ACh (red), similar to Fig. 5b, P-values using Kolmogorov-Smirnov tests. Inset, bar plot of Ca2+ peaks per minute, LMM. m, Same as l but for UP-10072 GBOs with various receptor antagonist treatments, P-values by Kolmogorov-Smirnov tests. Inset, bar plot of calcium peaks per minute, P-values by LMM, P-value adjustment for multiple comparisons with Tukey’s method.
Extended Data Fig. 10.
Extended Data Fig. 10.. ACh-induced fast transcriptional reprogramming of GBM cells.
a, Schematic illustration of massively parallel RNA sequencing paradigm in GBOs to investigate the transcriptional effects of short pulses of ACh or the temporal dynamics of continuous ACh treatment for various lengths of time. b, Plots of exemplary differentially expressed genes that vary across treatment time. Genes are plotted as log2 fold change from baseline (no ACh) values using UMI counts normalized with DeSeq263. The x-axis represents the length of time for which GBOs were treated with ACh prior to library preparation. Each dot represents a distinct bulk sample (n = 4 samples per condition per patient, n = 3 patients). c, Same as b but for a set of differentially expressed genes that demonstrate long-lasting effects of an ACh pulse. The x axis represents the length of time for which GBOs were treated with ACh, with samples taken for library preparation uniformly at 1 hour. d – f, Plots of module enrichment scores for the FOS transcription factor family (d), cell migration gene set (e), and axon guidance gene set (f) at baseline conditions or after treatment with ACh. Note that all ACh-exposed GBO samples were aggregated for the ACh condition for this analysis. P-values by two-tailed Mann-Whitney tests. g – h, UMAP plots of integrated scRNAseq data of GBOs (g, colored by patient) under either baseline or 1 mM ACh treatment conditions (h, colored by condition). i, UMAP plots of exemplary upregulated genes in response to ACh. j, Plots of module enrichment scores of the ACh response gene signature derived from bulk RNA sequencing experiments (a). P-values by two-tailed Mann-Whitney tests. Half violin plots extend to maximum and minimum values. k, Scatter plots of single-cell post-synaptic density (PSD) enrichment (as described in Extended Data Fig. 1k) vs. ACh response gene enrichment in both baseline (left, no ACh) and ACh (right) conditions. Pearson correlation values are displayed and color-coded by patient. l, Kaplan-Meier plots of GBM patients from TCGA GBM (HG-U133A, left), and CGGA (right) datasets from GlioVis. Patient profiles were grouped by GSVA score of the ACh fast response gene set, and cutoffs between high and low expression were selected using maximally selected rank statistics. Shaded areas represent the two-sided 95% confidence intervals. P-values by log-rank test. For box plots in b, c, j, the center line represents the median, the box edges show the 25th and 75th percentiles, and whiskers extend to ±1.5*IQR values.
Extended Data Fig. 11.
Extended Data Fig. 11.. ACh-induced long-lasting transcriptional reprogramming of GBM cells.
a, Schematic illustration of massively parallel bulk RNA sequencing paradigm in GBOs to investigate the long-term transcriptional effects of a single 1-hour pulse of ACh. b, Volcano plot of differentially expressed genes across UP-10072, UP-9096, and UP-9121 GBOs at 1 day following a 1-hour treatment of 1 mM ACh, defined as the long-lasting response genes. Exemplary upregulated (red) and downregulated (blue) genes are indicated. Horizontal dashed line, adjusted P-value cutoff of 0.05 with effect size estimation by apeglm. c, Representative GO terms for upregulated differentially expressed genes at 1 day, with the x axis indicating fold enrichment of observed genes over expected. P-values, Fisher’s exact test, FDR P < 0.05. Reg., regulation; dev., developmental. d, Kaplan-Meier plots of GBM patients from TCGA GBM (HG-U133A, left), and CGGA (right) datasets from GlioVis. Patient profiles were grouped by GSVA score of the ACh long-lasting response gene set, and cutoffs between high and low expression were selected using maximally selected rank statistics. Shaded areas represent the two-sided 95% confidence intervals. P-values by log-rank test.
Extended Data Fig. 12.
Extended Data Fig. 12.. ACh-induced enhanced migration of GBM cells via CHRM3.
a, Quantification of Matrigel-based migration assay from 4 patients. b, Representative confocal images of the assembloid model with GBOs (red) and SNOs. GBOs were fused with SNOs under baseline conditions or after a 1-hour pulse of 1 mM ACh. Insets are zoomed-in images of the 48-hour timepoint. BF, brightfield. Scale bars, 200 μm. c, Quantification of relative migration area of GBOs up to 48 hours post fusion. d – e, Quantification of GBM cell speed (d, in μm/hr) and displacement (e, in μm/hr from original cell location) at baseline and ACh pre-treated conditions. AB, assembloid. f, Quantification of GBM cell speed and displacement as in d, e but for GBO fusion with human hippocampal slices. GBOs were fused with slices either under baseline conditions or after a 1-hour pulse of 1 mM ACh and imaged 1 day later. g, Representative traces of the Ca2+ response of UP-10072-hM3Dq-mCherry GBOs in culture to 20 μM CNO. Data are plotted as mean ± s.e.m. of n = 10 cells from one representative organoid. h, Quantification of the maximal Ca2+ response to 20 μM CNO normalized to baseline intensity. Sal., saline. i, Representative images (left) and migration area quantification (right) of UP-10072-hM3Dq-mCherry GBOs with saline versus CNO stimulation. j, Relative efficacy of CHRM3 knockdown via shRNA normalized to GAPDH expression assayed by qPCR. Each dot represents RNA from GBOs from an independent lentiviral transduction (n = 3 biological replicates). k, Plots of module enrichment scores of the top ACh response genes as defined by RNA sequencing of shScramble and shCHRM3 GBOs. Each dot represents a bulk RNA sequencing sample under either baseline conditions or after a 1-hour pulse of ACh. l, Representative images (left) and migration area quantification (right) of GBOs with CHRM3 knockdown versus scrambled shRNA. Assays were performed in the presence of ACh and images were taken after 48 hours. Scale bars, 200 μm. m, Quantification of GBO size in culture 7 days following shRNA infection. n, Representative confocal immunostaining images of GBOs expressing either shScramble or shCHRM3 shRNA 7 days after transduction, with mCherry representing shRNA expression. Scale bars, 50 μm. o, Quantification of the percentages of Ki67+ cells and normalized cCas3 intensity in shScramble vs shCHRM3 GBOs. p, Representative confocal images of assembloid model with shCHRM3 or shScramble UP-10072 GBOs (red) and SNOs (brightfield) at 0- or 48-hours post-fusion. GBOs were treated with a pulse of ACh for 1 hour and washed prior to assembloid generation. Scale bars, 200 μm. q, Quantification of relative migration area of shCHRM3 or shScramble over time. r, Representative confocal images of UP-7790 GBOs expressing shScramble or shCHRM3 3 weeks post transplantation into HIP (immediate paradigm as described in Fig. 5n). Scale bars, 200 μm. s – t, Quantification of speed and displacement as in f for GBM cells either expressing shScramble or shCHRM3 after transplantation into mice (s) or after fusion with human hippocampal slices (t). One-way ANOVA with Tukey’s post hoc test was used in a. Two-tailed Student’s t-tests were used for c, f, i, l, m, o, q, s, t. Two-tailed Mann-Whitney tests were used for d – e. LMM with P-value adjustment for multiple comparisons with Tukey’s method was used for h. Multiple Student’s t-tests with FDR correction were used for k.
Figure 1.
Figure 1.. Rapid neuronal circuit integration of transplanted human GBM cells in the adult mouse brain.
a, Expression of neurotransmitter receptor and post-synaptic density genes across single-cell transcriptomes of adult GBM (blue: UP-10072, UP-9121, UP-9096, n = 3 patient-derived GBOs; orange: Neftel et al., n = 20 patients, and Wang et al., n = 6 patients) and NSCs in 100-day old SNOs (red: n = 3 organoids). Data are plotted as log-normalized counts, and the dot size represents the proportion of cells with the given gene detected. b, Schematic illustrations of the transplantation paradigm of rabies virus pre-infected GBOs into adult immunodeficient mice. c, Sample confocal images of local (retrosplenial cortex, RSP) and long-range (lateral posterior thalamus, TH - LP) regions at 3-, 5-, and 10-dpt of UP-10072 into the RSP. Scale bars, 200 μm. Left, representative serial sections from anterior to posterior at 10 dpt. Scale bar, 500 μm. See additional sample images in Extended Data Fig. 3a. d, Quantification of the number of labeled neurons at 3, 5, and 10 dpt. Each dot represents data from one mouse, and colors represent GBOs from different patients (n = 3 patients). e, Representative cleared whole-brain images of trans-monosynaptic tracing experiments with transplantation of UP-10072 into RSP at 10 dpt. Images are shown as top-down maximum intensity projections for 3 different mice. Scale bars, 1 mm. See Supplementary Video 1.
Figure 2.
Figure 2.. GBM cell input connectome with diverse anatomical projections.
a, Left shows representative coronal sections corresponding to anterior (ANT), medial (MED), and posterior (POST) areas for primary somatosensory cortex (S1) transplantations. Areas are colored by normalized proportion of GFP+ neurons relative to total GFP+ neuron number in each hemisphere at 10 dpt (summed across n = 3 mice per region). Right shows sample confocal images with locations indicated on the left. Scale bars, 200 μm. b, Same as a but for primary motor cortex (M1) transplantations. c, Same as a but for RSP transplantations. d, Same as a but for hippocampal (HIP) area transplantations. e, Heatmap of input projections to GBM cells, colored by GFP+ neuron number, grouped by transplantation location, and arranged by hemisphere. Each row represents an individual experiment at 10 dpt (n = 20 mice from GBOs from n = 3 patients). In this and subsequent figures, GBO transplantation locations and patient ID are color-coded as indicated. f, Heatmap of starter GBM cell distributions as in e for the same experiments, colored by GBO cell number and arranged by cortical versus subcortical regions. g, Proportions of input neurons across brain regions for subcortical (HIP, n = 5 mice) and cortical (S1, M1, and RSP, n = 15 mice) transplantation experiments at 10 dpt, colored by GBOs from different patients. Each dot represents data from one mouse. h, Proportion of input cortical neurons arising from either hemisphere for experiments in g. i, Quantification of input neuron to starter GBM cell ratio for subcortical and cortical transplantation experiments in g. Abbreviations for all brain regions are listed in Supplementary Table 6.
Figure 3.
Figure 3.. Integration of GBM cells into neuronal circuits with diverse neurotransmitter systems.
a-c, Sample confocal images of RNA in situ hybridization for GAD1 (red) and vGLUT1/vGLUT2 (white) and GFP immunostaining of rabies virus-labeled neurons in the ipsilateral CTX (a), ventral THAL (inset 1) (b), STR (inset 2) (b), and HIP/SUB (c). Orange arrowheads indicate GABAergic neuron cell bodies, and blue arrows indicate glutamatergic neuron cell bodies. d, Quantification of percentages of GFP+ rabies virus-labeled neurons that were vGLUT1/2+GAD1 (glutamatergic), vGLUT1/2GAD1+ (GABAergic), or vGLUT1/2GAD1 (other) across brain regions. IC, ipsilateral CTX; CC, contralateral CTX. Dots are colored by transplantation site as indicated. Data are from n = 28 sections from n = 4 mice (from UP-10072 transplantations), with each dot representing one section. e – f, Sample immunostaining of VAChT+ChAT+GFP+ cholinergic neurons in the MS (e) and NDB (f). Arrowheads indicate example cholinergic neurons. g, Quantification of percentages of GFP+VAChT+ or GFP+ChAT+ neurons in the MS or NDB. Data are from n = 7 mice (n = 4 RSP and n = 3 HIP transplantations) for MS and n = 8 mice (n = 2 HIP, n = 4 RSP, and n = 2 M1/S1/HIP transplantations) for NDB, with each dot representing one mouse, and color representing GBOs from different patients. h, Sample confocal images of TPH2+ serotonergic (inset 1) or TH+ dopaminergic (insets 2 and 3) GFP+ neurons in the MB. Arrowheads indicate example neurons of interest. Results are representative of 3 experiments. Scale bars, 200 μm (low magnification) and 20 μm (high magnification). Abbreviations for additional relevant brain regions are listed in Supplementary Table 6.
Figure 4.
Figure 4.. Functional cholinergic inputs onto GBM cells mediated by metabotropic receptors.
a, Schematic of HSV-mediated anterograde trans-monosynaptic tracing paradigm. BF, basal forebrain. b, Sample confocal images of TdTomato+HuNu+ (Human Nuclei) GBM cells (yellow arrowheads) in the HIP at 10 dpt (representative of n = 3 mice). Blue arrowhead indicates a traced mouse hippocampal neuron. Scale bars, 200 μm (low magnification) and 20 μm (high magnification). c, Schematic of ultrastructural characterization of transplanted GBM cells. d, Representative immuno-electron micrographs of direct contacts between presynaptic cholinergic axon terminals (pseudo-colored blue) and GBM cells (pseudo-colored red). Representative of 5 synapses from 12 ultrathin brain sections. Scale bars, 500 nm. e, Schematic of Ca2+ imaging paradigm of GBM cells in the acute slice. f, Representative intensity trace of a GBM cell with three light stimulations. Red, stimulation in ACSF only; blue, stimulation in ACSF with 100 μM 4-DAMP. g, Quantification of maximal Ca2+ response to stimulation normalized to baseline intensity. Data are plotted as the maximal Ca2+ response ratio between the second and first stimulations and between the third and second stimulations (n = 9 cells from 3 mice). h, Schematic illustration of electrophysiology experiments of transplanted GBM cells in acute slice. i, Representative GBM cell membrane depolarization in current-clamp (I = 0 pA; resting Vm = −69 mV) in response to light stimulation in the presence of 25 μM CNQX and 200 μM 4-AP. Inset shows response time after stimulation (blue dotted line). b.l., baseline. Image on right shows patched DsRed+ GBM cell in the RSP. Scale bar, 100 μm. j, Quantification of maximum membrane depolarization from baseline in response to light stimulation (n = 6 cells from 4 mice). Two-tailed paired t-tests in g, j.
Figure 5.
Figure 5.. Acute ACh-induced long-lasting Ca2+ oscillations, transcriptional changes, and increased motility of GBM via CHRM3.
a – b, Representative Ca2+ imaging at baseline or 30-minutes after a 5-minute pulse of ACh (a; scale bars, 50 μm) and cumulative distribution plots of the number of Ca2+ peaks/minute (b; Kolmogorov-Smirnov test). Inset, LMM (see Methods). c, Volcano plot of differentially expressed genes across GBOs following 1-hour ACh treatment. d, Representative GO terms for up/down-regulated fast-response genes. Fisher’s exact test, FDR P < 0.05. Reg., regulation. e, UpSet plot showing co-occurrence of upregulated genes at various durations following ACh pulse. h, hours; d, days. f, Time-dependent changes in long-lasting gene enrichment (see Supplementary Table 4). Curve represents LOESS fit with s.e.m. One-way ANOVA. g – h, Representative images (g) and quantification (h) of migration assay. Scale bars, 200 μm. In h, y-axis represents covered area by GBO cells compared to baseline. One-way ANOVA with Tukey’s post hoc test. i, Representative time-lapse images of UP-10072 cells (yellow arrowheads) within acute mouse brain slices. Scale bars, 20 μm. j – k, Quantification of cell speed (j) and displacement (k) at baseline and ACh-treated conditions (3 mice each). l, Schematic to chemogenetically activate GBM in vivo. m, Left, representative images under CNO or saline conditions. Scale bars, 200 μm. Right, quantification of relative area of distribution of hM3Dq-mCherry cells (CNO, 4 mice; saline, 5 mice). n, Left, representative confocal images of UP-10072 expressing shScramble or shCHRM3. Scale bars, 200 μm. Right, quantification. GBM cells were transplanted after overnight transduction (UP-10072, 3 mice, HIP; UP-7790, 2 mice, HIP) or 7 days post-transduction (UP-10072, 6 mice, HIP; UP-7790, 2 mice, striatum; 2 mice, HIP). Two-tailed Student’s t-tests in j, k, m, n. o, Kaplan-Meier plots of mice with shScramble versus shCHRM3 GBOs, log-rank tests.

Update of

References

MAIN TEXT REFERENCES

    1. Monje M et al. Roadmap for the Emerging Field of Cancer Neuroscience. Cell 181, 219–222 (2020). - PMC - PubMed
    1. Shi DD et al. Therapeutic avenues for cancer neuroscience: translational frontiers and clinical opportunities. Lancet Oncol. 23, e62–e74 (2022). - PMC - PubMed
    1. Venkataramani V et al. Glutamatergic synaptic input to glioma cells drives brain tumour progression. Nature 573, 532–538 (2019). - PubMed
    1. Venkatesh HS et al. Electrical and synaptic integration of glioma into neural circuits. Nature 573, 539–545 (2019). - PMC - PubMed
    1. Luo L, Callaway EM & Svoboda K Genetic Dissection of Neural Circuits: A Decade of Progress. Neuron 98, 256–281 (2018). - PMC - PubMed

ADDITIONAL REFERENCES (METHODS)

    1. Zhang F et al. Epitranscriptomic regulation of cortical neurogenesis via Mettl8-dependent mitochondrial tRNA m3C modification. Cell Stem Cell 30, 300–311.e11 (2023). - PMC - PubMed
    1. Jacob F et al. Human Pluripotent Stem Cell-Derived Neural Cells and Brain Organoids Reveal SARS-CoV-2 Neurotropism Predominates in Choroid Plexus Epithelium. Cell Stem Cell 27, 937–950.e9 (2020). - PMC - PubMed
    1. Hagemann-Jensen M et al. Single-cell RNA counting at allele and isoform resolution using Smart-seq3. Nat. Biotechnol. 38, 708–714 (2020). - PubMed
    1. Hagemann-Jensen M, Ziegenhain C & Sandberg R Scalable single-cell RNA sequencing from full transcripts with Smart-seq3xpress. Nat. Biotechnol. 1–6 (2022) doi: 10.1038/s41587-022-01311-4. - DOI - PMC - PubMed
    1. Kaminow B, Yunusov D & Dobin A STARsolo: accurate, fast and versatile mapping/quantification of single-cell and single-nucleus RNA-seq data. 2021.05.05.442755 Preprint at 10.1101/2021.05.05.442755 (2021). - DOI

MeSH terms