

Dyslipidemia Impacts Cardiometabolic Health and CVD Risk in a Relatively Young Otherwise Healthy Population
- PMID: 39821451
- PMCID: PMC11771811
- DOI: 10.1111/jch.14972
Dyslipidemia Impacts Cardiometabolic Health and CVD Risk in a Relatively Young Otherwise Healthy Population
Abstract
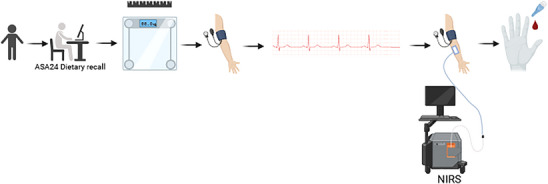
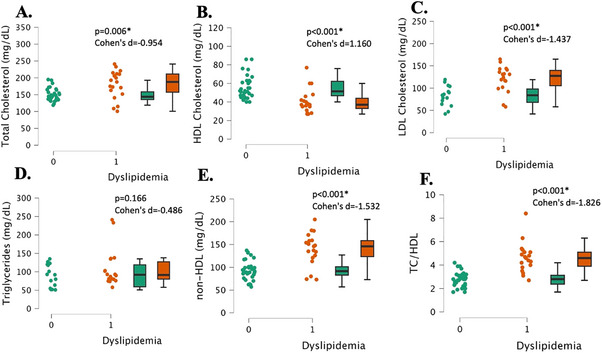
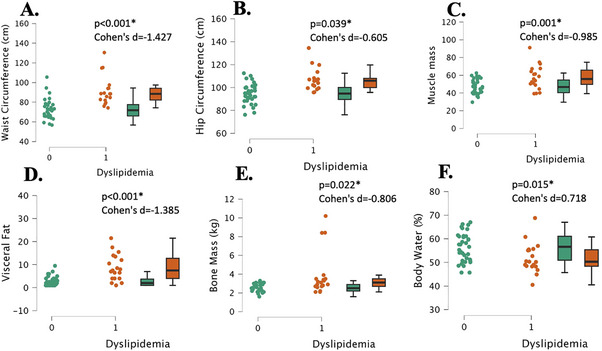
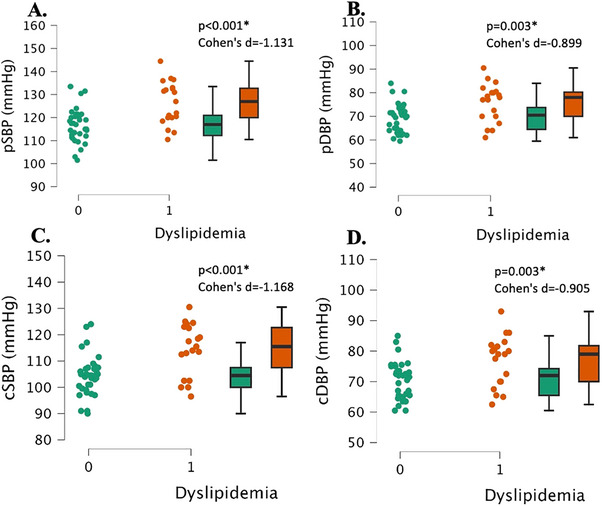
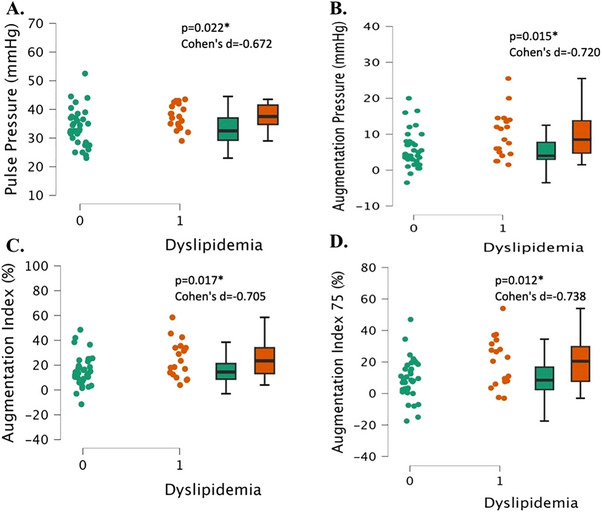
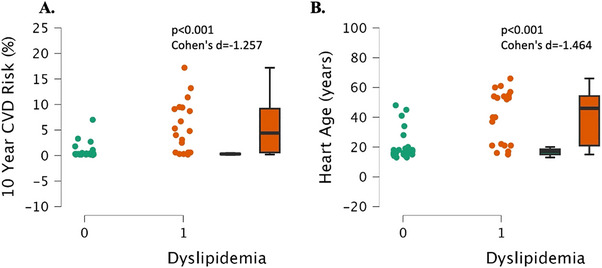
Dyslipidemia, abnormal levels of lipids in the bloodstream, is associated with cardiovascular disease risk (CVD). The purpose of this study was to evaluate the effects of dyslipidemia on cardiometabolic health in relatively young, healthy adults. Participants were 54 healthy males and females aged 18-60 years. Participants were assessed for anthropometrics, body composition, blood pressure and vascular stiffness indicators, microvascular health, and glucose and lipid levels. Using a cross-sectional approach, participants were characterized and grouped as having dyslipidemia or not, and then statistically assessed to determine whether differences in other cardiometabolic health measures existed between the groups. There were significant differences between groups for body weight and composition (total mass, muscle mass, visceral fat, bone mass, and body mass index, all, p < 0.027, Cohen's d > 0.605) with the dyslipidemia group being higher. There were significant differences between groups for peripheral and central blood pressures (all, p < 0.003, Cohen's d > 0.899), as well as for vascular stiffness indicators (pulse pressure, augmentation pressure, augmentation index, augmentation index 75) (all, p < 0.022, Cohen's d > 0.672) with elevations noted in the dyslipidemia group. Ten-year CVD risk was significantly different between groups, with an average risk of 0.8% in the normal lipids group and a risk of 5.4% in the dyslipidemia group (p < 0.001, Cohen's d = 1.260). However, there were no significant differences in macro- or micronutrient intake between groups (all, p > 0.166, Cohen's d < 0.412). There is a significant impact on cardiometabolic health in individuals with dyslipidemia who are otherwise healthy, which may increase individual risk for CVD. Trial Registration: ClinicalTrials.gov identifier: NCT06544915.
Keywords: hypercholesterolemia; lipid profile; microvascular function; vascular stiffness.
© 2025 The Author(s). The Journal of Clinical Hypertension published by Wiley Periodicals LLC.
Conflict of interest statement
The authors report no conflicts of interest
Figures
Similar articles
-
Effects of selective serotonin reuptake inhibitor (SSRI) use on cardiometabolic health and risk in young healthy individuals: A preliminary matched pairs study.Physiol Rep. 2025 Apr;13(8):e70285. doi: 10.14814/phy2.70285. Physiol Rep. 2025. PMID: 40285449 Free PMC article.
-
A prevalence of cardiometabolic risk factors among a rural Yoruba south-western Nigerian population: a population-based survey.Cardiovasc J Afr. 2010 Jan-Feb;21(1):26-31. Cardiovasc J Afr. 2010. PMID: 20224842 Free PMC article.
-
Interplay between lipid profile and anthropometric measures as indicators of cardiometabolic risk in women with polycystic ovary syndrome.Front Endocrinol (Lausanne). 2024 Nov 20;15:1398017. doi: 10.3389/fendo.2024.1398017. eCollection 2024. Front Endocrinol (Lausanne). 2024. PMID: 39634187 Free PMC article.
-
Associations between normal weight central obesity and cardiovascular disease risk factors in Japanese middle-aged adults: a cross-sectional study.J Health Popul Nutr. 2019 Dec 18;38(1):46. doi: 10.1186/s41043-019-0201-5. J Health Popul Nutr. 2019. PMID: 31849344 Free PMC article.
-
Lipid Screening in Childhood for Detection of Multifactorial Dyslipidemia: A Systematic Evidence Review for the U.S. Preventive Services Task Force [Internet].Rockville (MD): Agency for Healthcare Research and Quality (US); 2016 Aug. Report No.: 14-05204-EF-1. Rockville (MD): Agency for Healthcare Research and Quality (US); 2016 Aug. Report No.: 14-05204-EF-1. PMID: 27559550 Free Books & Documents. Review.
References
-
- Pappan N., Awosika A. O., and Rehman A., “Dyslipidemia,” 2024 Mar 4. In: StatPearls [Internet]. StatPearls Treasure: Island (FL): StatPearls Publishing LLC; (2024) Jan. PMID: 32809726.
-
- Smith D. G., “Epidemiology of Dyslipidemia and Economic Burden on the Healthcare System,” The American Journal of Managed Care 13, no. S3 (2007): S68–S71, https://www.ncbi.nlm.nih.gov/pubmed/17596114. - PubMed
-
- World Health Organization . Quantifying Selected Major Risks to Health. World Health Report 2002 (2002): 47–97.
Publication types
MeSH terms
Substances
Associated data
Grants and funding
LinkOut - more resources
Full Text Sources
Medical
