

Explainable machine learning framework for cataracts recognition using visual features
- PMID: 39821539
- PMCID: PMC11748710
- DOI: 10.1186/s42492-024-00183-6
Explainable machine learning framework for cataracts recognition using visual features
Abstract
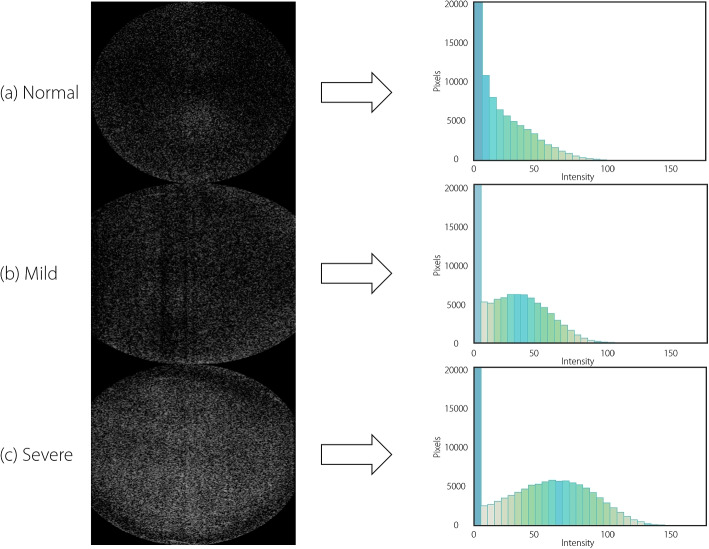
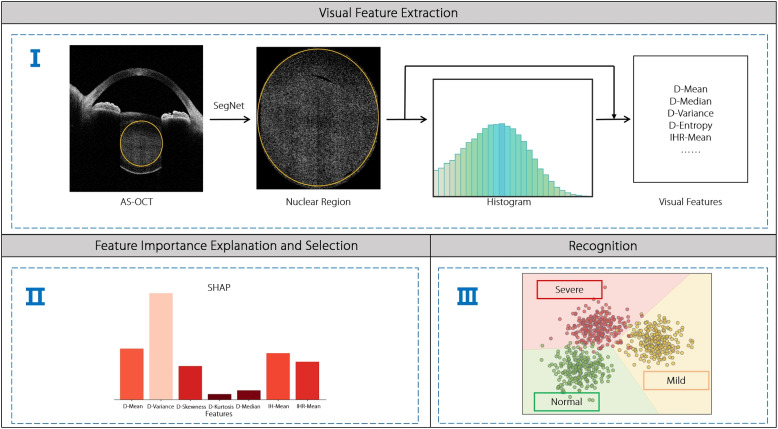
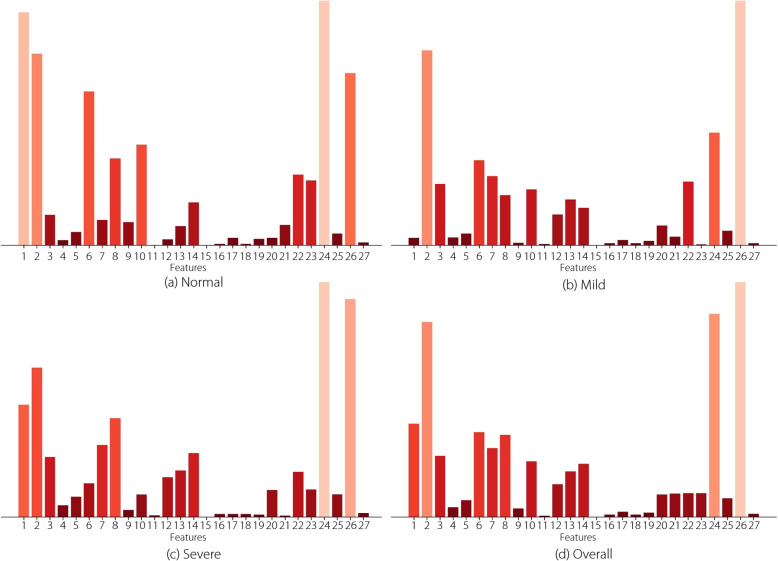
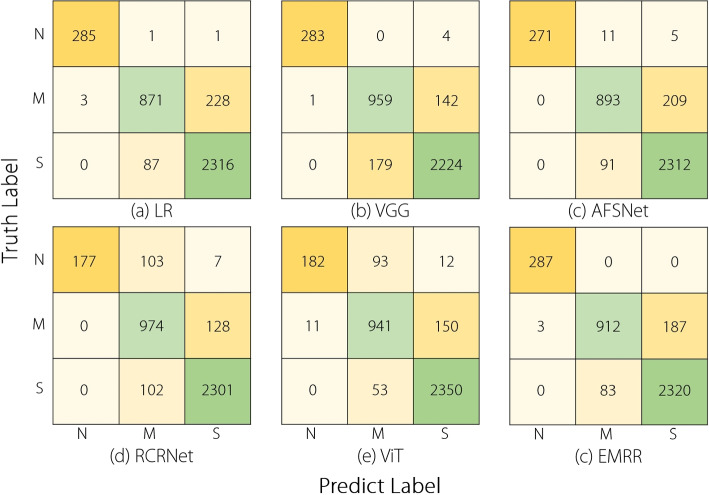
Cataract is the leading ocular disease of blindness and visual impairment globally. Deep neural networks (DNNs) have achieved promising cataracts recognition performance based on anterior segment optical coherence tomography (AS-OCT) images; however, they have poor explanations, limiting their clinical applications. In contrast, visual features extracted from original AS-OCT images and their transform forms (e.g., AS-OCT-based histograms) have good explanations but have not been fully exploited. Motivated by these observations, an explainable machine learning framework to recognize cataracts severity levels automatically using AS-OCT images was proposed, consisting of three stages: visual feature extraction, feature importance explanation and selection, and recognition. First, the intensity histogram and intensity-based statistical methods are applied to extract visual features from original AS-OCT images and AS-OCT-based histograms. Subsequently, the SHapley Additive exPlanations and Pearson correlation coefficient methods are applied to analyze the feature importance and select significant visual features. Finally, an ensemble multi-class ridge regression method is applied to recognize the cataracts severity levels based on the selected visual features. Experiments on a clinical AS-OCT-NC dataset demonstrate that the proposed framework not only achieves competitive performance through comparisons with DNNs, but also has a good explanation ability, meeting the requirements of clinical diagnostic practice.
Keywords: Anterior segment optical coherence tomography; Explainable; Machine learning; Nuclear cataract; Visual feature.
© 2025. The Author(s).
Conflict of interest statement
Declarations. Competing interests: No potential competing interest was reported by the authors.
Figures


Similar articles
-
Mixed pyramid attention network for nuclear cataract classification based on anterior segment OCT images.Health Inf Sci Syst. 2022 Mar 25;10(1):3. doi: 10.1007/s13755-022-00170-2. eCollection 2022 Dec. Health Inf Sci Syst. 2022. PMID: 35401971 Free PMC article.
-
Attention to region: Region-based integration-and-recalibration networks for nuclear cataract classification using AS-OCT images.Med Image Anal. 2022 Aug;80:102499. doi: 10.1016/j.media.2022.102499. Epub 2022 May 29. Med Image Anal. 2022. PMID: 35704990
-
Adaptive feature squeeze network for nuclear cataract classification in AS-OCT image.J Biomed Inform. 2022 Apr;128:104037. doi: 10.1016/j.jbi.2022.104037. Epub 2022 Mar 1. J Biomed Inform. 2022. PMID: 35245700
-
Explainable Machine Learning Model for Glaucoma Diagnosis and Its Interpretation.Diagnostics (Basel). 2021 Mar 13;11(3):510. doi: 10.3390/diagnostics11030510. Diagnostics (Basel). 2021. PMID: 33805685 Free PMC article.
-
Retinal structure guidance-and-adaption network for early Parkinson's disease recognition based on OCT images.Comput Med Imaging Graph. 2024 Dec;118:102463. doi: 10.1016/j.compmedimag.2024.102463. Epub 2024 Nov 19. Comput Med Imaging Graph. 2024. PMID: 39608272
References
-
- Wang W, Yan W, Fotis K, Prasad NM, Lansingh VC, Taylor HR et al (2017) Cataract surgical rate and socioeconomics: a global study. Invest Ophthalmol Vis Sci 57(14):5872–5881. 10.1167/iovs.16-19894 - PubMed
-
- Zhang XQ, Hu Y, Xiao ZJ, Fang JS, Higashita R, Liu J (2022) Machine learning for cataract classification/grading on ophthalmic imaging modalities: a survey. Mach Intell Res 19(3):184–208. 10.1007/s11633-022-1329-0
-
- Gali HE, Sella R, Afshari NA (2019) Cataract grading systems: a review of past and present. Curr Opin Ophthalmol 30(1):13–18. 10.1097/ICU.0000000000000542 - PubMed
-
- Liu YC, Wilkins M, Kim T, Malyugin B, Mehta JS (2017) Cataracts. Lancet 390(10094):600–612. 10.1016/S0140-6736(17)30544-5 - PubMed
-
- Fu HZ, Xu YW, Lin S, Zhang XQ, Wong DWK, Liu J et al (2017) Segmentation and quantification for angle-closure glaucoma assessment in anterior segment OCT. IEEE Trans Med Imaging 36(9):1930–1938. 10.1109/TMI.2017.2703147 - PubMed
Grants and funding
LinkOut - more resources
Full Text Sources
Research Materials