

Individualization of piperacillin dosage based on therapeutic drug monitoring with or without model-informed precision dosing: a scenario analysis
- PMID: 39821648
- PMCID: PMC12086683
- DOI: 10.1093/jac/dkaf007
Individualization of piperacillin dosage based on therapeutic drug monitoring with or without model-informed precision dosing: a scenario analysis
Abstract
Background: Model-informed precision dosing (MIPD) combines population pharmacokinetic knowledge with therapeutic drug monitoring (TDM) to optimize dosage adjustment. It could improve target concentration attainment over empirical TDM, still widely practised for broad-spectrum antibiotics.
Objectives: To evaluate the respective performance of TDM and MIPD in achieving target piperacillin exposure.
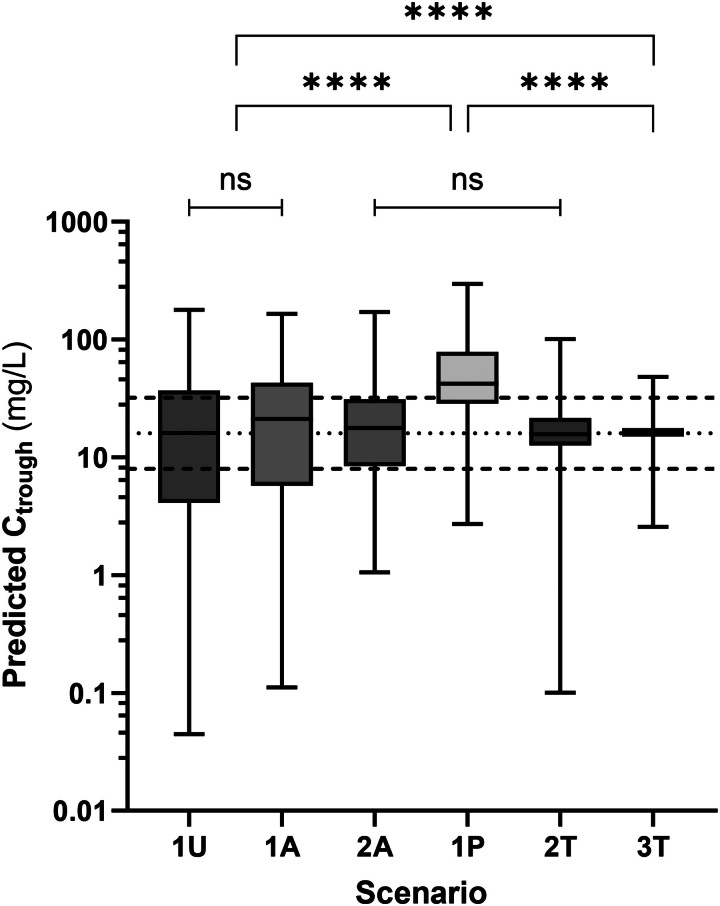
Methods: Measurements from 80 courses of intermittent piperacillin infusions, each with two TDM samples, were retrospectively submitted to our MIPD software TUCUXI. We considered six dosage adjustment strategies: identical dosage for all (4000 mg q8h), actual initial dosage (chart-based), actual empirical adjustment following first TDM, a priori MIPD-based dosage, a posteriori MIPD-based adjustment after first TDM and MIPD including both TDM measurements. Dosing strategies were compared regarding daily dosage, trough levels distribution and PTA (with target trough 8-32 mg/L).
Results: Median trough concentration fell within 8-32 mg/L for all strategies except a priori MIPD-based dosage (42 mg/L). Distributions of trough concentrations predicted with the six dosage adjustment strategies showed significant differences, with both a posteriori MIPD-based strategies best reducing their standard deviation (P < 0.001). PTA of 32%, 32%, 55%, 29%, 83% and 94% were estimated, respectively for the six strategies (P < 0.001). Poor performance of a priori MIPD-based dosage did not hinder a posteriori MIPD-based strategies from significantly improving target attainment.
Conclusions: Whilst empirical TDM improves exposure standardization and target attainment compared with no TDM, MIPD can still bring further improvement. Prospective trials remain warranted to confirm MIPD benefits not only on target attainment but also on clinical endpoints.
© The Author(s) 2025. Published by Oxford University Press on behalf of British Society for Antimicrobial Chemotherapy.
Figures


Similar articles
-
Predictive performance of multi-model approaches for model-informed precision dosing of piperacillin in critically ill patients.Int J Antimicrob Agents. 2024 Oct;64(4):107305. doi: 10.1016/j.ijantimicag.2024.107305. Epub 2024 Aug 13. Int J Antimicrob Agents. 2024. PMID: 39146997
-
From Therapeutic Drug Monitoring to Model-Informed Precision Dosing for Antibiotics.Clin Pharmacol Ther. 2021 Apr;109(4):928-941. doi: 10.1002/cpt.2202. Epub 2021 Mar 16. Clin Pharmacol Ther. 2021. PMID: 33565627 Review.
-
Pharmacokinetic Model-Informed Precision Dosing of Natalizumab in Multiple Sclerosis.CPT Pharmacometrics Syst Pharmacol. 2025 Jun;14(6):1032-1041. doi: 10.1002/psp4.70014. Epub 2025 Mar 20. CPT Pharmacometrics Syst Pharmacol. 2025. PMID: 40110747 Free PMC article.
-
Simulation-Based Optimization of Sampling Schedules for Model-Informed Precision Dosing of Once-Daily and 4-Times-Daily Busulfan in Pediatric Patients.Ther Drug Monit. 2024 Dec 1;46(6):786-796. doi: 10.1097/FTD.0000000000001217. Epub 2024 Jun 14. Ther Drug Monit. 2024. PMID: 38885146 Free PMC article.
-
Model-Informed Precision Dosing Software Tools for Dosage Regimen Individualization: A Scoping Review.Pharmaceutics. 2023 Jul 1;15(7):1859. doi: 10.3390/pharmaceutics15071859. Pharmaceutics. 2023. PMID: 37514045 Free PMC article.
References
MeSH terms
Substances
LinkOut - more resources
Full Text Sources
Medical
