. 2025 May;15(5):738-753.
doi: 10.1002/2211-5463.13967. Epub 2025 Jan 16.

FAM136A depletion induces mitochondrial stress and reduces mitochondrial membrane potential and ATP production

Affiliations

FAM136A depletion induces mitochondrial stress and reduces mitochondrial membrane potential and ATP production

Yushi Otsuka et al. FEBS Open Bio. 2025 May.

Abstract

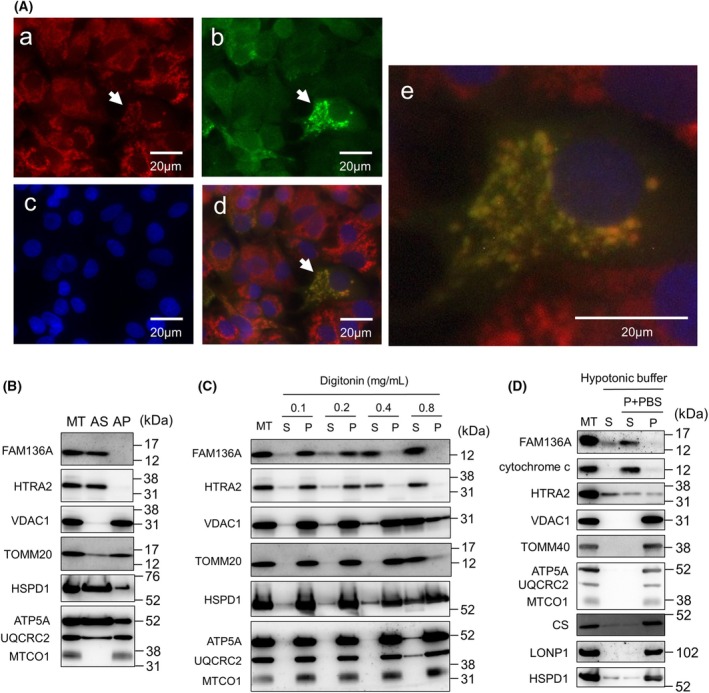
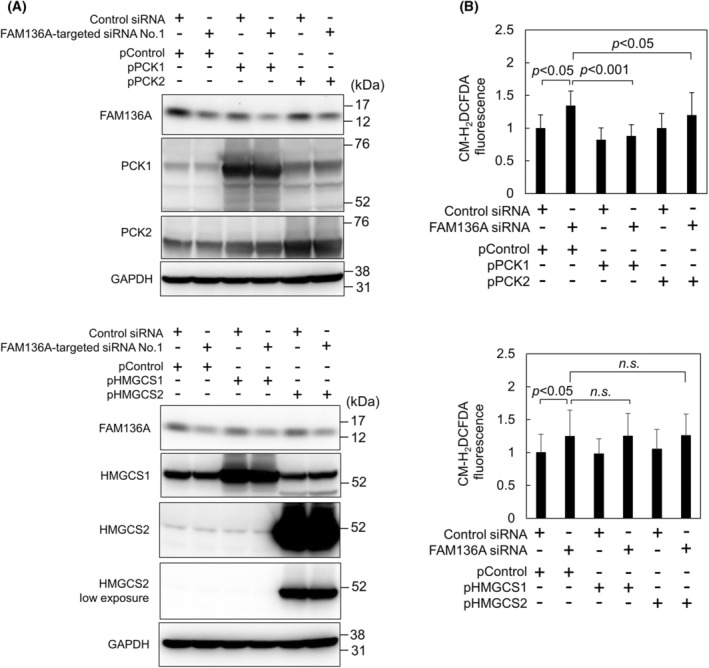
FAM136A deficiency has been associated with Ménière's disease. However, the underlying mechanism of action of this protein remains unclear. We hypothesized that FAM136A functions in maintaining mitochondria, even in HepG2 cells. To better characterize FAM136A function, we analyzed the cellular response caused by its depletion. FAM136A depletion induced reactive oxygen species (ROS) and reduced both mitochondrial membrane potential and ATP production. However, cleaved caspase-9 levels did not increase significantly. We next investigated why the depletion of FAM136A reduced the mitochondrial membrane potential and ATP production but did not lead to apoptosis. Depletion of FAM136A induced the mitochondrial unfolded protein response (UPRmt) and the expression levels of gluconeogenic phosphoenolpyruvate carboxykinases (PCK1 and PCK2) and ketogenic 3-hydroxy-3-methylglutaryl-CoA synthases (HMGCS1 and HMGCS2) were upregulated. Furthermore, depletion of FAM136A reduced accumulation of holocytochrome c synthase (HCCS), a FAM136A interacting enzyme that combines heme to apocytochrome c to produce holocytochrome c. Notably, the amount of heme in cytochrome c did not change significantly with FAM136A depletion, although the amount of total cytochrome c protein increased significantly. This observation suggests that greater amounts of cytochrome c remain unbound to heme in FAM136A-depleted cells.

Keywords: ATP; FAM136A; holocytochrome c synthetase; mitochondrial membrane potential; mitochondrial stress.


Conflict of interest statement

The authors declare that they have no conflicts of interest regarding the content of this article.

Figures

Fig. 1
Fig. 1
Confirmation of mitochondrial IMS localization of FAM136A. (A) HepG2 cells transfected with the vector expressing FAM136A‐Myc‐FLAG were stained with Mito Tracker Red (a), anti‐FLAG antibody and secondary antibody conjugated with Alexa Fluor488 (b), and Hoechst (c); the merged images of these three photographs are also shown (d), and the cell image with arrow shown in (d) was enlarged (e). (B) Mitochondria were isolated from HepG2 cells, as described in the Materials and Methods section, and subjected to an alkali extraction assay. Then, immunoblot analysis was performed. (C) Mitochondria isolated from HepG2 cells were treated with digitonin at the indicated concentration, followed by centrifugation to obtain the supernatant and pellet fractions (S, supernatant fraction; P, pellet fraction). (D) Mitochondria isolated from HepG2 cells were treated with hypotonic solution followed by centrifugation to obtain the supernatant fraction (S). The remained pellet suspended by PBS (P + PBS) was then centrifuged to obtain the supernatant (S) and pellet (P) fraction. AP, alkali‐resistant pellet fraction; AS, alkali‐soluble supernatant fraction; ATP5A, mitochondrial ATP synthase subunit alpha; HSPD1, heat shock protein family D (Hsp60) member 1; HTRA2, high‐temperature requirement protein A2; MT, isolated mitochondria; MTCO1, mitochondrially encoded cytochrome c oxidase I; TOMM20, translocase of outer mitochondrial membrane 20; UQCRC2, ubiquinol‐cytochrome c reductase core protein 2; VDAC1, voltage dependent anion channel 1.
Fig. 2
Fig. 2
Depletion of FAM136A upregulates ROS production and reduces mitochondrial membrane potential and ATP production but does not induce obvious apoptosis. HepG2 cells were transfected with negative control siRNA or FAM136A‐targeted siRNA No. 1 and cultured for 72 h. (A) Proteins were extracted from the cells and subjected to immunoblot analysis to determine the FAM136A protein levels (n = 3). Protein expression of FAM136A and GAPDH was quantified, and normalized by GAPDH expression level. The protein expression levels of the control were set to 1. Data were analyzed using a Student's t‐test. Bars and whiskers of the graph represent mean and SD (right panel). (B) Fluorescence intensity of CM‐H2DCFDA‐loaded cells was measured using Infiniti F200 Pro (n = 8). The levels of CM‐H2DCFDA fluorescence in the control were set to 1. Data were analyzed using a Student's t‐test. Bars and whiskers of the graph represent mean and SD. (C) Fluorescence intensity of JC‐1‐loaded cells was measured using Infiniti F200 Pro (n = 32). The ratio of red fluorescence to green fluorescence (Red/Green) was calculated. The ratio of the control was set to 1. Data were analyzed using a Student's t‐test. Bars and whiskers of the graph represent mean and SD. (D) Intracelllular ATP concentration was quantified, and normalized by protein concentration (n = 4). Data were analyzed using a Student's t‐test. Bars and whiskers of the graph represent mean and SD. (E) Proteins extracted from the cells were subjected to immunoblot analysis to detect cleaved CASP9. CASP9, caspase‐9. C, control cell lysate; GAPDH, glyceraldehyde‐3‐phosphate dehydrogenase; KD, FAM136A‐depleted cell lysate obtained by using FAM136A‐targeted siRNA No.1.
Fig. 3
Fig. 3
FAM136A depletion induced ATF4‐ and DDIT3‐dependent UPRmt, including upregulation of LONP1, TOMM22, TOMM20, PCK1, PCK2, HMGCS1, and HMGCS2. HepG2 cells were transfected with negative control siRNA or FAM136A‐targeted siRNA No.1 and cultured for 72 h. (A) Proteins extracted from the cells were subjected to immunoblot analysis to determine ATF4, ATF5, and DDIT3 protein levels (n = 3). ATF4 and ATF5, activating transcription factor 4 and 5; C, control cell lysate; DDIT3, DNA damage‐inducible transcript 3 (CHOP) (left panel); KD, FAM136A‐depleted cell lysate obtained by using FAM136A‐targeted siRNA No.1. Protein expression of ATF4, ATF5, DDIT3, and GAPDH was quantified, and normalized by GAPDH expression level. The protein expression levels of the control were set to 1. Data were analyzed using a Student's t‐test. Bars and whiskers of the graph represent mean and SD. (right panel) (B) Immunoblot analysis was performed to determine LONP1 and HSPD1 protein levels (n = 3). HSPD1, heat shock protein family D (Hsp60) member 1; LONP1, Lon peptidase 1 (left panel). Protein expressions of LONP1, HSPD1, and GAPDH were quantified, and normalized by GAPDH expression level. The protein expression levels of the control were set to 1. Data were analyzed using a Student's t‐test. Bars and whiskers of the graph represent mean and SD (right panel). (C) Immunoblot analysis was performed to determine TOMM22 and TOMM20 protein levels (n = 3). TOMM20, TOMM22, and TOMM40, translocases of outer mitochondrial membrane 20, 22, and 40, respectively (left panel). Protein expressions of TOMM22, TOMM20, TOMM40, and GAPDH were quantified, and normalized by GAPDH expression level. The protein expression levels of the control were set to 1. Data were analyzed using a Student's t‐test. Bars and whiskers of the graph represent mean and SD (right panel). (D) Total RNA was isolated from HepG2 cells and subjected to qPCR. mRNA expressions of PCK1, PCK2, HMGCS1, and HMGCS2 were quantified (n = 4), and normalized by GAPDH mRNA expression level. The mRNA expression levels of the control were set to 1. Data were analyzed using a Student's t‐test. Bars and whiskers of the graph represent mean and SD. (E) Immunoblot analysis was performed to determine PCK1, PCK2, HMGCS1, and HMGCS2 protein levels (n = 3). PCK1 and PCK2, phosphoenolpyruvate carboxykinase 1 and 2; HMGCS1 and HMGCS2, 3‐hydroxy‐3‐methylglutaryl‐CoA synthase 1 and 2 (upper panel). Protein expressions of PCK1, PCK2, HMGCS1, HMGCS2, and GAPDH was quantified, and normalized by GAPDH expression level. The protein expression levels of the control were set to 1. Data were analyzed using a Student's t‐test. Bars and whiskers of the graph represent mean and SD (lower panel).
Fig. 4
Fig. 4
PCK1 overexpression suppresses ROS generation induced by FAM136A depletion. HepG2 cells cotransfected with siRNAs (negative control siRNA or FAM136A‐targeted siRNA No.1) and plasmids (pControl, pPCK1, pPCK2, pHMGCS1 or pHMGCS2), as indicated in the figure. The cells were cultured for 72 h and then subjected to the following analyses: (A) Proteins extracted from the cells were subjected to immunoblot analysis to confirm FAM136A, PCK1, PCK2, HMGCS1, and HMGCS2 protein levels. (B) Fluorescence intensity of CM‐H2DCFDA‐loaded cells was measured using Infiniti F200 Pro (n = 16). The levels of CM‐H2DCFDA fluorescence in the control were set to 1. Data were analyzed using a Student's t‐test. Bars and whiskers of the graph represent mean and SD.
Fig. 5
Fig. 5
FAM136A depletion results in increased expression of cytochrome c proteins, decreased HCCS expression, and lower ratio of heme/cytochrome c proteins. HepG2 cells were transfected with negative control siRNA or FAM136A‐targeted siRNA No.1 and cultured for 72 h. Then, proteins extracted from the cells were mixed with SDS/PAGE loading buffer without 2‐ME. (A) The samples were subjected to immunoblot analysis to determine HCCS, cytochrome c, and HTRA2 protein levels (n = 3). C, control cell lysate; HCCS, holocytochrome c synthase; HTRA2, high temperature requirement protein A2; KD, FAM136A‐depleted cell lysate obtained by using FAM136A‐targeted siRNA No.1 (upper panel). Protein expressions of HCCS, cytochrome c, and HTRA2 were quantified, and normalized by GAPDH expression level. The protein expression levels of the control were set to 1. Data were analyzed using a Student's t‐test. Bars and whiskers of the graph represent mean and SD (lower panel). (B) Heme in cytochrome c was stained using ECL, and then followed by immunostaining using anti‐cytochrome c antibody (upper panel). The intensity of the bands corresponding to heme in cytochrome c and cytochrome c proteins was quantified, and normalized by GAPDH expression level. The intensity of the control was set to 1. Data were analyzed using a Student's t‐test. Bars and whiskers of the graph represent mean and SD (lower panel). (C) The ratio of heme/cytochrome c protein was calculated. The ratio of the control was set to 1. Data were analyzed using a Student's t‐test. Bars and whiskers of the graph represent mean and SD.
Fig. 6
Fig. 6
Morphology of HepG2 cells did not change by depletion of FAM136A. HepG2 cells transfected with negative control siRNA or FAM136A‐targeted siRNA No.1 were cultured for 72 h, and stained by Mito Tracker Red and Hoechst dye. After fixation, observing multiple areas of the slide glass under a fluorescent microscope, and confirming that there are no morphological changes, representative cell images were photographed.
Fig. 7
Fig. 7
Experiments using FAM136A‐targeted siRNA No.2 gave similar results as those using the FAM136A‐targetted siRNA No.1. HepG2 cells were transfected with negative control siRNA or FAM136A‐targeted siRNAs and cultured for 72 h. (A) Proteins extracted from the cells transfected with negative control siRNA and FAM136A‐targeted siRNAs No.1–5 were subjected to immunoblot analysis to search FAM136A knockdown levels. Con, control cell lysate; KD No.1–5, FAM136A‐depleted cell lysate obtained by using FAM136A‐targeted siRNA No.1–5. (B) Proteins extracted from the cells transfected with negative control siRNA and FAM136A‐targeted siRNAs No.1 and 2 were subjected to immunoblot analysis. (C) Fluorescence intensity of CM‐H2DCFDA‐loaded cells transfected with negative control siRNA (Control) and FAM136A‐targeted siRNAs No.2. (KD No.2) was measured using Infiniti F200 Pro (n = 8). The levels of CM‐H2DCFDA fluorescence in the control were set to 1. Data were analyzed using a Student's t‐test. Bars and whiskers of the graph represent mean and SD. (D) Fluorescence intensity of JC‐1‐loaded cells transfected with negative control siRNA (Control) and FAM136A‐targeted siRNAs No.2. (KD No.2) was measured using Infiniti F200 Pro (n = 16). The ratio of red fluorescence to green fluorescence (Red/Green) was calculated. The ratio of the control was set to 1. Data were analyzed using a Student's t‐test. Bars and whiskers of the graph represent mean and SD. (E) ATP content in the cells transfected with negative control siRNA (Control) and FAM136A‐targeted siRNAs No.2. (KD No.2) was quantified, and normalized by protein concentration (n = 4). Data were analyzed using a Student's t‐test. Bars and whiskers of the graph represent mean and SD.
Fig. 8
Fig. 8
Summary of the phenotypes observed in FAM136A‐depleted cells. FAM136A depletion upregulated ROS production, reduced mitochondrial membrane potential (ΔΨ) and ATP production, and upregulated expression of the four enzymes (PCK1, PCK2, HMGCS1, and HMGCS2) that would reduce metabolisms in TCA cycle. The expression of both TOMM22 and TOMM20 that would probably enhance mitochondrial protein import was also upregulated. FAM136A depletion reduced expression level of FAM136A‐interacting protein HCCS that produce holocytochrome c by combining heme to apocytochrome c. In FAM136A‐depleted cells, the amount of heme bound to cytochrome c was not affected although the expression level of cytochrome c was significantly upregulated, indicating that the ratio of holocytochrome c/apocytochrome c is reduced.

Similar articles

References

    1. Busch JD, Fielden LF, Pfanner N and Wiedemann N (2013) Mitochondrial protein transport: versatility of translocases and mechanisms. Mol Cell 83, 890–910. - PubMed
    1. Sayyed UMH and Mahalakshmi R (2022) Mitochondrial protein translocation machinery: from TOM structural biogenesis to functional regulation. J Biol Chem 298, 101870. - PMC - PubMed
    1. Pfanner N and Wiedemann N (2002) Mitochondrial protein import: two membranes, three translocases. Curr Opin Cell Biol 14, 400–411. - PubMed
    1. Pfanner N, Warscheid B and Wiedemann N (2019) Mitochondrial proteins: from biogenesis to functional networks. Nat Rev Mol Cell Biol 20, 267–284. - PMC - PubMed
    1. Yamano K, Yatsukawa Y, Esaki M, Hobbs AEA, Jensen RE and Endo T (2008) Tom20 and Tom22 share the common signal recognition pathway in mitochondrial protein import. J Biol Chem 283, 3799–3807. - PubMed

Substances

LinkOut - more resources