Review
. 2025 Apr;100(2):530-555.
doi: 10.1111/brv.13152. Epub 2025 Jan 17.

Large-scale and long-term wildlife research and monitoring using camera traps: a continental synthesis

Tom Bruce  1   2 Zachary Amir  1   2   3 Benjamin L Allen  4   5 Brendan F Alting  6 Matt Amos  7 John Augusteyn  8 Guy-Anthony Ballard  9 Linda M Behrendorff  10   11 Kristian Bell  12   13 Andrew J Bengsen  14 Ami Bennett  15 Joe S Benshemesh  16 Joss Bentley  17 Caroline J Blackmore  17 Remo Boscarino-Gaetano  9 Lachlan A Bourke  2 Rob Brewster  18 Barry W Brook  19 Colin Broughton  20 Jessie C Buettel  19 Andrew Carter  21 Antje Chiu-Werner  19 Andrew W Claridge  22   23 Sarah Comer  24   25 Sebastien Comte  14   26 Rod M Connolly  27 Mitchell A Cowan  21   28 Sophie L Cross  29 Calum X Cunningham  19 Anastasia H Dalziell  30 Hugh F Davies  9   31 Jenny Davis  31 Stuart J Dawson  32   33 Julian Di Stefano  34 Christopher R Dickman  35 Martin L Dillon  36 Tim S Doherty  35   37 Michael M Driessen  38 Don A Driscoll  13 Shannon J Dundas  14 Anne C Eichholtzer  13 Todd F Elliott  9 Peter Elsworth  7 Bronwyn A Fancourt  9   39 Loren L Fardell  2 James Faris  40 Adam Fawcett  40 Diana O Fisher  2 Peter J S Fleming  9   14   41 David M Forsyth  14   26 Alejandro D Garza-Garcia  2   42 William L Geary  15 Graeme Gillespie  43 Patrick J Giumelli  44 Ana Gracanin  45 Hedley S Grantham  46   47 Aaron C Greenville  35 Stephen R Griffiths  48 Heidi Groffen  49 David G Hamilton  19   50 Lana Harriott  51 Matthew W Hayward  52 Geoffrey Heard  3 Jaime Heiniger  9 Kristofer M Helgen  53 Tim J Henderson  54 Lorna Hernandez-Santin  55 Cesar Herrera  27 Ben T Hirsch  56   57 Rosemary Hohnen  31   58 Tracey A Hollings  59 Conrad J Hoskin  56 Bronwyn A Hradsky  15 Jacinta E Humphrey  60   61 Paul R Jennings  62 Menna E Jones  19 Neil R Jordan  6   63 Catherine L Kelly  7 Malcolm S Kennedy  64 Monica L Knipler  17 Tracey L Kreplins  33   65 Kiara L L'Herpiniere  20 William F Laurance  66 Tyrone H Lavery  59 Mark Le Pla  15 Lily Leahy  60 Ashley Leedman  67 Sarah Legge  31   45 Ana V Leitão  59   68   69 Mike Letnic  26 Michael J Liddell  66 Zoë E Lieb  2 Grant D Linley  21 Allan T Lisle  70   71 Cheryl A Lohr  37 Natalya Maitz  2 Kieran D Marshall  40 Rachel T Mason  13 Daniela F Matheus-Holland  72 Leo B McComb  59 Peter J McDonald  73 Hugh McGregor  74 Donald T McKnight  75 Paul D Meek  9   76 Vishnu Menon  15 Damian R Michael  21 Charlotte H Mills  26 Vivianna Miritis  35 Harry A Moore  28   37 Helen R Morgan  50 Brett P Murphy  31 Andrew J Murray  77 Daniel J D Natusch  78 Heather Neilly  79   80 Paul Nevill  81 Peggy Newman  82 Thomas M Newsome  35 Dale G Nimmo  21 Eric J Nordberg  9   83 Terence W O'Dwyer  84 Sally O'Neill  85 Julie M Old  86 Katherine Oxenham  40 Matthew D Pauza  38 Ange J L Pestell  13 Benjamin J Pitcher  63   87 Christopher A Pocknee  2 Hugh P Possingham  2 Keren G Raiter  2   88   89 Jacquie S Rand  90   91 Matthew W Rees  92 Anthony R Rendall  13 Juanita Renwick  93 April Reside  2 Miranda Rew-Duffy  71 Euan G Ritchie  13 Chris P Roach  94 Alan Robley  95 Stefanie M Rog  96 Tracy M Rout  44 Thomas A Schlacher  97 Cyril R Scomparin  19 Holly Sitters  15   98 Deane A Smith  9   99 Ruchira Somaweera  100   101 Emma E Spencer  44 Rebecca E Spindler  20 Alyson M Stobo-Wilson  102 Danielle Stokeld  40   43 Louise M Streeting  9 Duncan R Sutherland  15   103 Patrick L Taggart  20 Daniella Teixeira  20   104 Graham G Thompson  88   105 Scott A Thompson  105   106 Mary O Thorpe  107 Stephanie J Todd  66 Alison L Towerton  108 Karl Vernes  9 Grace Waller  109 Glenda M Wardle  35 Darcy J Watchorn  13   110 Alexander W T Watson  72 Justin A Welbergen  30 Michael A Weston  13   111 Baptiste J Wijas  26 Stephen E Williams  66 Luke P Woodford  95 Eamonn I F Wooster  21 Elizabeth Znidersic  21 Matthew S Luskin  1   2
Affiliations
Review

Large-scale and long-term wildlife research and monitoring using camera traps: a continental synthesis

Tom Bruce et al. Biol Rev Camb Philos Soc. 2025 Apr.

Abstract

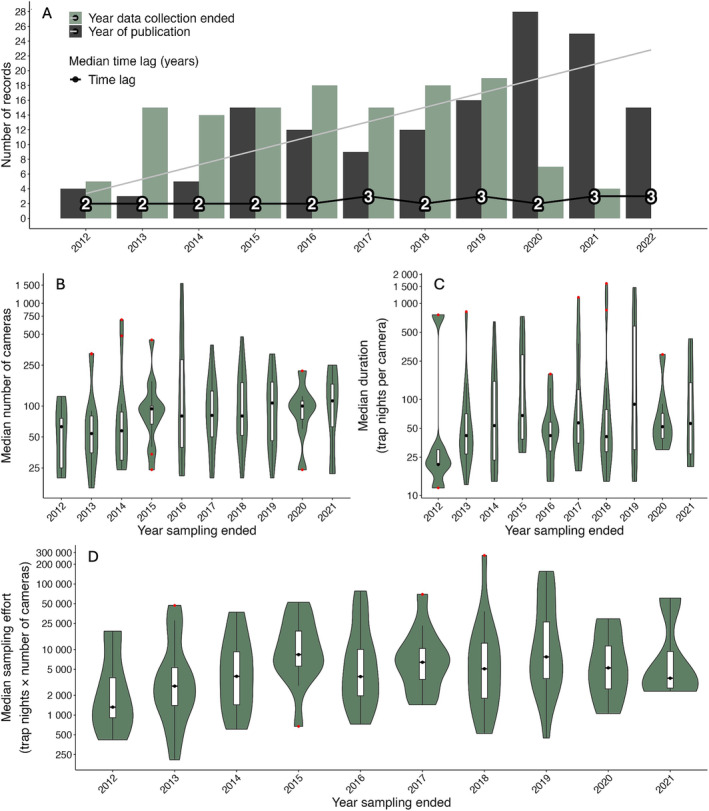
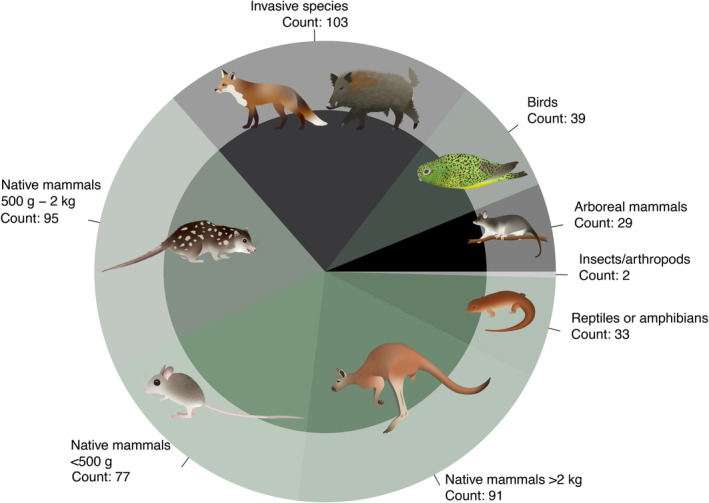
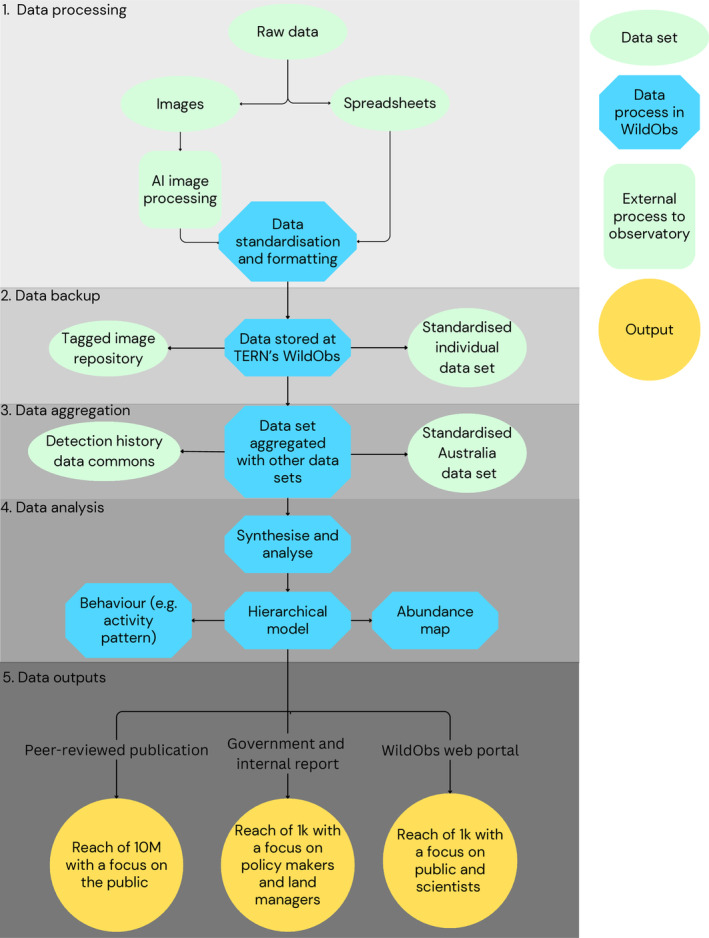
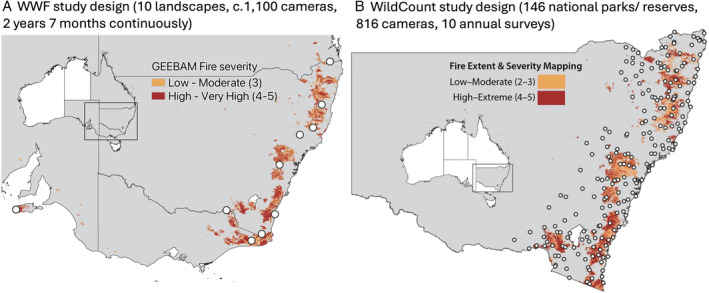
Camera traps are widely used in wildlife research and monitoring, so it is imperative to understand their strengths, limitations, and potential for increasing impact. We investigated a decade of use of wildlife cameras (2012-2022) with a case study on Australian terrestrial vertebrates using a multifaceted approach. We (i) synthesised information from a literature review; (ii) conducted an online questionnaire of 132 professionals; (iii) hosted an in-person workshop of 28 leading experts representing academia, non-governmental organisations (NGOs), and government; and (iv) mapped camera trap usage based on all sources. We predicted that the last decade would have shown: (i) exponentially increasing sampling effort, a continuation of camera usage trends up to 2012; (ii) analytics to have shifted from naive presence/absence and capture rates towards hierarchical modelling that accounts for imperfect detection, thereby improving the quality of outputs and inferences on occupancy, abundance, and density; and (iii) broader research scales in terms of multi-species, multi-site and multi-year studies. However, the results showed that the sampling effort has reached a plateau, with publication rates increasing only modestly. Users reported reaching a saturation point in terms of images that could be processed by humans and time for complex analyses and academic writing. There were strong taxonomic and geographic biases towards medium-large mammals (>500 g) in forests along Australia's southeastern coastlines, reflecting proximity to major cities. Regarding analytical choices, bias-prone indices still accounted for ~50% of outputs and this was consistent across user groups. Multi-species, multi-site and multiple-year studies were rare, largely driven by hesitancy around collaboration and data sharing. There is no widely used repository for wildlife camera images and the Atlas of Living Australia (ALA) is the dominant repository for sharing tabular occurrence records. However, the ALA is presence-only and thus is unsuitable for creating detection histories with absences, inhibiting hierarchical modelling. Workshop discussions identified a pressing need for collaboration to enhance the efficiency, quality and scale of research and management outcomes, leading to the proposal of a Wildlife Observatory of Australia (WildObs). To encourage data standards and sharing, WildObs should (i) promote a metadata collection app; (ii) create a tagged image repository to facilitate artificial intelligence/machine learning (AI/ML) computer vision research in this space; (iii) address the image identification bottleneck via the use of AI/ML-powered image-processing platforms; (iv) create data commons for detection histories that are suitable for hierarchical modelling; and (v) provide capacity building and tools for hierarchical modelling. Our review highlights that while Australia's investments in monitoring biodiversity with cameras position it to be a global leader in this context, realising that potential requires a paradigm shift towards best practices for collecting, curating, sharing and analysing 'Big Data'. Our findings and framework have broad applicability outside Australia to enhance camera usage to meet conservation and management objectives ranging from local to global scales. This review articulates a country/continental observatory approach that is also suitable for international collaborative wildlife research networks.

Keywords: Australia; big data; biodiversity conservation; data sharing; occupancy modelling; sampling methods; terrestrial vertebrates.


Figures

Fig. 1
Fig. 1
Temporal trends in the use of wildlife cameras in Australia from peer‐reviewed literature. (A) Year of publication (dark grey bars) and the last year of sampling (light green bars). The black line and numbers indicate the median time lag between the year sampling ended and the year the item was published. (B–D) Median effort, which remained highly variable but may have started to plateau at 75–100 cameras deployed per survey that were left for 50–65 days, thus totalling ~5000 total trap nights. All values on the y‐axis in (B–D) are log10 transformed; black dots in the box plot indicate the median value for the year sampling ended; red points are outliers. Trap nights are calculated as the number of cameras multiplied by duration.
Fig. 2
Fig. 2
Preferences and motivations for different methods used to sample wildlife. Results show responses from 132 Australian camera users who completed an online questionnaire. Sampling approaches demonstrated a strong preference for cameras regarding (A) data quality and (B) cost‐effectiveness. (C) Results of a binary logistic regression showing odds ratios where values >1 (vertical black line) indicate a positive association (more likely) and <1 a negative association (less likely). An asterisk next to the variable name indicates the overall model was significant using a chi‐squared test. A solid filled point is used where the 95% confidence intervals do not overlap 1.
Fig. 3
Fig. 3
Only half of Australian wildlife camera analyses correct for detection probabilities. (A) Summary of published studies. (B) Responses from 132 Australian camera users who completed an online questionnaire. Methods were grouped by whether they ignored bias associated with the imperfect detection, such as in presence/absence, naïve occupancy (percentage of cameras detecting the species) or capture rates [or their modified forms, such as relative abundance index (RAI) or Allen's index]. Animal behaviour studies were primarily concerned with behaviours like carcass and nest discovery and likely used indices to understand issues such as bait uptake. (C) Results of a binary logistic regression showing odds ratios where values >1 (vertical black line) indicate a positive association (more likely) and <1 a negative association (less likely). An asterisk next to the variable name indicates the overall model was significant using a chi‐squared test. A solid filled point is used where the 95% confidence intervals do not overlap 1.
Fig. 4
Fig. 4
Questionnaire participants indicated which taxa they sampled with cameras, summarized here with larger areas reflecting more users. Animal symbols courtesy of the NESP Resilient Landscapes Hub, nesplandscapes.edu.au.
Fig. 5
Fig. 5
Distribution of camera surveys in Australia. (A, B) Number of camera surveys per 2500 km2 hexagonal cell from published literature and questionnaire data (A, with the inset showing values per state), and potential (unconfirmed) sites from the Atlas of Living Australia (B). (C) Published (grey) and questionnaire survey locations (green), with symbol size scaled to the number of cameras reported to be deployed. (D) Published and questionnaire surveys per habitat, ordered from largest area (left) to smallest (right). Above the bars, drawings indicate the biome: trees represent largely forested biomes; grass indicates grassland or savannah; spinifex grass indicates shrub and desert biomes. The inset map shows the spatial distribution of each biome in Australia. Specific biome names from the ecoregion layer, from left to right, are: (i) deserts and xeric shrublands; (ii) tropical and subtropical grasslands; (iii) mediterranean forests; woodlands and scrub; (iv) temperate grasslands and savannahs; (v) temperate broadleaf and mixed forest; (vi) tropical and subtropical moist broadleaf; and (vii) montane grasslands and shrublands.
Fig. 6
Fig. 6
Framework for a distributed network of wildlife camera data providers and its outputs. Data are ingested as raw images or spreadsheets, then standardised, collated, and stored permanently as a data commons, located in existing trusted data providers such as the Atlas of Living Australia (ALA) and the Terrestrial Ecosystem Research Network (TERN). ALA and TERN must add new functionality to store and share detection histories as opposed to presence‐only data. The data are then analysed using hierarchical modelling on high‐performance computing clusters (HPCC) with open‐access code hosted on GitHub. This transparent workflow scales rapidly and is designed for timely outputs for government or NGO reports or peer‐reviewed publications. Data contributors are updated with biannual newsletters and collaboration requests generated between users requesting specific access to data sets. AI, artificial intelligence.
Fig. 7
Fig. 7
Case studies using cameras for large‐scale long‐term monitoring in Australia. (A) Locations of the 10 major ‘Eyes on Recovery’ study sites denoted by circles with the extent of areas that burnt according to the Google Earth Engine Burnt Area Map (GEEBAM) data set. Low to Moderate burning is represented in orange and High to Very High is in red. (B) Locations of the 204 WildCount monitoring sites denoted by hollow white circles distributed across 146 national parks and reserves in New South Wales; Fire Extent and Severity Mapping (FESM) where burns that were Low to Moderate are represented in orange and High to Extreme are in red (redrawn from Fig. 1 of Lavery et al. 2024).

Similar articles

Cited by

References

    1. Ahumada, J. A. , Fegraus, E. , Birch, T. , Flores, N. , Kays, R. , O'Brien, T. G. , Palmer, J. , Schuttler, S. , Zhao, J. Y. , Jetz, W. , Kinnaird, M. , Kulkarni, S. , Lyet, A. , Thau, D. , Duong, M. , et al. (2020). Wildlife insights: a platform to maximize the potential of camera trap and other passive sensor wildlife data for the planet. Environmental Conservation 47(1), 1–6.
    1. Amir, Z. , Sovie, A. & Luskin, M. S. (2022). Inferring predator–prey interactions from camera traps: a Bayesian co‐abundance modeling approach. Ecology and Evolution 12(12), e9627. - PMC - PubMed
    1. ARDC (2021). Restricted Access Species Data Pathways From Decision Making to Research. https://ardc.edu.au/project/restricted-access-species-data-pathways-from....
    1. ARDC (2023). ARDC Planet RDC Ecological and Biodiversity Workshop Report (1.0). Zenodo. 10.5281/zenodo.8433538. - DOI
    1. Australian Bureau of Statistics (2022). Australian population grid 2022 in ESRI Grid format. https://www.abs.gov.au/statistics/people/population/regional-population/....

LinkOut - more resources