Review
. 2025 Jan;25(1):5-114.
doi: 10.5230/jgc.2025.25.e11.

Korean Practice Guidelines for Gastric Cancer 2024: An Evidence-based, Multidisciplinary Approach (Update of 2022 Guideline)

Affiliations
Review

Korean Practice Guidelines for Gastric Cancer 2024: An Evidence-based, Multidisciplinary Approach (Update of 2022 Guideline)

In-Ho Kim et al. J Gastric Cancer. 2025 Jan.

Abstract

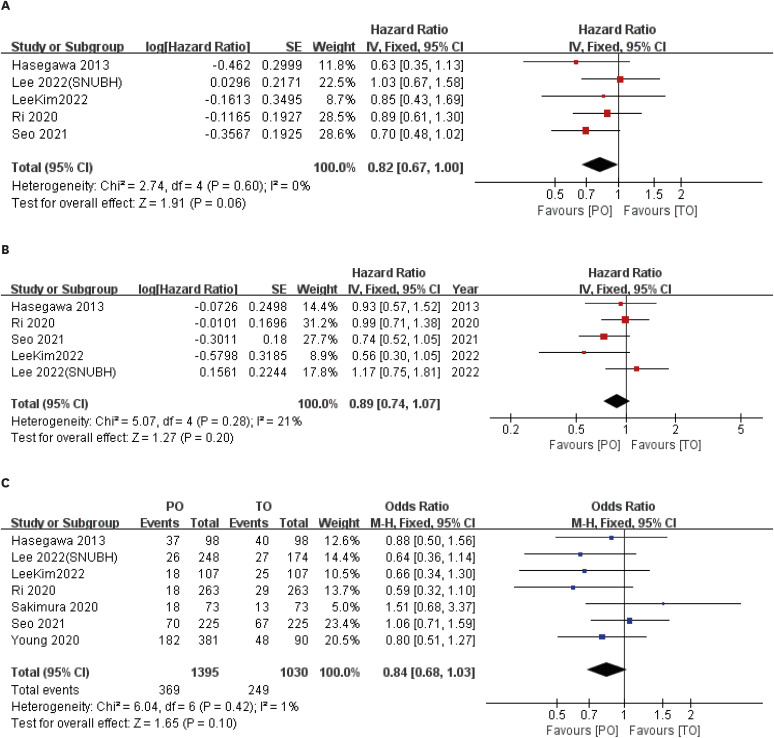
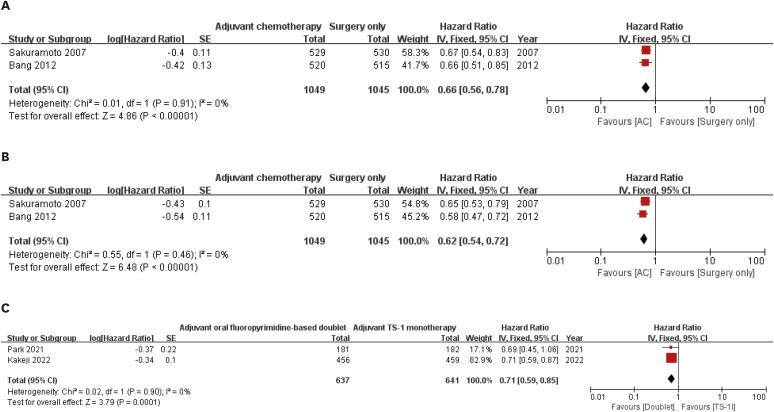
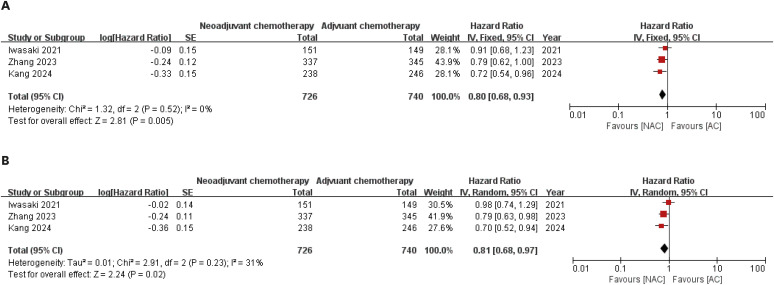
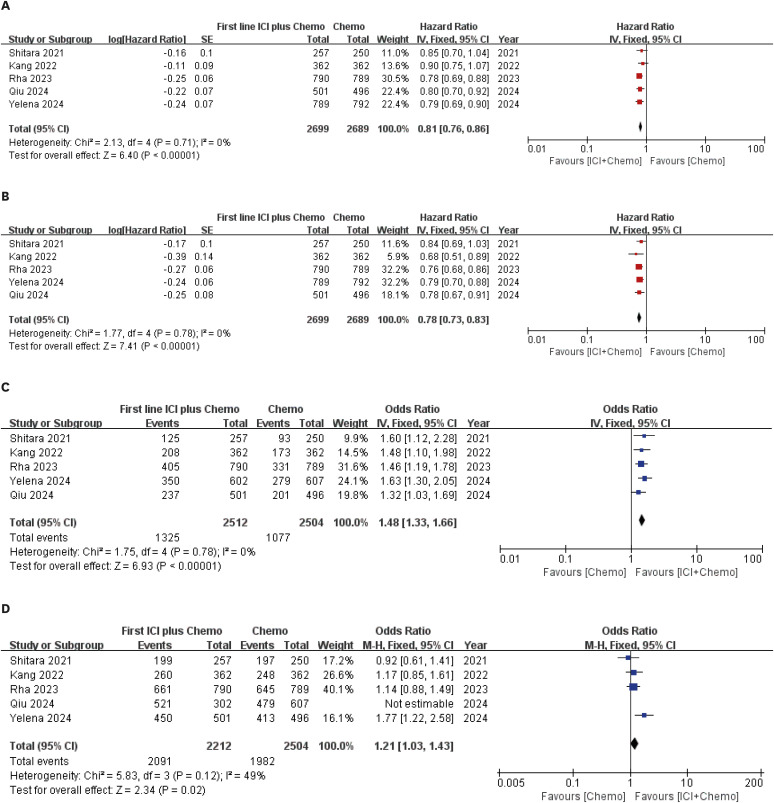
Gastric cancer is one of the most common cancers in both Korea and worldwide. Since 2004, the Korean Practice Guidelines for Gastric Cancer have been regularly updated, with the 4th edition published in 2022. The 4th edition was the result of a collaborative work by an interdisciplinary team, including experts in gastric surgery, gastroenterology, endoscopy, medical oncology, abdominal radiology, pathology, nuclear medicine, radiation oncology, and guideline development methodology. The current guideline is the 5th version, an updated version of the 4th edition. In this guideline, 6 key questions (KQs) were updated or proposed after a collaborative review by the working group, and 7 statements were developed, or revised, or discussed based on a systematic review using the MEDLINE, Embase, Cochrane Library, and KoreaMed database. Over the past 2 years, there have been significant changes in systemic treatment, leading to major updates and revisions focused on this area. Additionally, minor modifications have been made in other sections, incorporating recent research findings. The level of evidence and grading of recommendations were categorized according to the Grading of Recommendations, Assessment, Development and Evaluation system. Key factors for recommendation included the level of evidence, benefit, harm, and clinical applicability. The working group reviewed and discussed the recommendations to reach a consensus. The structure of this guideline remains similar to the 2022 version. Earlier sections cover general considerations, such as screening, diagnosis, and staging of endoscopy, pathology, radiology, and nuclear medicine. In the latter sections, statements are provided for each KQ based on clinical evidence, with flowcharts supporting these statements through meta-analysis and references. This multidisciplinary, evidence-based gastric cancer guideline aims to support clinicians in providing optimal care for gastric cancer patients.

Keywords: Chemotherapy; Endoscopy; Guidelines; Stomach neoplasms; Surgery.


Conflict of interest statement

No potential conflict of interest relevant to this article was reported.

Figures

Fig. 1
Fig. 1. Forest plot comparing staging accuracy between MPR plus axial plane vs. axial plane only in multidetector row computed tomography.
MPR = multiplanar reformation; CI = confidence interval.
Fig. 2
Fig. 2. Forest plot for comparison of local recurrence. (A) Risk of local recurrence in endoscopic treatment group vs. follow-up without therapy group. (B) Risk of local recurrence in endoscopic treatment group vs. gastrectomy.
Tx = treatment; CI = confidence interval; M-H = Mantel-Haenszel.
Fig. 3
Fig. 3. Forest plot for a comparison of the risk of metachronous gastric cancer between Helicobacter pylori eradication vs. no treatment.
SE = standard error; IV = interval variable; CI = confidence interval.
Fig. 4
Fig. 4. Forest plots comparing reconstruction methods. (A) Operation time. (B) Complications. (C) Hospital stays. (D) Bile reflux. (E) Esophageal reflux.
SD = standard deviation; IV = interval variable; M-H = Mantel-Haenszel; CI = confidence interval.
Fig. 5
Fig. 5. Forest plots for comparison between PG DTR vs. TG in retrospective studies. (A) Vitamin B12 deficiency. (B) Weight loss. (C) Early complications. (D) Reflux symptom.
PG = proximal gastrectomy; DTR = double tract reconstruction; TG = total gastrectomy; IV = interval variable; M-H = Mantel-Haenszel; CI = confidence interval; SD = standard deviation.
Fig. 6
Fig. 6. Forest plot for a comparison between no splenectomy vs. splenectomy. (A) Survival. (B) Complications.
M-H = Mantel-Haenszel; CI = confidence interval.
Fig. 7
Fig. 7. Forest plot, LN metastasis rates of distal stomach according to the depth of tumor. (A) T2 vs. T3. (B) T2 vs. T4.
M-H = Mantel-Haenszel; LN = lymph node; CI = confidence interval.
Fig. 8
Fig. 8. Forest plots for comparisons between the TH abdominal approach (Experimental) vs. TT approach (Control). TT approaches in the observational studies included. In-hospital mortality: (A) RCTs, (B) Observational studies. Anastomosis leakage: (C) RCTs, (D) Observational studies. Pulmonary complications: (E) RCTs, (F) Observational studies. Five-year survival: (G) RCTs, (H) Observational studies.
TH = transhiatal; TT = transthoracic; M-H = Mantel-Haenszel; CI = confidence interval; RCT = randomized controlled trial.
Fig. 9
Fig. 9. Forest plots for comparison between the SNNS vs. conventional surgery (Conventional) in observational studies. (A) Overall survival. (B) Body weight: percentages compared to preoperative body weight.
SE = standard error; SNNS = sentinel node navigation surgery; SD = standard deviation; IV = interval variable; CI = confidence interval.
Fig. 10
Fig. 10. Forest plots for comparisons between laparoscopic (Laparoscopy) and open (Conventional) distal gastrectomy in cStage I gastric cancer. (A) Overall survival. (B) Complications. (C) Intraoperative blood loss.
SE = standard error; SD = standard deviation; IV = interval variable; M-H = Mantel-Haenszel; CI = confidence interval.
Fig. 11
Fig. 11. Forest plots for comparisons between laparoscopic (Laparoscopy) and open (Conventional) distal gastrectomy in cT2-4a gastric cancer. (A) Overall survival. (B) Complications. (C) Hospital stays (day). (D) Operation time (minutes). (E) Intraoperative blood loss (mL).
SE = standard error; SD = standard deviation; IV = interval variable; M-H = Mantel-Haenszel; CI = confidence interval.
Fig. 12
Fig. 12. Forest plots for comparisons between daVinci™ robot gastrectomy (Robotic) vs. laparoscopic gastrectomy (Laparoscopic). (A) Complications (RCTs). (B) Pancreatic fistula (RCTs and observational studies). (C) Overall survival (observational studies). (D) Operation time (observational studies).
SE = standard error; SD = standard deviation; IV = interval variable; M-H = Mantel-Haenszel; CI = confidence interval; RCT = randomized controlled trial.
Fig. 13
Fig. 13. Forest plots for comparisons between PO vs. TO in advanced gastric cancer in observational studies. (A) Overall survival (propensity score matched). (B) Relapse-free survival (propensity score matched). (C) Complications.
PO = partial omentectomy; TO = total omentectomy; SE = standard error; IV = interval variable; CI = confidence interval.
Fig. 14
Fig. 14. Forest plots for comparisons between AC vs. surgery only and doublet vs. S1 monotherapy. (A) Overall survival for AC vs. surgery only (Surgery only). (B) DFS for AC vs. surgery only (Surgery only). (C) DFS for oral fluoropyrimidine-based doublet (Doublet) vs. S1 monotherapy (TS-1).
SE = standard error; IV = interval variable; CI = confidence interval; AC = adjuvant chemotherapy; DFS = disease-free survival.
Fig. 15
Fig. 15. Forest plot for a comparison between NAC as part of perioperative chemotherapy vs. AC). (A) Overall survival. (B) Progression free survival.
SE = standard error; IV = interval variable; CI = confidence interval; NAC = neoadjuvant chemotherapy; AC = adjuvant chemotherapy.
Fig. 16
Fig. 16. Forest plots for comparisons between palliative first-line ICI+Chemo vs. Chemo in human epidermal growth factor receptor 2 negative patients. (A) Overall survival. (B) Progression-free survival. (C) Objective response rates (D) Disease control rates.
Chemo = chemotherapy; SE = standard error; IV = interval variable; M-H = Mantel-Haenszel; CI = confidence interval; ICI = immune checkpoint inhibitor.
Fig. 17
Fig. 17. Forest plots for comparisons between palliative first-line ICI+Chemo vs. Chemo in human epidermal growth factor receptor 2 negative patients according to PD-L1 expression level. (A) Overall survival in patients with PD-L1 CPS ≥1 (B) Progression-free survival in patients with PD-L1 CPS ≥1 (C) Overall survival in patients with PD-L1 CPS ≥5. (D) Progression-free survival in patients with PD-L1 CPS ≥5. (E) Overall survival in patients with PD-L1 CPS ≥10. (F) Progression-free survival in patients with PD-L1 CPS ≥10.
Chemo = chemotherapy; ICI = immune checkpoint inhibitor; SE = standard error; IV = interval variable; CI = confidence interval; PD-L1 = programmed cell death ligand-1; CPS = combined positive score.
Fig. 18
Fig. 18. Forest plots for comparisons between palliative first-line ZOL+Chemo vs. Chemo in human epidermal growth factor receptor 2 negative patients. (A) Overall survival. (B) Progression-free survival. (C) Objective response rates. (D) Disease control rates.
ZOL = zolbetuximab; Chemo = chemotherapy; SE = standard error; IV = interval variable; CI = confidence interval.
Fig. 19
Fig. 19. Forest plots for comparisons between palliative first-line T+Chemo vs. Chemo in ToGA trial. (A) Overall survival in all patients. (B) Overall survival in in patients with HER2 2+/FISH+ or IHC 3+ and IHC 0 or 1+/FISH+. (C) Progression-free survival in all patients. (D) Objective response rates in all patients (E) Disease control rates in all patients.
T = trastuzumab; Chemo = chemotherapy; SE = standard error; IV = interval variable; CI = confidence interval; HER2 = human epidermal growth factor receptor 2; IHC = immunohistochemistry; FISH = fluorescence in situ hybridization.
Fig. 20
Fig. 20. Forest plots for comparisons between palliative first-line P+T+Chemo vs. T+Chemo in human epidermal growth factor receptor 2 positive patients. (A) Overall survival in all patients. (B) Overall survival in patients with PD-L1 CPS ≥1 and <1. (C) Progression-free survival in all patients. (D) Progression-free survival in patients with PD-L1 CPS ≥1 and <1. (E) Objective response rates in all patients. (F) Disease control rates in all patients.
P = pembrolizumab; T = trastuzumab; Chemo = chemotherapy; SE = standard error; IV = interval variable; CI = confidence interval; PD-L1 = programmed cell death ligand-1; CPS = combined positive score.
Fig. 21
Fig. 21. Forest plots for comparisons between palliative second-line systemic Tx vs. BSC or placebo. (A) Overall survival. (B) Progression-free survival. (C) Objective response rates. (D) Disease control rates.
Tx = therapy; BSC = best supportive care; SE = standard error; IV = interval variable; CI = confidence interval.
Fig. 22
Fig. 22. Forest plots for comparisons between palliative second-line Ram+PTX vs. PTX. (A) Overall survival. (B) Progression-free survival. (C) Objective response rates. (D) Disease control rates.
Ram = ramucirumab; PTX = paclitaxel; SE = standard error; IV = interval variable; CI = confidence interval.
Fig. 23
Fig. 23. Forest plots for comparisons between palliative third-line systemic Tx vs. BSC or placebo. (A) Overall survival. (B) Progression-free survival. (C) Objective response rate. (D) Disease control rate.
Tx = therapy; BSC = best supportive care; SE = standard error; IV = interval variable; CI = confidence interval.
Fig. 24
Fig. 24. Forest plots for comparison between adjuvant concurrent CRT vs. adjuvant platinum-based combination CA. (A) Overall survival. (B) Disease-free survival. (C) Locoregional recurrence.
CRT = chemoradiation therapy; CA = chemotherapy alone; SE = standard error; IV = interval variable; CI = confidence interval; M-H = Mantel-Haenszel.
Fig. 25
Fig. 25. Forest plots for comparisons between NCRT compared to NCT. (A) Overall survival. (B) Pathologic complete response. (C) Pathologic complete nodal regression. (D) R0 resection.
NCRT = neoadjuvant chemoradiation; NCT = neoadjuvant chemotherapy; SE = standard error; IV = interval variable; CI = confidence interval; M-H = Mantel-Haenszel.
Fig. 26
Fig. 26. Forest plots of procedure outcomes between stent insertion (Stenting) and surgery (Surgery). (A) Technical success. (B) Clinical success. (C) Procedure related mortality.
CI = confidence interval; M-H = Mantel-Haenszel.
Fig. 27
Fig. 27. Forest plots of post procedure or operative outcomes between stent insertion (Stenting) and surgery (Surgery). (A) Resumption of oral intake. (B) Duration of hospital stay. (C) Minor complications. (D) Major complications. (E) Re-intervention. (F) Patency duration. (G) Overall survival.
SD = standard deviation; IV = interval variable; CI = confidence interval; M-H = Mantel-Haenszel.
Fig. 28
Fig. 28. Forest plot for overall survival between CS vs. CA in metastatic gastric cancer.
CS = conversion surgery after chemotherapy; CA = chemotherapy alone; SE = standard error; IV = interval variable; CI = confidence interval.
Fig. 29
Fig. 29. Forest plot for comparison of overall survival between surgery, mastectomy and gastrectomy with chemotherapy (Surgery) vs. CA in gastric cancer with oligometastasis confined to liver from observational studies.
CA = chemotherapy alone; SE = standard error; IV = interval variable; CI = confidence interval.
Fig. 30
Fig. 30. Forest plot for comparison of overall survival between surgery, oophorectomy with chemotherapy (Surgery) vs. CA in gastric cancer with oligometastasis confined to liver from observational studies.
CA = chemotherapy alone; SE = standard error; IV = interval variable; CI = confidence interval.
Flowchart 1
Flowchart 1. Overall treatment algorithm.
PET = positron emission tomography; CT = computed tomography; EGD = esophagogastroduodenoscopy; EUS = endoscopic ultrasound; MDCT = multidetector row computed tomography; MRI = magnetic resonance imaging; Diff = well or moderately differentiated; UI = ulcer lesion; UnDiff = poorly differentiated/poorly cohesive (including signet-ring cell); ESD = endoscopic submucosal dissection.
Flowchart 2
Flowchart 2. Endoscopic treatment.
Diff = well or moderately differentiated; UI = ulcer lesion; UnDiff = poorly differentiated/poorly cohesive (including signet-ring cell); ESD = endoscopic submucosal dissection; APC = argon plasma coagulation.
Flowchart 3
Flowchart 3. Approach and extent of gastrectomy.
DG = distal gastrectomy; TG = total gastrectomy; PPG = pylorus-preserving gastrectomy; PG = proximal gastrectomy; LND = lymph node dissection; LN = lymph node.
Flowchart 4
Flowchart 4. Treatment plans after gastrectomy.
LN = lymph node; CAPOX = capecitabine and oxaliplatin. *To obtain negative margin, single or combinations of various methods including intraoperative frozen section, perioperative gastroscopy, various preoperative clipping or dyeing, fluorescence imaging technique, ultrasonography, and simple X-ray, etc. can be applied. Preferred in pStage II with LN+ or pStage III.
Flowchart 5
Flowchart 5. Treatment guidelines in gastroesophageal junction adenocarcinoma.
ESD = endoscopic submucosal dissection; TG = total gastrectomy; PG = proximal gastrectomy; LND = lymph node dissection.
Flowchart 6
Flowchart 6. Treatment guideline for palliative systemic therapy.
HER2 = human epidermal growth factor receptor 2; PD-L1 = programmed cell death-ligand 1; CPS = combined positive score; FOLFOX = 5-fluorouracil, leucovorin, and oxaliplatin; CAPOX = capecitabine and oxaliplatin; CLDN18.2 = Claudin 18.2; FP = 5-fluorouracil and cisplatin; XP = capecitabine plus cisplatin; MSI-H = microsatellite instability-high; dMMR = mismatch repair deficient. *Evaluation of performance status, comorbidities, and organ function → Best supportive care if unfit for systemic therapy.

Similar articles

Cited by

References

    1. Ferlay JEM, Lam F, Laversanne M, Colombet M, Mery L, Piñeros M, et al. Global Cancer Observatory: Cancer Today. Lyon: International Agency for Research on Cancer; 2024.
    1. Park EH, Jung KW, Park NJ, Kang MJ, Yun EH, Kim HJ, et al. Cancer statistics in Korea: incidence, mortality, survival, and prevalence in 2021. Cancer Res Treat. 2024;56:357–371. - PMC - PubMed
    1. Park SH, Kang MJ, Yun EH, Jung KW. Epidemiology of gastric cancer in Korea: trends in incidence and survival based on Korea Central Cancer Registry data (1999-2019) J Gastric Cancer. 2022;22:160–168. - PMC - PubMed
    1. Information Committee of the Korean Gastric Cancer Association. Korean Gastric Cancer Association-led nationwide survey on surgically treated gastric cancers in 2019. J Gastric Cancer. 2021;21:221–235. - PMC - PubMed
    1. World Cancer Research Fund Network. Diet, nutrition, physical activity and stomach cancer [Internet] London: World Cancer Research Fund Network; 2018. [cited 2023 Jan 1]. Available from: https://www.wcrf.org/wp-content/uploads/2024/10/stomach-cancer-report.pdf.