. 2024 Sep 18;9(12):1409-1425.
doi: 10.1016/j.jacbts.2024.07.009. eCollection 2024 Dec.

Exercise Therapy Rescues Skeletal Muscle Dysfunction and Exercise Intolerance in Cardiometabolic HFpEF

Affiliations

Exercise Therapy Rescues Skeletal Muscle Dysfunction and Exercise Intolerance in Cardiometabolic HFpEF

Heather Quiriarte et al. JACC Basic Transl Sci. .

Abstract

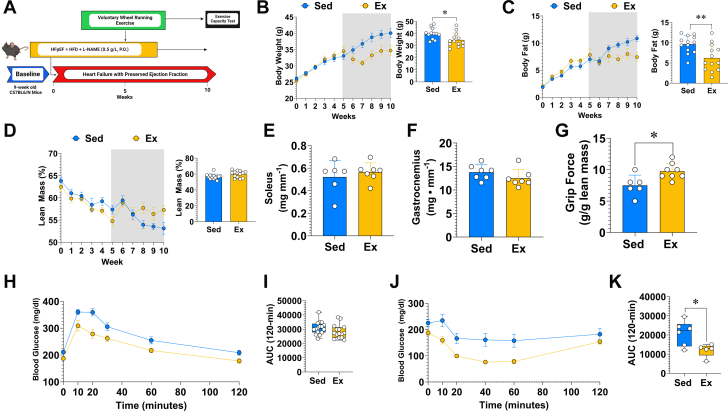
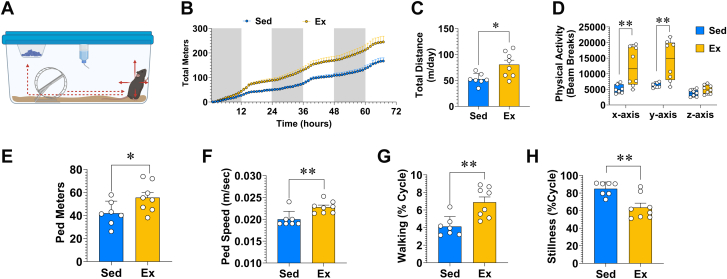
Exercise intolerance, a hallmark of heart failure with preserved ejection fraction (HFpEF) exacerbated by obesity, involves unclear mechanisms related to skeletal muscle metabolism. In a "2-hit" model of HFpEF, we investigated the ability of exercise therapy (voluntary wheel running) to reverse skeletal muscle dysfunction and exercise intolerance. Using state-of-the-art metabolic cages and a multiomic approach, we demonstrate exercise can rescue dysfunctional skeletal muscle lipid and branched-chain amino acid oxidation and restore exercise capacity in mice with cardiometabolic HFpEF. These results underscore the importance of skeletal muscle metabolism to improve exercise intolerance in HFpEF.

Keywords: branched-chained amino acids; exercise; heart failure with preserved ejection fraction; metabolism; mitochondria.


Conflict of interest statement

These studies were supported by grants from the National Institutes of Health (P20GM135002, U54GM104940, and P30AG050911 to Dr Allerton; and HL146098, HL146514, and HL151398 to Dr Lefer), William Prescott Foster Professorship (to Dr Irving), an American Heart Association Postdoctoral fellowship (20POST35200075 to Dr Li. Stampley is a recipient of the Southeastern Conference (SEC) Scholars Fund. Jake Doiron is the recipient of a training fellowship from the NIH National CCTS awarded to the University of Alabama at Birmingham as part of a TL1 Training Grant (TL1TR003106). All other authors have reported that they have no relationships relevant to the contents of this paper to disclose.

Figures

None
Graphical abstract
Figure 1
Figure 1
Mitochondrial Dysfunction and Impaired Substrate Use in HFpEF Skeletal Muscle (A) Bulk RNA-sequencing (RNA-seq) and proteomics were performed on mixed gastrocnemius skeletal muscle after 10 weeks of chow (Control) or high-fat diet– N(ω)-nitro-L-arginine methyl ester (HFD+L-NAME) (heart failure with preserved ejection fraction [HFpEF]) (n = 8 per group). (B) Volcano plot showing the differential gene expression response between control and HFpEF mice. (C) Heatmap showing the top 50 (P value) differentially expressed genes between HFpEF and control. (D,E) Dot plot pathway analysis showing the significance of pathways enriched between HFpEF and control for RNA-seq and proteomics, respectively. (F) Venn diagram demonstrating the overlap between shared genes and proteins that were differentially changed between HFpEF and control skeletal muscle. (G) Linear regression demonstrating the relationship between log2 fold change (FC) in messenger RNA (mRNA) and protein. 14Carbon-oxidation (n = 6-8) of skeletal muscle (gastrocnemius) homogenates after 10 weeks of HFD+L-NAME treatment for (H) completed fatty acid oxidate (FAO) (palmitate), (I) incomplete FAO to 14acid-soluble metabolites and (J) leucine. (K) LEAK state respiration and (L) respiratory control ratio for permeabilized soleus muscle fibers (n = 9-12). All data are presented as mean ± SD. An unpaired Student’s t-test was used to determine the significance (H toL). A false discovery rate (FDR) <0.05 with a log2 FC was used to determine significantly changed targets (I to K). Simple linear regression was used to determine significance (G). All data are presented as mean ± SD. An unpaired Student’s t-test was used to determine significance for A to C. ∗P < 0.05, ∗∗P < 0.01, ∗∗∗P < 0.001. Acyl-CoA = acetyl–coenzyme A ; BCAA = branched-chain amino acid; PPAR = peroxisome proliferator-activated receptor.
Figure 2
Figure 2
Wheel Running Exercise Improves Muscle Function and Metabolic Health in HFpEF Mice (A) Five weeks after the onset of HFpEF (HFD+L-NAME) mice were randomly assigned to the exercise (Ex) group and housed in cages with running wheels or single-housed in a standard cage to mimic a sedentary (Sed) condition. (B) Body mass, (C) body fat, and (D) lean mass were assessed weekly. The shaded area indicates the start of 5-week Ex training or Sed conditions. The adjoining bar graph represents the week 10 measurement. (E) Soleus and gastrocnemius (F) wet weight were measured immediately after sacrifice. (G) Average forelimb grip force production after 5 weeks of exercise. (H, I) Oral glucose tolerance and (J, K) insulin tolerance in Sed vs Ex mice. All data are presented as mean ± SD. An unpaired Student’s t-test was used to determine the significance for B to J. A mixed model was used to determine the difference between glucose (G) and insulin tolerance (I). ∗P < 0.05. ∗∗P < 0.01. AUC = area under the curve; P.O. = orally; other abbreviations as in Figure 1.
Figure 3
Figure 3
Exercise Training Increases Voluntary Exercise EE and Promotes Whole-Body Lipid Oxidation In Vivo At the end of the 5-week training or sedentary period, mice were placed in metabolic cages with a locked running wheel for 3 days. After the 3-day nonexercise period, the running wheels were then unlocked to measure voluntary exercise capacity. (A) Metabolic cage analysis of oxygen uptake (Vo2) and CO2 (Vco2) production during periods of wheel running. (B) Three-day representation and (C) average total energy expenditure (EE). (D) EE per bout of wheel running. (E) Relationship between EE and distance per bout. (F) Three-day representation and (G) average respiratory exchange ratio (RER) during wheel running. (H) Average relative fat oxidation. (I) Three-day representation of average hourly wheel running (counts/h), (J) daily running distance, (K) running distance per bout, (L) the percentage of time cycle engaged in wheel running, (M) nonstop running distance per bout, (I) average running speed per bout. All data are presented as mean ± SD with 7-8 mice per group. An unpaired Student’s t-test was used to determine significance for D, G, H, J, K, L, M, and N and simple linear regression for E. ∗P < 0.05, ∗∗P < 0.01. NREE = nonresting energy expenditure; NS = not significant; REE = resting energy expenditure; VWR = voluntary wheel running; other abbreviations as in Figure 2.
Figure 4
Figure 4
Wheel Running Exercise Increases SPA (A) Spontaneous physical activity (SPA) monitored during the “off-wheel” period. (B) Three-day representation and (C) distance in cage. (D) Physical activity is expressed as beam breaks in the x-, y-, and z-axes. Average walking (E) distance and (F) speed per cycle. (G) Percentage of time during the cycle without movement. All data are presented as mean ± SD with 7-8 mice per group. An unpaired Student’s t-test was used to determine significance (C to H). ∗P < 0.05, ∗∗P < 0.01. Ped = pedometer; other abbreviations as in Figure 2.
Figure 5
Figure 5
Wheel Running Exercise Reverses Skeletal Muscle Metabolic Dysfunction in HFpEF (A) Schematic overview of analysis pipeline for Sedentary and Exericse HFpEF mice. (B) Volcano plots demonstrating the change in gene expression (RNA-seq) of skeletal muscle (gastrocnemius) between Sed and Ex HFpEF mice. (C) WikiPathways (WIKI Pathway) database demonstrates regulation in response to exercise in HFpEF skeletal muscle. (D) Heatmap of top 50 differentially regulated genes (FDR P < 0.05) for Sed vs Ex HFpEF groups. (E) Targeted quantitative polymerase chain reaction of relevant genes from highly enriched pathways. (J) Enrichment plot of proteomic of biological pathways altered between Sed and Ex HFpEF mice. (G,H) Targeted proteomic quantification for (L) β-oxidation and BCAA catabolic peptides. 14C-oxidation (n = 6-8) of skeletal muscle (gastrocnemius) homogenates for (I) completed FAO (palmitate), (J) incomplete FAO to 14acid-soluble metabolites (ASM), (K) change in complete FAO with 10 mmol/L pyruvate, (K) leucine, and (L) pyruvate. All data are presented as mean ± SD. An FDR <0.05 with a log2 FC was used to determine a significantly alerted gene for RNA-seq (B to D). An unpaired Student’s t-test was used to determine the significance for E, G, H, I, J, K, and L. ∗P < 0.05, ∗∗P < 0.01, ∗∗∗P < 0.001. ATP = adenosine triphosphate; ETC = electron transport chain; NES = normalized enrichment score; other abbreviations as in Figures 1 and 2.
Figure 6
Figure 6
Exercise Remodels the Mitochondrial ETC Proteome (A) Skeletal muscle (gastrocnemius) complexes I and II, (B) complex III, (C) complex IV, and (D) complex V protein abundance in HFpEF Sed and Ex mice (n = 8-9 per group). All data are presented as mean ± SD. An unpaired Student’s t-test was used to determine the significance for A to D. ∗P < 0.05, ∗∗P < 0.01, ∗∗∗P < 0.001. Abbreviations as in Figures 1, 2, and 5.
Figure 7
Figure 7
Wheel Running Exercise Had No Effect on Cardiac Hemodynamics (A) Systolic blood pressure (SBP), (B) diastolic blood pressure (DBP), (C) tau, (D) left ventricular end-diastolic pressure (LVEDP), and (E) heart weight in HFpEF Sed vs Ex mice (n = 7-8 per group). (F) The relationship between daily wheel running and LVEDP. All data are presented as mean ± SD. An unpaired Student’s t-test was used to determine the significance for A to D. (F) Simple linear regression was used to analyze LVEDP vs running distance. HW/TL = heart weight to tibial length ratio; other abbreviations as in Figure 2.

References

    1. Borlaug B.A., Sharma K., Shah S.J., Ho J.E. Heart failure with preserved ejection fraction: JACC Scientific Statement. J Am Coll Cardiol. 2023;81(18):1810–1834. - PubMed
    1. Virani S.S., Alonso A., Benjamin E.J., et al. Heart disease and stroke statistics—2020 update a report from the American Heart Association. Circulation. 2020;141(9):e139–e596. - PubMed
    1. Tsao C.W., Lyass A., Enserro D., et al. Temporal trends in the incidence of and mortality associated with heart failure with preserved and reduced ejection fraction. JACC Heart Fail. 2018;6(8):678–685. - PMC - PubMed
    1. Shah K.S., Xu H., Matsouaka R.A., et al. Heart failure with preserved, borderline, and reduced ejection fraction: 5-year outcomes. J Am Coll Cardiol. 2017;70(20):2476–2486. - PubMed
    1. Gerber Y., Weston S.A., Redfield M.M., et al. A contemporary appraisal of the heart failure epidemic in Olmsted County, Minnesota, 2000 to 2010. JAMA Intern Med. 2015;175(6):996–1004. - PMC - PubMed

LinkOut - more resources