. 2024 Dec 27;7(3):735-747.
doi: 10.1039/d4na00797b. eCollection 2025 Jan 28.

Bone-derived nanoparticles (BNPs) enhance osteogenic differentiation via Notch signaling

Affiliations

Bone-derived nanoparticles (BNPs) enhance osteogenic differentiation via Notch signaling

Austin Stellpflug et al. Nanoscale Adv. .

Abstract

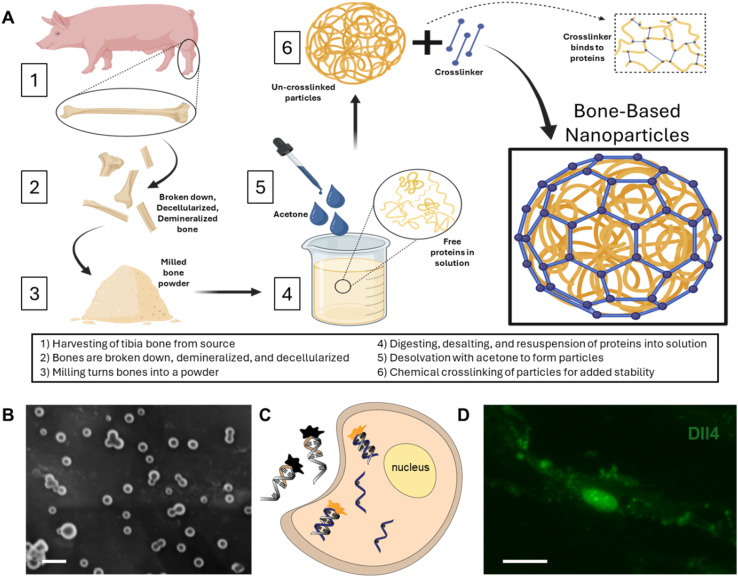
Mesenchymal stem cell (MSC)-based bone tissue regeneration has gained significant attention due to the excellent differentiation capacity and immunomodulatory activity of MSCs. Enhancing osteogenesis regulation is crucial for improving the therapeutic efficacy of MSC-based regeneration. By utilizing the regenerative capacity of bone ECM and the functionality of nanoparticles, we recently engineered bone-based nanoparticles (BNPs) from decellularized porcine bones. The effects of internalization of BNPs on MSC viability, proliferation, and osteogenic differentiation were first investigated and compared at different time points. The phenotypic behaviors, including cell number, proliferation, and differentiation were characterized and compared. By incorporating a LNA/DNA nanobiosensor and MSC live cell imaging, we monitored and compared Notch ligand delta-like 4 (Dll4) expression dynamics in the cytoplasm and nucleus during osteogenic differentiation. Pharmacological interventions are used to inhibit Notch signaling to examine the mechanisms involved. The results suggest that Notch inhibition mediates the osteogenic process, with reduced expression of early and late stage differentiation markers (ALP and calcium mineralization). The internalization of BNPs led to an increase in Dll4 expression, exhibiting a time-dependent pattern that aligned with enhanced cell proliferation and differentiation. Our findings indicate that the observed changes in BNP-treated cells during osteogenic differentiation could be associated with elevated levels of Dll4 mRNA expression. In summary, this study provides new insights into MSC osteogenic differentiation and the molecular mechanisms through which BNPs stimulate this process. The results indicate that BNPs influence osteogenesis by modulating Notch ligand Dll4 expression, demonstrating a potential link between Notch signaling and the proteins present in BNPs.


Conflict of interest statement

There are no conflicts to declar.

Figures

Fig. 1
Fig. 1. BNP fabrication process and the locked nucleic acid (LNA)/DNA nanobiosensor for investigation of Notch signaling in osteogenic differentiation. (A) Illustration of the fabrication process, including bone decellularization and demineralization, lyophilized bone milling, digesting and desalting bone ECM powder, and final synthesis. (B) SEM image of BNPs. Scale bar: 100 nm. (C) Biosensing mechanism of the LNA/DNA nanobiosensor. The detecting LNA probe, a 20-base nucleic acid molecule labeled with a fluorophore (6-FAM (fluorescein)) at the 5′ end, binds to the quencher probe to quench the fluorescence signal. After internalization by MSCs, LNA probes bind targeted mRNA in the cytoplasm and reacquire fluorescence. The fluorescence intensity thus serves as an indicator of the expression level of target mRNA. (D) Dll4 mRNA expression in a single MSC with BNP treatment (20 μg mL−1). Scale bar: 10 μm.
Fig. 2
Fig. 2. Effects of BNPs on cell proliferation. (A) Representative bright field and fluorescence images of MSCs in control and BNP treated groups. Images were taken 48 h after initial cell seeding. Cells were stained with EdU (10 μM), and Hoechst 33342 (blue), respectively. Cell nuclei with newly synthesized DNA within the last 12 h were labeled in red using a Click-iT EdU Imaging Kit (Invitrogen), while all other cell nuclei were labeled in blue. Scale bar: 50 μm. (B) and (C) Number (B) and percentage (C) of EdU-labeled nuclei in MSCs per field of view. Cell numbers were calculated manually by counting the number of nuclei in each field of view. At least 10 images were quantified for each condition. Data are expressed as mean ± s.e.m. (n = 3, p-values were calculated using a two-sample t-test with respect to the control. *p < 0.05; **p < 0.01; ***p < 0.005).
Fig. 3
Fig. 3. BNPs promote osteogenic differentiation of MSCs. (A) and (B) Representative images of MSCs under different treatments after 7 and 14 days of induction. CTR: control, cells were cultured in basal medium; OST: cells were induced using osteogenic induction medium; OST + BNP: cells were treated with BNPs (20 μg mL−1) and cultured in osteogenic induction medium. Scale bar: 200 μm. (C) Representative images of MSCs after 7 days of osteogenic induction in different groups. Scale bar: 200 μm. (D) Quantification of calcium mineralization after 7 and 14 days of osteogenic induction, respectively. The percentage of calcium deposition was quantified by measuring the ratio of ARS-stained cells to the total number of cells per field of view. A total of 10 images were quantified for each condition. Data are expressed as mean ± s.e.m. (n = 5).
Fig. 4
Fig. 4. Notch signaling modulates osteogenic differentiation in both control and BNP treated MSCs. (A) Representative bright field images of MSCs after days of osteogenic induction. For BNP treated groups, MSCs were treated with BNPs at the concentration of 20 μg mL−1 overnight for internalization. DAPT (20 μM) was added to MSCs for Notch inhibition. Scale bar: 100 μm. (B) Quantification and comparison of calcium mineralization after 21 days of osteogenic induction. The percentage of calcium deposition was quantified by measuring the ratio of ARS-stained cells to the total number of cells per field of view. A total of 10 images were quantified for each condition. (C) Representative fluorescence images of MSCs under different treatments after 3 days of osteogenic differentiation. For the control group, cells were maintained in basal culture medium for comparison. DAPT was administered at a concentration of 20 μM. The green fluorescence signal indicates Dll4 mRNA expression. Scale bar: 50 μm. (D) Comparison of mean fluorescence intensity of Dll4 mRNA expression of MSCs after 3 days of osteogenic induction under different treatments. Data represent over 100 cells in each group and are expressed as mean ± s.e.m. (n = 3, ***P < 0.001, **P < 0.01, *P < 0.05).
Fig. 5
Fig. 5. Dynamic single cell Dll4 mRNA expression analysis during osteogenic differentiation. (A) Representative fluorescence images of MSCs after 1, 2, 3, and 5 days of osteogenic induction. For the BNP group, MSCs were treated with 20 μg mL−1 BNPs and incubated overnight before induction. Green: Dll4 mRNA expression. Scale bar: 100 μm. Quantification and comparison of cytoplasmic (B) and nuclear (C) Dll4 mRNA expression in MSCs in control and BNP treated groups. (D) and (E) Cumulative probability distribution of cytoplasmic Dll4 expression of control and BNP-treated groups, respectively. Error bars, s.e.m. (n = 4), with 100–150 cells. p-Values were calculated using a two-sample t-test with respect to the control. ns, not significant, ***p < 0.001.

Similar articles

Cited by

References

    1. Fasciano S. Wheba A. Ddamulira C. Wang S. Biomater. Adv. 2024:213897. doi: 10.1016/j.bioadv.2024.213897. - DOI - PubMed
    1. Zhao Y. Richardson K. Yang R. Bousraou Z. Lee Y. K. Fasciano S. Wang S. Frontiers in Bioengineering and Biotechnology. 2022;10:1007430. doi: 10.3389/fbioe.2022.1007430. - DOI - PMC - PubMed
    1. Zhao Y., Yang R., Bousraou Z. and Wang S., 2021 IEEE 21st International Conference on Nanotechnology (NANO), Montreal, QC, Canada, 2021, pp. 273–276
    1. Zhao Y. Yang R. Bousraou Z. Richardson K. Wang S. Sci. Rep. 2022;12:10315. doi: 10.1038/s41598-022-14437-x. - DOI - PMC - PubMed
    1. Charbord P. Hum. Gene Ther. 2010;21:1045–1056. doi: 10.1089/hum.2010.115. - DOI - PMC - PubMed

LinkOut - more resources