. 2024 Sep 27;32(4):101347.
doi: 10.1016/j.omtm.2024.101347. eCollection 2024 Dec 12.

Design and validation of cell-based potency assays for frataxin supplementation treatments

Affiliations

Design and validation of cell-based potency assays for frataxin supplementation treatments

Shibani Mukherjee et al. Mol Ther Methods Clin Dev. .

Abstract

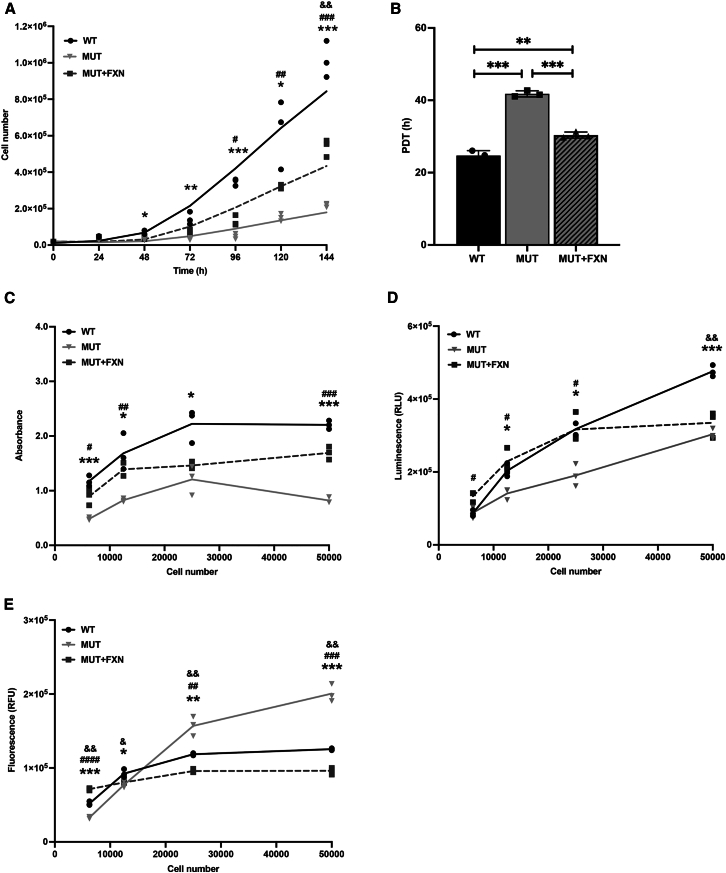
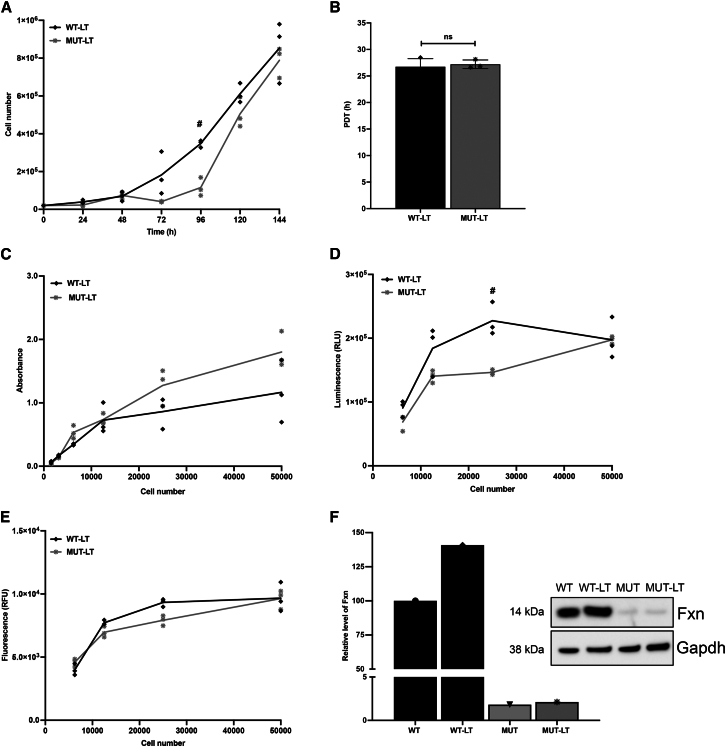
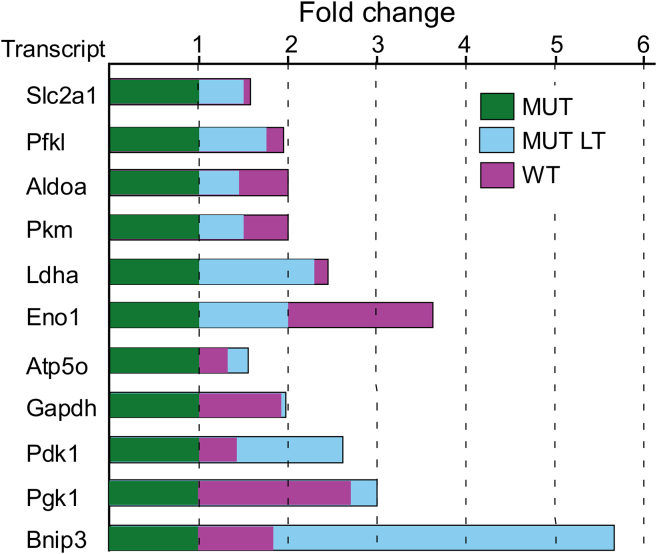
Friedreich's ataxia (FRDA) is a multisystem, autosomal recessive disorder caused by mutations in the frataxin (FXN) gene. As FRDA is considered an FXN deficiency disorder, numerous therapeutic approaches in development or clinical trials aim to supplement FXN or restore endogenous FXN expression. These include gene therapy, protein supplementation, genome editing or upregulation of FXN transcription. To evaluate efficacy of these therapies, potency assays capable of quantitative determination of FXN biological activity are needed. Herein, we evaluate the suitability of mouse embryonic fibroblasts derived from Fxn G127V knockin mice (MUT MEFs) as a candidate for cell-based potency assays. We demonstrate that these cells, when immortalized, continue to express minute amounts of Fxn and exhibit a broad range of phenotypes that result from severe Fxn deficiency. Exogenous FXN supplementation reverses these phenotypes. Thus, immortalized MUT MEFs are an excellent tool for developing potency assays to validate novel FRDA therapies. Care needs to be exercised while utilizing these cell lines, as extended passaging results in molecular changes that spontaneously reverse FRDA-like phenotypes without increasing Fxn expression. Based on transcriptome analyses, we identified the Warburg effect as the mechanism allowing cells expressing a minimal level of Fxn to thrive under standard cell culture conditions.

Keywords: Friedreich’s ataxia; aerobic glycolysis; frataxin; gene therapy; potency assay.


Conflict of interest statement

E.S. is an employee of Friedreich’s Ataxia Research Alliance, and M.N. and R.B.W. are members of the Friedreich’s Ataxia Research Alliance scientific advisory board.

Figures

None
Graphical abstract
Figure 1
Figure 1
Immortalization of MUT MEFs with SV40 T antigen does not affect Fxn expression (A) Expression of Fxn and SV40 Tag in immortalized WT and MUT MEFs (populations) as shown by western blot. Hprt and Ponceau S staining serve as loading controls. SV40 transformation was conducted on two independently derived WT MEF lines (B7, A12) and two independently derived MUT MEF lines (B1, A4). Non-transduced cell lines are shown for reference. (B) Expression of Fxn, SV40 Tag, and Hprt in the selected single-cell derived clones shown by western blot. (C) Quantitation of Fxn expression in selected clones (#3 WT and #4 MUT), which were used for further experiments. Gapdh was used as a loading control. A representative western blot is shown. Western blots were performed three independent times. Results are plotted as mean values with standard deviations; (∗∗∗∗p < 0.0001).
Figure 2
Figure 2
Immortalized WT and MUT MEFs cells are phenotypically different (A) Immortalized WT and MUT MEFs were seeded at the same density and counted every 24 h over a 6-day period. The experiment was conducted independently three times. (B) The PDTs of WT and MUT MEFs were calculated from the growth curves (A) as described in the materials and methods section. Results are plotted as mean values with standard deviations. (C) Cell proliferation assays were independently performed three times. (D) WT and MUT MEFs were plated at densities indicated by the x axis and analyzed for intracellular ATP content 48 h later by luminescence detection (y axis). Three independent experiments were performed. (E) Determination of mitochondrial DNA copy number by qPCR in WT and MUT MEFs. Experiments were done on six independently cultured samples. Results are plotted as mean values with standard deviations. (F) The level of ROS in immortalized WT and MUT MEFs plated at the indicated densities (x axis) was measured by staining the cells with the fluorescent ROS indicator CM-H2DCFDA. The experiments were independently performed three times. Symbols denote statistical significance as follows: ∗∗p < 0.001, ∗∗∗p < 0.0001.
Figure 3
Figure 3
Stable expression of exogenous human FXN in MUT MEFs (A) A schematic of the lentivirus vector pLenti hygro FXN encoding a human miniFXN gene. The miniFXN gene used in experiments contains fragments of the endogenous FXN 5′UTR, promoter and intron 1, and all five exons of the gene. (B) Representative western blot demonstrating expression of exogenous FXN. The miniFXN encodes a C-terminal HA tag that results in a slightly greater molecular weight, as detected by western blot. (C) Quantitation of endogenous Fxn (∗) and exogenous FXN by western blot. Gapdh was used as a normalization control. MUT+FXN designates cells expressing exogenous, human FXN. The experiment was performed three independent times. Results are plotted as mean values with standard deviations; (∗∗p < 0.001, ∗∗∗p < 0.0001).
Figure 4
Figure 4
Exogenous FXN expression ameliorated aberrant phenotypes of MUT MEFs (A) Immortalized WT, MUT, and MUT+FXN MEFs were seeded at the same density and counted every 24 h over a 6-day period. The experiment was conducted independently three times. (B) The PDTs of WT, MUT, and MUT+FXN were calculated from the growth curves (A). Results are plotted as mean values with standard deviations. (C) Proliferation of WT, MUT, and MUT+FXN MEFs was assessed using cell proliferation assays. Cells were plated at the indicated densities independently for three separate experiments. (D) WT, MUT, and MUT+FXN MEFs were plated at the densities indicated by the x axis and analyzed for intracellular ATP content 48 h later by luminescence detection (y axis). Three independent experiments were performed. (E) The level of ROS in WT, MUT, and MUT+FXN MEFs was determined using CM-H2DCFDA labeling. Symbols denote statistical significance as follows: , #, &p < 0.05, ∗∗, ##, &&p < 0.001, ∗∗∗, ###, &&&p < 0.0001. WT vs. MUT, #MUT vs. MUT+FXN, &WT vs. MUT+FXN.
Figure 5
Figure 5
Prolonged culturing partially alleviates MUT MEF phenotypes (A) Immortalized late-passage WT (WT-LT, p26) and MUT (MUT-LT, p26) MEFs were seeded at the same density and counted every 24 h over a 6-day period. The experiment was performed independently three times. (B) The PDTs of WT-LT and MUT-LT MEFs were calculated from the growth curves (A). Results are plotted as mean values with standard deviations. (C) Proliferation of immortalized WT-LT and MUT-LT was compared using cell proliferation assays. Cells were plated at the indicated densities (x axis) independently for three separate experiments. (D) WT-LT and MUT-LT MEFs were plated at the densities indicated by the x axis and analyzed for intracellular ATP content 48 h later by luminescence detection (y axis). The experiment was performed independently three times. (E) The level of ROS in WT-LT and MUT-LT MEFs was measured by fluorescent detection (y axis) after staining the cells with CM-H2DCFDA. Cells were plated at the indicated densities (x axis) independently for three separate experiments (∗∗p < 0.001, ∗∗∗p < 0.0001). (F) FXN protein levels were measured by western blot in WT, WT-LT, MUT, and MUT-LT MEFs. Gapdh was used as a loading control and normalizer.
Figure 6
Figure 6
Changes of transcriptome associated with prolonged culture of MUT MEFs (A) Heatmap illustrating expression of 2017 DE genes in WT, MUT-LT, and MUT early-passage MEFs. p indicates passage number. (B) Numbers of significantly DE genes separated by direction of change (all, upregulated, downregulated) and organized by group comparison (p < 0.05). Early indicates early-passage MUT cells (p6 and p9); Late indicates late-passage MUT cells (p19 and p26). (C) Principal-component analysis (PCA) of early-passage WT and early-passage MUT MEF samples and MUT-LT MEF samples.
Figure 7
Figure 7
Upregulated expression of aerobic glycolysis (Warburg effect) associated genes in MUT-LT cells Normalized RNA-seq counts were used to generate the plot. All values were normalized to the expression level detected in early-passage MUT cells (MUT, green bar; MUT-LT, blue bar; WT, purple bar).

Similar articles

References

    1. Campuzano V., Montermini L., Moltò M.D., Pianese L., Cossée M., Cavalcanti F., Monros E., Rodius F., Duclos F., Monticelli A., et al. Friedreich's ataxia: autosomal recessive disease caused by an intronic GAA triplet repeat expansion. Science. 1996;271:1423–1427. - PubMed
    1. Durr A., Cossee M., Agid Y., Campuzano V., Mignard C., Penet C., Mandel J.L., Brice A., Koenig M. Clinical and genetic abnormalities in patients with Friedreich's ataxia. N. Engl. J. Med. 1996;335:1169–1175. doi: 10.1056/NEJM199610173351601. - DOI - PubMed
    1. Filla A., De Michele G., Cavalcanti F., Pianese L., Monticelli A., Campanella G., Cocozza S. The relationship between trinucleotide (GAA) repeat length and clinical features in Friedreich ataxia. Am. J. Hum. Genet. 1996;59:554–560. - PMC - PubMed
    1. Cossee M., Durr A., Schmitt M., Dahl N., Trouillas P., Allinson P., Kostrzewa M., Nivelon-Chevallier A., Gustavson K.H., Kohlschutter A., et al. Friedreich's ataxia: point mutations and clinical presentation of compound heterozygotes. Ann. Neurol. 1999;45:200–206. - PubMed
    1. Galea C.A., Huq A., Lockhart P.J., Tai G., Corben L.A., Yiu E.M., Gurrin L.C., Lynch D.R., Gelbard S., Durr A., et al. Compound heterozygous FXN mutations and clinical outcome in friedreich ataxia. Ann. Neurol. 2016;79:485–495. doi: 10.1002/ana.24595. - DOI - PubMed