. 2024 Dec 16:27:100420.
doi: 10.1016/j.vas.2024.100420. eCollection 2025 Mar.

Identification of genes associated with longevity in dogs: 9 candidate genes described in Cavalier King Charles Spaniel

Affiliations

Identification of genes associated with longevity in dogs: 9 candidate genes described in Cavalier King Charles Spaniel

Evžen Korec et al. Vet Anim Sci. .

Abstract

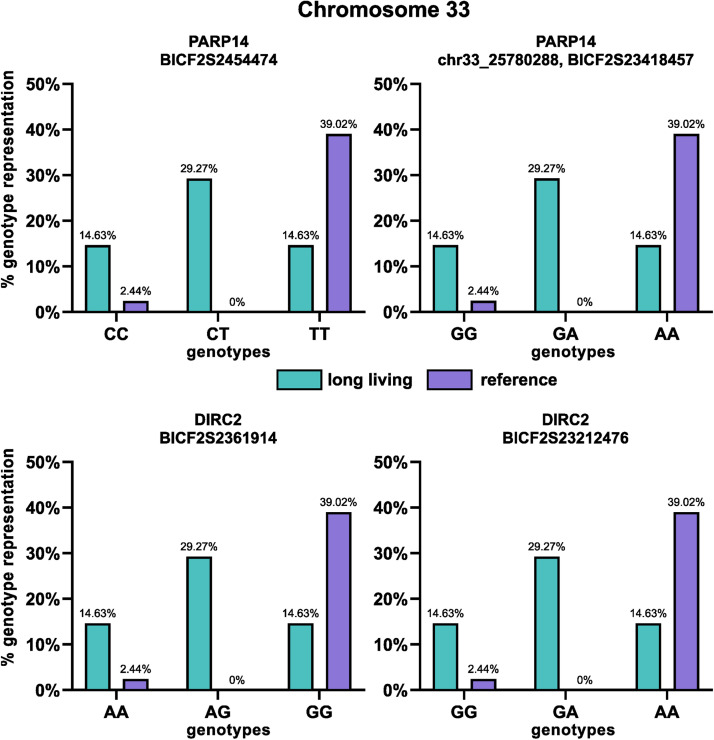
In the past years, dogs have served as a convenient natural model organism for longevity due to their similarity with humans concerning not only their environment but also the diseases and complications occurring in older age. Since many dog breeds have significantly shorter lifespan than their closely related breeds, identification of genes associated with longevity may help to elucidate its background and serve as a possible tool for selective breeding of long-living dogs. This genome-wide association study (GWAS) was undertaken to identify the candidate genes associated with longevity in Cavalier King Charles Spaniel individuals that have reached the age of more than 13 years. We described 15 SNPs localized in nine genes: B3GALNT1, NLRP1 like, PARP14, IQCJ-SCHIP1, COL9A1, COL19A1, SDHAF4, B3GAT2, and DIRC2 that are associated with longevity in purebred Cavalier King Charles Spaniels. These results are promising for future research and possible selective breeding of companion dogs with extended lifespan.

Keywords: Cavalier King Charles Spaniel dog; Extending lifespan; GWAS; Longevity testing; Longevity-associated genes.


Conflict of interest statement

The authors declare that they have no known competing financial interests or personal relationships that could have appeared to influence the work reported in this paper.

Figures

Fig 1
Fig. 1
Manhattan plot of the GWAS results. The blue line represents a significance threshold of 5.0e-05.
Fig 2
Fig. 2
Position of selected SNPs significantly associated with longevity in respective genes. The yellow line represents introns, purple line represents exons and the red line in the scheme represents UTRs. Each position of a particular SNP in the respective genes is visualised by the green line that is annotated at the top.
Fig 3
Fig. 3
Distribution of genotypes in the significant SNPs associated with longevity in the investigated genes. Turquoise colour represents the long-living group and purple colour represents the reference group. Each graph contains the P-value from Fisher's exact test.
Fig 3
Fig. 3
Distribution of genotypes in the significant SNPs associated with longevity in the investigated genes. Turquoise colour represents the long-living group and purple colour represents the reference group. Each graph contains the P-value from Fisher's exact test.
Fig 3
Fig. 3
Distribution of genotypes in the significant SNPs associated with longevity in the investigated genes. Turquoise colour represents the long-living group and purple colour represents the reference group. Each graph contains the P-value from Fisher's exact test.

Similar articles

Cited by

References

    1. AVMA . European Pet Food Industry Federation; 2022. Pet Ownership and Demographic Sourcebook.http://www.fediaf.org/
    1. Barry K., Murphy C., Mansell A. NLRP1- A CINDERELLA STORY: a perspective of recent advances in NLRP1 and the questions they raise. Communications biology. 2023;6(1):1274. doi: 10.1038/s42003-023-05684-3. - DOI - PMC - PubMed
    1. Bateman J.F. Genetic aspects of osteoarthritis. Seminars in Arthritis and Rheumatism. 2005;34(6 Suppl 2):15–18. doi: 10.1016/j.semarthrit.2004.03.006. - DOI - PubMed
    1. Bickel R.D., Kopp A., Nuzhdin S.V. Composite effects of polymorphisms near multiple regulatory elements create a major-effect QTL. PLoS Genetics. 2011;7(1) doi: 10.1371/journal.pgen.1001275. - DOI - PMC - PubMed
    1. Bodmer D., Eleveld M., Kater-Baats E., Janssen I., Janssen B., Weterman M., Schoenmakers E., Nickerson M., Linehan M., Zbar B., van Kessel A.G. Disruption of a novel MFS transporter gene, DIRC2, by a familial renal cell carcinoma-associated t(2;3)(q35;q21) Human Molecular Genetics. 2002;11(6):641–649. doi: 10.1093/hmg/11.6.641. - DOI - PubMed

LinkOut - more resources