. 2025 Jan 17;11(3):eadq8115.
doi: 10.1126/sciadv.adq8115. Epub 2025 Jan 17.

Viroporin activity is necessary for intercellular calcium signals that contribute to viral pathogenesis

Affiliations

Viroporin activity is necessary for intercellular calcium signals that contribute to viral pathogenesis

J Thomas Gebert et al. Sci Adv. .

Abstract

Viruses engage in a variety of processes to subvert host defenses and create an environment amenable to replication. Here, using rotavirus as a prototype, we show that calcium conductance out of the endoplasmic reticulum by the virus encoded ion channel, NSP4, induces intercellular calcium waves that extend beyond the infected cell and contribute to pathogenesis. Viruses that lack the ability to induce this signaling show diminished viral shedding and attenuated disease in a mouse model of rotavirus diarrhea. This implicates nonstructural protein 4 (NSP4) as a virulence factor and provides mechanistic insight into its mode of action. Critically, this signaling induces a transcriptional signature characteristic of interferon-independent innate immune activation, which is not observed in response to a mutant NSP4 that does not conduct calcium. This implicates calcium dysregulation as a means of pathogen recognition, a theme broadly applicable to calcium-altering pathogens beyond rotavirus.


Figures

Fig. 1.
Fig. 1.. Frequency of ICWs is associated with virulence.
(A) Maximum intensity projections of MA104-GCaMP6s monolayers imaged after infecting with mock inoculum, OSUv, or OSUa RV at an MOI of 0.01. ICWs are indicated by regions of high GCaMP6s intensity (green) surrounding RV-infected cells (magenta), seen predominantly in the OSUv-infected monolayer. Regions of each monolayer measuring 10 mm by 10 mm were imaged for 30 min beginning 18 hpi. (B) MA104-GCaMP6s monolayers were infected at an MOI of 0.005 and imaged from 8 to 24 hpi. ICWs were quantitated using an automated pipeline developed in FIJI. The relative quantity, normalized against the mean ICW count in mock-infected monolayers for a given replicate (left) and latency (right) of ICWs between mock, OSUv, and OSUa infection. Data are pooled from three biological replicates. (C) Representative intracellular Ca2+ traces from mock-, OSUv-, or OSUa-infected cells. (D) Representative HIO monolayers expressing GCaMP6s (green) and infected with mock inoculum, virulent human RV, or an attenuated RV strain. Monolayers were imaged from 8 to 24 hpi before fixing and staining for RV antigen (magenta). ICWs detected over the course of imaging were arbitrarily pseudocolored and projected into a single image for each multipoint. (E) The quantity of ICWs (a) and infected cells (b) and the percentage of monolayer area positive for RV antigen compared between mock, Ito, and RV1 infection (c). Data are combined from three biological replicates. Data in bar charts represent mean with error bars denoting SD. *P < 0.05, **P < 0.01, ***P < 0.001, and ****P < 0.0001. Outliers were removed using the ROUT method (Q = 1%) and normality determined by Shapiro-Wilk tests. (B) (left) and (E) (a) were analyzed using Kruskal-Wallis, followed by Dunn’s multiple comparison tests. (B) (right) and (E) (b and c) were analyzed using Mann-Whitney tests. FOV, field of view; ns, not significant.
Fig. 2.
Fig. 2.. The difference in ICW phenotypes is attributable to NSP4.
(A) Recombinant SA11 strains with NSP4 from OSUv or OSUa and map of NSP4 highlighting the main domains [luminal, transmembrane (TM), viroporin, enterotoxin, and DLP-B], their location in the ER lumen, membrane or cytoplasm, and the three amino acid differences between OSUv and OSUa NSP4s. (B) ICW quantification in MA104-GCaMP6s monolayers infected with mock inoculum, wild-type SA11, or SA11 encoding G10 (NSP4) from OSUv, OSUa, or the indicated single amino acid revertants from OSUa to OSUv. Monolayers were imaged from 8 to 24 hpi and ICWs quantitated across three biological replicates. ICW counts were compared by Kruskal-Wallis test, followed by Dunn’s multiple comparison. (C) Growth curves of virus replication kinetics. Asterisks indicate Mann-Whitney U tests comparing SA11-G10-OSUv and SA11-G10-OSUa at the indicated time points. (D) Normalized NSP4:glyceraldehyde-3-phosphate dehydrogenase (GAPDH) ratio at 9 hpi in MA104 monolayer lysate following infection at an MOI of 5 with the indicated virus. Relative quantities compared by one-way analysis of variance (ANOVA), followed by Holm-Šídák tests. (E) Representative images of SA11-G10-OSUv and SA11-G10-OSUa infected monolayers expressing ER-localized GFP (green) with NSP4 (magenta) and NSP2 (orange) detected by immunofluorescence at 12 hpi. Scale bars, 10 μm. (F) Mander’s coefficient to estimate NSP4 colocalization with Sec61β as a surrogate for ER localization. Data are combined from 15 cells across three biological replicates. Groups compared by Kruskal-Wallis test (P > 0.05). (G) Representative intracellular Ca2+ traces from cells infected with the indicated strain of recombinant SA11. (H) Intracellular Ca2+ spike counts from MA104-GCaMP6s (left) or LLC-MK2-GCaMP6s (right) cells (ICW-deficient) infected with the indicated strain of recombinant SA11. Data are combined from three biological replicates. ICWs were compared by Kruskal-Wallis test, followed by Dunn’s multiple comparison tests. (I) Linear regression estimating the association between intracellular Ca2+ spike counts in LLC-MK2–GCaMP6s cells and ICW counts in MA104-GCaMP6s cells. *P < 0.05, **P < 0.01, ***P < 0.001, and ****P < 0.0001.
Fig. 3.
Fig. 3.. NSP4 is sufficient for ICWs.
(A) Schematic representation of AAV vectors used to recombinantly express mScarlet (mScar) as a reporter alone or with SA11 NSP4-WT, the SA11 NSP4-ASDASA viroporin mutant, or NSP4 from strains OSUv, OSUa, or a group A human RV (HuRVA). ITR, inverted terminal repeat; IRES, internal ribosomal entry site. (B) mScarlet signal (magenta) overlaid on maximum intensity projections of GCaMP6s signal (green) during 30 min of imaging beginning 60 hours after transduction (top row). Segmented ICWs were arbitrarily pseudocolored to visualize and distinguish individual signaling events (bottom row). (C) Comparison of the number of ICWs detected during 18 hours of imaging following transduction with the indicated AAV constructs. Monolayers were imaged every 1 min for 30 min, beginning 52 hours after transduction. Data were pooled from three biological replicates. ICW counts for technical replicates were normalized to the average number of ICWs detected across all conditions within a given biological replicate. Normalized ICW counts were compared by Kruskal-Wallis, followed by Dunn’s multiple comparison tests. (D) Representative intracellular Ca2+ traces from cells mock treated or transduced with the indicated AAV construct for mScarlet or NSP4s. (E) NSP4 detected by Western blot in MA104 cells transduced with the indicated AAVs. NSP4:GAPDH ratios were compared by one-way ANOVA (P < 0.001), followed by Student’s t test with Šidák correction. ***P < 0.001 and ****P < 0.0001.
Fig. 4.
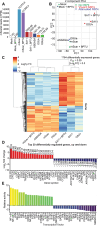
Fig. 4.. NSP4 viroporin activity drives transcriptional changes consistent with innate immune activation.
MA104 cells were transduced with 50,000 genome copies of AAV encoding the indicated NSP4 and the fluorescent protein mScarlet. RNA was extracted at 36 hours after transduction. (A) Normalized transcripts per million (nTPM) read counts of mScarlet, as a surrogate of AAV transgene expression. (B) Two-component principal components analysis plot. (C) Heatmap of differentially regulated genes between ICW-inducing and non–ICW-inducing AAV-NSP4 variants and controls. (D) Top 20 differentially regulated genes. (E) Top 20 differentially active transcription factors in monolayers transduced with ICW-inducing AAV-NSP4 variants versus those transduced with non-ICW inducing variants and vehicle controls.
Fig. 5.
Fig. 5.. HIOs infected with SA11-G10-OSUv and SA11-G10-OSUa support replication and show distinct pathogenic markers.
(A) Representative immunofluorescence images of three-dimensional HIOs infected with SA11-G10-OSUv and SA11-G10-OSUa at 18 hpi. Scale bars, 20 μm. (B) Results from yield assay showing comparable yield of SA11-G10-OSUv and SA11-G10-OSUa in three-dimensional HIOs. Represented as fold change in plaque-forming units per milliliter between 2 and 24 hpi. (C) ICWs detected in HIO-GCaMP6s monolayers infected with the indicated viruses. Monolayers were imaged every 1 min from 8 to 24 hpi. Data were pooled from three biological replicates. (D) Percent increase between initial and maximum cross-sectional area in three-dimensional HIOs during infection with mock inoculum, SA11-G10-OSUv, or SA11-G10-OSUa. Data were combined from three biological replicates. For (C) and (D), groups were compared using Kruskal-Wallis, followed by Dunn’s multiple comparison tests. **P < 0.01 and ****P < 0.0001.
Fig. 6.
Fig. 6.. NSP4 is associated with ICWs, organoid swelling, disease, and shedding in a murine-like RV background.
(A) Representative images of plaque assays showing plaque clearance at 3 days postinfection in MA104 monolayers infected with D6/2-G10-OSUv, but nonlytic plaques in monolayers infected with D6/2-G10-OSUa. (B) Representative bright-field (BF) and immunofluorescence image of monolayer infected with D6/2-G10-OSUa (red) showing the presence of infected foci despite the lack of plaque clearance. (C) Quantitation of ICWs in MA104-GCaMP6s monolayers imaged every 1 min from 8 to 24 hpi. Data were combined from three biological replicates. (D) Maximum percent swell in three-dimensional mouse intestinal organoids (Balb/c jejunum) infected with the indicated RV strains. For (C) and (D), groups were compared using Kruskal-Wallis, followed by Dunn’s multiple comparison tests. (E) Detection of RV antigen (green) and filamentous actin (red) in three-dimensional mouse intestinal organoids. (F) Litters of CD-1 mice were infected with the indicated dose of D6/2-G10-OSUv (n = 40 pups across four litters) or D6/2-G10-OSUa (n = 63 pups across four litters) and followed for 5 days postinfection. The percentage of pups to develop diarrhea during the 5-day period was used to plot the cumulative incidence curves and estimate the dose required to produce disease in 50% of animals [diarrhea dose 50 (DD50)] for each virus. (G) Infectious particles detected in stool from animals infected with 104 FFU at 3 days postinfection by fluorescent-focus assay. n = 9 pups per condition. Mean titers compared by Mann-Whitney test. (H) Representative immunofluorescence images of RV (magenta), 4′,6-diamidino-2-phenylindole (DAPI) (yellow), villin (cyan), and E-cadherin (green) detected in intestinal epithelium from infected pups at 2 days postinfection. Scale bars, 100 μm. *P < 0.05, **P < 0.01, ***P < 0.001, and ****P < 0.0001.

References

    1. GBD Diarrhoeal Diseases Collaborators , Estimates of global, regional, and national morbidity, mortality, and aetiologies of diarrhoeal diseases: A systematic analysis for the global burden of disease study 2015. Lancet Infect. Dis. 17, 909–948 (2017). - PMC - PubMed
    1. GBD 2016 Diarrhoeal Disease Collaborators , Estimates of the global, regional, and national morbidity, mortality, and aetiologies of diarrhoea in 195 countries: A systematic analysis for the global burden of disease study 2016. Lancet Infect. Dis. 18, 1211–1228 (2018). - PMC - PubMed
    1. Cohen A. L., Platts-Mills J. A., Nakamura T., Operario D. J., Antoni S., Mwenda J. M., Weldegebriel G., Rey-Benito G., De Oliveira L. H., Ortiz C., Daniels D. S., Videbaek D., Singh S., Njambe E., Sharifuzzaman M., Grabovac V., Nyambat B., Logronio J., Armah G., Dennis F. E., Seheri M. L., Magagula N., Mphahlele J., Fumian T. M., Maciel I. T. A., Gagliardi Leite J. P., Esona M. D., Bowen M. D., Samoilovich E., Semeiko G., Abraham D., Giri S., Praharaj I., Kang G., Thomas S., Bines J., Liu N., Kyu H. H., Doxey M., Rogawski Mcquade E. T., Mcmurry T. L., Liu J., Houpt E. R., Tate J. E., Parashar U. D., Serhan F., Aetiology and incidence of diarrhoea requiring hospitalisation in children under 5 years of age in 28 low-income and middle-income countries: Findings from the Global Pediatric Diarrhea Surveillance network. BMJ Glob. Health 7, 9548 (2022). - PMC - PubMed
    1. Crawford S. E., Ramani S., Tate J. E., Parashar U. D., Svensson L., Hagbom M., Franco M. A., Greenberg H. B., O’Ryan M., Kang G., Desselberger U., Estes M. K., Rotavirus infection. Nat. Rev. Dis. Primers. 3, 17083 (2017). - PMC - PubMed
    1. King C. K., Glass R., Bresee J. S., Duggan C., Centers for Disease Control and Prevention , Managing acute gastroenteritis among children: Oral rehydration, maintenance, and nutritional therapy. MMWR Recomm. Rep. 52, 1–16 (2003). - PubMed

MeSH terms

LinkOut - more resources