. 2025 Jan 17;11(3):eadr2450.
doi: 10.1126/sciadv.adr2450. Epub 2025 Jan 17.

Pellino 3 E3 ligase promotes starvation-induced autophagy to prevent hepatic steatosis

Affiliations

Pellino 3 E3 ligase promotes starvation-induced autophagy to prevent hepatic steatosis

Srinivasa P Kolapalli et al. Sci Adv. .

Abstract

Nutrient deprivation is a major trigger of autophagy, a conserved quality control and recycling process essential for cellular and tissue homeostasis. In a high-content image-based screen of the human ubiquitome, we here identify the E3 ligase Pellino 3 (PELI3) as a crucial regulator of starvation-induced autophagy. Mechanistically, PELI3 localizes to autophagic membranes, where it interacts with the ATG8 proteins through an LC3-interacting region (LIR). This facilitates PELI3-mediated ubiquitination of ULK1, driving ULK1's subsequent proteasomal degradation. PELI3 depletion leads to an aberrant accumulation and mislocalization of ULK1 and disrupts the early steps of autophagosome formation. Genetic deletion of Peli3 in mice impairs fasting-induced autophagy in the liver and enhances starvation-induced hepatic steatosis by reducing autophagy-mediated clearance of lipid droplets. Notably, PELI3 expression is decreased in the livers of patients with metabolic dysfunction-associated steatotic liver disease (MASLD), suggesting its role in hepatic steatosis development in humans. The findings suggest that PELI3-mediated control of autophagy plays a protective role in liver health.


Figures
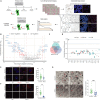
Fig. 1.
Fig. 1.. High-content screen identifies PELI3 as a regulator of starvation-induced autophagy.
(A) Schematic of primary and validation screens. Readout is based on quantification of red mKeima puncta per cell. Representative images of siControl and siULK1 demonstrate image segmentation and feature collection of perinuclear mKeima puncta from acid pH (excitation ~586 nm). (B) Screening results plotted as log2 of the mean FC of the three siRNAs for each gene relative to the negative control against the −log10 of the combined P value. Selected candidates (RSA analysis) are annotated in red. (C) Venn diagram depicts overlap of significant hits from both cell lines of the validation screen with the FC criteria <0.5. (D) Lysosomal mKeima puncta for 19 candidates fulfilling the selection criteria from (C). Data are depicted as the mean of two siRNAs from two independent repetitions. Data normalized to positive (ULK1) and negative (Control) control siRNAs. (E and F) Representative images (60×) of Tig3 cells (72-hour transfection) in full medium (FM) or starved in HBSS for 2 hours, immunostained for LC3B (E) or ATG16L1 (F). Nuclear stain with Hoechst 33342. Magnified inserts of highlighted areas on the right. Scale bar, 5 μm. The number of puncta was quantified from ≥100 cells, and the data represent mean ± SD number of puncta per cell. ATG16L1 (n = 2) and LC3B (n = 3). ****P < 0.0001. (G) TEM analysis of Tig3 cells (72-hour transfection) starved for 2 hours (HBSS) in the presence of 200 nM BafA1 before fixation. Representative images are shown. Scale bar, 1 μm. Images displayed on the right are cropped and magnified from the highlighted area. Red arrows denote autophagic vesicles. Quantification of mean number of autophagic vesicles ± SD per cross section (n ≥ 25 cross sections). Statistical analysis [(E) to (G)] was performed by unpaired Student’s t test. **P < 0.01, ****P < 0.0001.
Fig. 2.
Fig. 2.. Starvation-induced autophagy is abrogated in the livers of Peli3-deficient mice.
(A) Overview of mouse starvation experiments. (B) Western blot of liver protein extracts from starved WT and KO mice (n = 3). Ubiquitin was run on a separate gel with its corresponding loading control. (C) Densiometric quantification relating to (B). Bar graphs depict relative expression of p62, LC3B-II, or ubiquitin normalized to loading. The data represent the mean ± SEM (n > 5 mice). Statistical analysis was performed by unpaired Student’s t test. *P < 0.05 and **P < 0.01. (D) Immunohistochemistry of starved mouse livers stained with H&E, p62, and ubiquitin. Representative images are shown (n = 3). Scale bars, 200 μm for widest histological view of H&E stain, 20 μm for magnified H&E inserts and ubiquitin, and 10 μm for p62. (E) Representative Western blot of primary hepatocytes from Peli3 WT or KO mice. Starvation and bafilomycin A1 (BafA1) treatments were 4 hours (n = 4). (F) Densiometric quantification relating to (E). Bar graphs depict mean ± SD of relative expression of LC3B-II and p62 normalized to loading (n = 3). Statistical analyses by two-way ANOVA. *P < 0.05 and **P < 0. 01. ns, nonsignificant. (G and H) Representative Western blot analysis of insoluble fractions from primary hepatocytes treated as in (E) (n = 3). [(B), (E), (G), and (H)] Gel stain is used as a loading control. (I) Primary hepatocytes derived from WT or KO mice cultured in full medium (FM) or starved (HBSS) for 4 hours and immunostained for p62. Representative images (60×) with magnified inserts on the right. Scale bar, 5 μm. [(D) and (I)] Nuclear stain with Hoechst 33342. (J) Quantifications relating to (I). Number of p62 puncta/cell quantified from ≥150 cells for each experiment. The data represent mean ± SD (n = 2). Statistical analysis was performed by one-way ANOVA. **P < 0.01 and ***P < 0.001.
Fig. 3.
Fig. 3.. PELI3 localizes to autophagic membranes and binds to LC3/GABARAP proteins via a LIR domain.
(A) Schematic of density gradient fractionation and membrane floatation assay by OptiPrep gradient. P, pellet; S, supernatant. (B) Tig3 cells expressing GFP-PELI3 (starvation and BafA1, 2 hours) analyzed by membrane floatation assay (A). Protein lysates from indicated fractions were subjected to Western blotting. A representative experiment is shown (n = 2). (C and D) Confocal microscopy analysis of GFP-LC3B and MYC-PELI3 (C) or endogenous WIPI2B and GFP-PELI3 (D) in HeLa cells treated as in (B). Scale bars, 5 μm. Line scans indicate the degree of colocalization between proteins of interest (magnified inserts, top right). Intensity profiles (right) are presented as arbitrary units (a.u.). (E) HEK293T cells expressing MYC-EV or MYC-PELI3 were treated with dimethyl sulfoxide (DMSO) or BafA1 for 2 hours. A protease protection assay was performed (see Materials and Methods), and lysates were subjected to Western blotting. A representative experiment is shown (n = 3). (F and G) Co-IP from Tig3 cells expressing GFP or GFP-PELI3 in full medium or starved (HBSS, 2 hours) (F) or from HEK293T cells expressing indicated GFP-tagged ATG8s and MYC-PELI3 (G). Western blot analysis of inputs and IP fractions from a representative experiment (n = 3). (H) GST pulldowns of radiolabeled (35S) MYC-PELI3 with indicated GST-ATG8s. GABLDS (LIR docking site mutant). A representative experiment is shown (n = 2). (I) Top: Features of four potential LIR motifs in PELI3 predicted by iLIR. Bottom: Schematic representation of PELI3 domain composition and experimentally identified LIR motif. Highlighted in red is the LIR motif and the mutational strategy for generating the mutant PELI3LIR. (J) Co-IP from HEK293T cells expressing GFP-LC3B with MYC-PELI3 WT, MYC-PELI3LIR (LIR mutant), or MYC-EV (empty vector). Western blot of input and IP are shown from a representative experiment (n = 3). [(F), (G), and (J)] Gel stain is used as a loading control.
Fig. 4.
Fig. 4.. Depletion of PELI3 leads to the aberrant accumulation of ULK1.
(A and C) Tig3 cells (72-hour transfection) were starved for indicated intervals in HBSS (A) or starved for 16 hours before treatment with cycloheximide (CHX) (100 ng/ml) for indicated intervals (C). A representative Western blot is shown (n = 3). (B and D) Densiometric quantifications relating to (A) and (C). Data represent relative ULK1 expression normalized to time point zero and total loading and are depicted as the mean ± SEM from three independent experiments. Statistical analysis was performed by two-way ANOVA. *P < 0.05 (B) and P = 0.0685 (D). (E) Western blot of liver tissue lysates from starved WT and KO mice. A representative blot from three mice of each genotype is shown. [(A), (C), and (E)] Gel stain is used as a loading control. (F) Densiometric quantification relating to (E). The graph depicts relative expression of ULK1 normalized to total loading. The data represent mean ± SD (n = 6). Statistical analysis was performed by unpaired Student’s t test. **P < 0.01. (G) Representative images from immunohistochemistry of starved mouse livers stained for ULK1. Scale bar 100 μm. (H) Representative images (60×) of WT and Peli3 KO cells starved for 2 hours in HBSS and immunostained for ULK1. Nuclear stain with Hoechst 33342. Magnified inserts shown on the right. Scale bar, 5 μm. (I) Quantifications relating to (H). ULK1 puncta quantified from ≥120 cells. Data represent the mean ± SD from three independent experiments. Statistical analysis was performed by unpaired Student’s t test. ****P < 0.0001. (J) Representative Western blot of primary hepatocytes from Peli3 WT and KO mice. Starvation and BafA1 treatments were for 4 hours (n = 3). (K) Densiometric quantification of phospho-ATG14 (P-ATG14) (Ser29) and total ATG14 (T-ATG14) relating to (J). Data depict the mean ± SD from four independent experiments. Statistical analyses by one-way ANOVA. *P < 0.05.
Fig. 5.
Fig. 5.. PELI3 binds to and ubiquitinates ULK1, leading to its proteasomal degradation.
(A) Co-IP from Tig3 cells expressing GFP or GFP-PELI3 in full medium or starved (HBSS, 2 hours). Western blot of inputs and IP fractions are shown from a representative experiment (n = 3). (B and C) Top: Schematic of ULK1 (B) or PELI3 (C) domain organization and relevant deletion constructs. Bottom: Co-IP from HEK293T cells expressing indicated constructs. Western blot analysis of inputs and IP fractions are shown from a representative experiment (n = 3). (D) Co-IP from HEK293T cells expressing indicated constructs. Western blot analysis of inputs and IP fractions are shown from a representative experiment (n = 3). L.E, low exposure; H.E, high exposure. (E) Left: Co-IP from HEK293T cells expressing indicated constructs. Western blot analysis of inputs and IP fractions are shown from a representative experiment (n = 3). Right: Corresponding densiometric quantification of ubiquitin levels normalized to bait. The data represent mean ± SD (n = 3). Statistical analysis performed by unpaired Student’s t test. **P < 0.01. (F) Co-IP from HEK293T cells expressing indicated constructs and treated with BafA1 or MG132 as indicated (2 hours). Western blot analysis of inputs and IP fractions are shown from a representative experiment (n = 3). (G) Co-IP of endogenous ULK1 from starved WT and Peli3 KO mouse liver tissue. Western blot analysis of inputs and IP fractions are shown from a representative experiment (n = 3). (H) Left: Co-IP of endogenous ULK1 from WT and Peli3 KO mouse-derived primary hepatocytes in full medium or starved. Western blot analysis of inputs and IP fractions are shown from a representative experiment (n = 3). Right: Corresponding densiometric quantification of ubiquitin levels normalized to bait from starved samples. The data represent mean ± SD (n = 3). Statistical analysis performed by unpaired Student’s t test. *P < 0.05.
Fig. 6.
Fig. 6.. Peli3 deletion enhances starvation-induced hepatic steatosis by disrupting autophagic turnover of lipid droplets.
(A to C) Representative images from starved mouse liver sections stained with H&E (A) and BODIPY (B) or fixed and processed for TEM (C). Scale bars, 20 μm (n = 10) (A), 20 μm (n = 3) (B), and 5 μm (n = 2) (C). LD, lipid droplet. (D) Triacylglycerol (TAG) and cholesteryl ester (CE) levels in starved mouse liver homogenates normalized to total level of GPLs determined by shotgun lipidomics. Data represent mean ± SD (n = 3), unpaired Student’s t test. P < 0.05 and ∗∗P < 0.01. (E and G) Representative (60×) images of primary hepatocytes in full medium (FM) or starved (16 hours) (E) or starved (16 hours) + BafA1 for the last 4 hours (G). Cells stained as indicated with BODIPY (green), LAMP2 antibody (red), and Hoechst 33342. Scale bars, 5 μm (magnified inserts on the right). (F) Quantification related to (E). The mean ± SD for number and size of BODIPY puncta/cell from ≥140 starved cells from each experiment (n = 2). (H) Quantification related to (G). Nearest-neighbor analysis counts the number of LAMP2 objects adjacent (<5-pixel proximity) to each BODIPY object. Quantifications from ≥140 cells; mean proximity ± SD is shown (n = 2). [(F) and (H)] Unpaired Student’s t test. *P < 0.1 and ****P < 0.0001. (I) Representative TEM images (mouse liver, 16-hour starvation). Magnified inserts (bottom). Red arrows depict autophagic/lysosomal vesicles in contact with/containing LDs. Scale bars, 1 or 2 μm. (J) Quantification relating to (I). Mean number of autophagic/lysosomal vesicles in contact with/containing LDs ± SD per 1-μm area (n = 2). Unpaired Student’s t test. **P < 0.01. (K) Peli3 mRNA expression in 23 livers from healthy individuals and 44 livers from MASLD patients. Dunn’s multiple comparisons test ***P < 0.001. TPM, transcripts per million.
Fig. 7.
Fig. 7.. PELI3 regulates autophagy and lipid homeostasis.
In response to nutrient deprivation, PELI3 safeguards ULK1 homeostasis through ubiquitination of ULK1. This is facilitated by PELI3’s interaction with ATG8 proteins. In the absence of PELI3, ULK1 accumulates, leading to a disruption of autophagy and a decreased degradation of LDs in the liver, causing enhanced hepatic steatosis. Created with BioRender (Frankel, 2023; https://BioRender.com/a71f180).

References

    1. Efeyan A., Comb W. C., Sabatini D. M., Nutrient-sensing mechanisms and pathways. Nature 517, 302–310 (2015). - PMC - PubMed
    1. Sung Y., Yu Y. C., Han J. M., Nutrient sensors and their crosstalk. Exp. Mol. Med. 55, 1076–1089 (2023). - PMC - PubMed
    1. Kuma A., Hatano M., Matsui M., Yamamoto A., Nakaya H., Yoshimori T., Ohsumi Y., Tokuhisa T., Mizushima N., The role of autophagy during the early neonatal starvation period. Nature 432, 1032–1036 (2004). - PubMed
    1. Ylä-Anttila P., Vihinen H., Jokitalo E., Eskelinen E.-L., Monitoring autophagy by electron microscopy in mammalian cells. Methods Enzymol. 452, 143–164 (2009). - PubMed
    1. Yu L., Chen Y., Tooze S. A., Autophagy pathway: Cellular and molecular mechanisms. Autophagy 14, 207–215 (2018). - PMC - PubMed

MeSH terms

Substances

LinkOut - more resources