. 2025 Mar;12(10):e2411972.
doi: 10.1002/advs.202411972. Epub 2025 Jan 17.

GABAergic Progenitor Cell Graft Rescues Cognitive Deficits in Fragile X Syndrome Mice

Affiliations

GABAergic Progenitor Cell Graft Rescues Cognitive Deficits in Fragile X Syndrome Mice

Chen Wang et al. Adv Sci (Weinh). 2025 Mar.

Abstract

Fragile X syndrome (FXS) is an inherited neurodevelopmental disorder characterized by a range of clinical manifestations with no effective treatment strategy to date. Here, transplantation of GABAergic precursor cells from the medial ganglionic eminence (MGE) is demonstrated to significantly improve cognitive performance in Fmr1 knockout (KO) mice. Within the hippocampus of Fmr1-KO mice, MGE-derived cells from wild-type donor mice survive, migrate, differentiate into functionally mature interneurons, and form inhibitory synaptic connections with host pyramidal neurons. MGE cell transplantation restores Ras-PKB signaling in pyramidal neurons, enhances AMPA receptor trafficking, rescues synaptic plasticity, and corrects abnormal hippocampal neural oscillations. These findings highlight the potential of GABAergic precursor cell transplantation as a promising therapeutic strategy for FXS.

Keywords: brain oscillation; cell therapy; hippocampus; long‐term potentiation; medial ganglionic eminence.


Conflict of interest statement

The authors declare no conflict of interest.

Figures

Figure 1
Figure 1
Transplanted MGE cells migrate to CA1 and express inhibitory neuronal markers in Fmr1‐KO mice. A) Schematic illustration depicting the extraction of MGE cells from embryonic GFP+ mice and their subsequent transplantation into Fmr1‐KO mice (P25‐30). B) An image presenting the dissection of MGE. C) Example images showing GFP+ MGE cells at 7 DAT (white arrowheads). Example MGE cells are shown in the insets. Yellow asterisk: injection site. Yellow dashed lines demarcate the CA3‐CA1 area. Scale bars, 500 µm. D) Left: example images showing GFP+ cells at 7 DAT and 60 DAT. Scale bars, 500 µm. The insets show example MGE cells. Right: the bar graphs present the quantification of GFP+ cells at different DATs. E) Distribution of transplanted MGE cells at 60 DAT. F) Example images showing labeling of NeuN and transplanted MGE cells at 60 DAT. Transplanted neurons dispersed upon grafting into recipient mice. The magnification shows example NeuN+GFP+ differentiated cells. Scale bar, 500 µm. G) Example images showing GFP+ cells (60 DAT) co‐expressing PV, SST, or nNOS. Arrowheads annotate co‐labeled cells. The magnifications show examples of PV+GFP+ (upper), SST+GFP+ (middle), and nNOS+GFP+ (lower) differentiated cells. Scale bars, 50 µm. Bar graphs indicate the proportions of PV+ (41.3% ± 2.8%), SST+ (21.6% ± 1.2%), and nNOS+ (7.7% ± 0.8%) cells among GFP+ MGE cells. n  = 4 per group. See Table S1 (Supporting Information) for all statistics, including n values, p values, and statistical tests.
Figure 2
Figure 2
MGE cells differentiate into functional INs. A) Schematic showing scRT‐PCR in grafted MGE cells. B‐D) Example electrophysiological responses and RNA expressions of 3 MGE cells to injected currents (black: near‐maximal firing; red: hyperpolarization) from a holding potential near −70 mV. Recordings were performed from slices at 31–35 DAT. Scale bars: 20 mV/200 ms. RNA profiles were obtained from each recorded cell using scRT‐PCR. MW, molecular weight. E) Summary plot for the occurrence of each marker in recorded MGE GFP+ cells. Fast spiking (PV): n = 12. Burst spiking (SST): n = 6. Regular spiking (nNOS): n = 14. F) Occurrence of each IN subtype recorded based on firing properties (n = 39 cells). GFP: n = 39 (100%). PV: n = 15 (38.5%). SST: n = 7 (17.95%). nNOS: n = 17 (43.59%). Lhx6: n = 39 (100%).
Figure 3
Figure 3
MGE cells form synaptic connections with host PNs. Note that the ages were P60 for Fmr1‐KO mice and 30 DAT for Fmr1‐KO+MGE mice. A) Schematic and image depicting dual patch‐clamp recordings from neighboring PN and IN in CA1. B) Simultaneous recording from a presynaptic IN and a postsynaptic PN. IN and PN were held in current‐ and voltage‐clamp configurations, respectively. Top: an AP in presynaptic IN. Bottom: average eEPSC from 10 individual recordings. C) Kinetics of eEPSCs of host IN‐PN (black) and MGE IN‐PN (green) synapses. D) Schematic showing mIPSC recordings from PNs. E) Example mIPSCs recorded from Fmr1‐KO and Fmr1‐KO+MGE mice. F) Cumulative plots of mIPSC amplitude and interval. G) Schematic showing mEPSC recordings from PNs. H) Example mEPSCs recorded from Fmr1‐KO and Fmr1‐KO+MGE mice. I) Cumulative plots of mEPSC amplitude and interval. J) Schematic showing eEPSC and eIPSC recorded from one PN. Note that eIPSC was increased in the Fmr1‐KO+MGE group. K) Ratios of eEPSC and eIPSC. Fmr1‐KO: 0.70 ± 0.01. Fmr1‐KO+MGE: 0.60 ± 0.02. n = 7 cells per group. p = 0.00012. L) Sample spikes from Fmr1‐KO and Fmr1‐KO+MGE neurons in response to a 300‐ms current injection (200 pA). M) Firing frequency: Fmr1‐KO, 28.5 ± 3.0 Hz; Fmr1‐KO+MGE, 21.0 ± 2.5 Hz. n = 6 cells per group. p = 0.041. N) A cartoon showing that, besides host INs (purple), INs (green) derived from MGE transplantation increased inhibitory connections to PN and reduced its excitability. See Table S2 (Supporting Information) for statistics, including n values, p values, and statistical tests. *p < 0.05. **p < 0.01. ***p < 0.001.
Figure 4
Figure 4
MGE transplantation rescues learning and memory in Fmr1‐KO+MGE mice. Note that the ages were P60 for WT and Fmr1‐KO mice, but 30 DAT for Fmr1‐KO+MGE and Fmr1‐KO+dMGE mice. A) In the MWM test, all mice showed a decrease in latency to escape to the visible platform. B) Fmr1‐KO+MGE mice (30 DAT) showed a marked improvement in latency to escape MWM during third and fourth days in 2 probe tests of the hidden platform. C) During the 2 probe tests, Fmr1‐KO+MGE mice made more target platform crossings. D) Example locomotion tracking plots showing total path length on day 4 of the hidden platform task. E) Fmr1‐KO+MGE mice (30 DAT) showed a preference for the target quadrant compared to Fmr1‐KO (P60) or Fmr1‐KO+dMGE (30 DAT) mice. F) Left: schematic showing object cognition test. Middle: bar graphs show percentages of time spent with FPO and NPO. Right: preferential indexes to NPO. G) Left: schematic showing location cognition test. Middle: bar graphs show percentages of time spent with FOA and NOA. Right: preferential indexes to NOA. H) Freezing time of 4 groups of mice during baseline training (left panel) and after CFC (middle panel) and TFC (right panel) tests. See Table S3 (Supporting Information) for statistics, including n values, p values, and statistical tests. *p < 0.05. **p < 0.01. ***p < 0.001.
Figure 5
Figure 5
MGE transplantation restored LTP expression in Fmr1‐KO mice. Note that the ages were P60 for WT and Fmr1‐KO mice, but 30 DAT for Fmr1‐KO+MGE mice. A) Schematic diagram illustrating the stimulation of the SC using a concentric bipolar electrode and the recording of fEPSP in the CA1. B) Fiber volley (FV) induced by different stimulation intensities in 3 groups of mice. C) Time course of LTP before and after TBS stimulation in 3 groups of mice. D) Representative fEPSC traces from 3 groups of animals, with sampling time points 1 and 2 as indicated in C. E) Mean values of LTP amplitude in WT, Fmr1‐KO, and Fmr1‐KO+MGE groups. See Table S6 (Supporting Information) for statistics, including n values, p values, and statistical tests. **< 0.01. ***< 0.001.
Figure 6
Figure 6
MGE cells stimulate synaptic GluA1 trafficking in Fmr1‐KO mice. Note that the ages were P55 for WT and Fmr1‐KO mice, but 30 DAT for Fmr1‐KO+MGE and Fmr1‐KO+dMGE mice. A) Schematic showing a possible role of MGE cells on LTP. B) Schematic drawing outlines in vivo experimental design using GluA1ct. C) MGE‐derived GABAergic progenitor cells were transplanted into WT or Fmr1‐KO hippocampus and differentiated to INs (green fluorescence). GluA1 or GluAct was then expressed specifically to PNs using CaMKIIα promoter‐based AAV‐mCherry virus (red fluorescence). Whole‐cell recordings were made in neighboring infected and non‐infected PNs. D) Evoked AMPA responses recorded from mCherry‐ (ctrl) or GluA1‐mCherry‐expressing WT PNs. Bar graphs show IAMPA amplitudes and rectification of IAMPA normalized to the control. IAMPA: 31.9 ± 0.9 pA (ctrl; n = 13) and 32.4 ± 0.9 pA (GluA1; n = 13; p = 0.71). Rectification: 100% ± 2.8% (ctrl; n = 13) and 124.2% ± 5.6% (GluA1; n = 13; p = 0.00048). E) Evoked AMPA responses of control or GluA1‐expressing Fmr1‐KO PNs. IAMPA: 34.3 ± 0.8 pA (ctrl; n = 13) and 34.2 ± 1.0 pA (GluA1; n = 13; p = 0.95). Rectification: 100% ± 2.1% (ctrl; n = 13) and 102.8% ± 1.8% (GluA1; n = 13; p = 0.31). F) Evoked AMPA responses of control or GluA1‐expressing Fmr1‐KO+MGE PNs. IAMPA: 32.6 ± 0.8 pA (ctrl; n = 13) and 32.8 ± 1.1 pA (GluA1; n = 13; p = 0.90). Rectification: 100% ± 2.1% (ctrl; n = 13) and 125.8% ± 4.5% (GluA1; n = 13; p < 0.001). G) IAMPA and INMDA recorded from control or GluA1ct‐expressing PNs from Fmr1‐KO mice. Bar graphs show average amplitudes of IAMPA and percentage changes of INMDA to the control. IAMPA: 32.5 ± 1.0 pA (ctrl; n = 13) and 31.5 ± 1.0 pA (GluA1; n = 13; p = 0.46). Change of INMDA: 100% ± 1.2% (ctrl; n = 13) and 98.8% ± 1.6% (GluA1; n = 13; p = 0.56). H) IAMPA and INMDA recorded from control or GluA1ct‐expressing Fmr1‐KO+MGE PNs. IAMPA: 39.7 ± 1.0 pA (ctrl; n = 13) and 28.5 ± 0.9 pA (GluA1; n = 13; p < 0.001). Change of INMDA: 100% ± 2.6% (ctrl; n = 13) and 104.6% ± 2.9% (GluA1; n = 13; p = 0.23). I) Blots of GTP‐bound Ras and total Ras in CA1. Bar graphs show relative amounts of Ras‐GTP. J) Blots of phos‐PKB and total PKB in CA1. Bar graphs show relative amounts of phos‐PKB. See Table S7 (Supporting Information) for more statistics, including n values, p values, and statistical tests. **p < 0.01. ***p < 0.001.
Figure 7
Figure 7
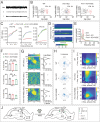
MGE cell transplantation restores neural oscillations in Fmr1‐KO mice. Note that the ages were P60 for WT and Fmr1‐KO mice, but 30 DAT for Fmr1‐KO+MGE mice. A) Example LFP raw, θ (4–12 Hz) and γ (20–100 Hz) bands. Scale bars: 4 s / 50 µV. B) Spike half‐width and mean firing rate of PNs and INs. PN firing: 4.73 ± 0.15 Hz (WT); 9.72 ± 0.22 Hz (Fmr1‐KO); 4.26 ± 0.15 Hz (Fmr1‐KO+MGE); IN firing: 26.13 ± 0.39 Hz (WT); 23.27 ± 0.52 Hz (Fmr1‐KO); 28.17 ± 0.48 Hz (Fmr1‐KO+MGE). C) Spike count correlations between PNs, INs, and mixed PN and IN pairs across varying time windows. Gray bar marks significant differences between genotypes. D) Time frequency power spectra of LFP recorded in CA1, during the first 4 s of each continuous recorded segment in which animals moved above threshold speed (3 cm −1 s). E) Full spectrum CA1 LFP power. Gray bar marks significant differences between genotypes. F) Relative LFP powers in θ band (4–12 Hz), low γ band (20–50 Hz) and high γ band (55–100 Hz). G) Spike phase modulation of PNs as a function of instantaneous LFP frequency in 3 groups. Left: Color bar shows normalized Z‐scored firing rate. Right: median Rayleigh's Z statistic for each population as a function of LFP frequency. H) Example distributions of γ phase preference of PNs in 3 groups. I) Standard PAC comodulogram depicting the amplitudes of oscillations at frequencies ranging from 25 to 125 Hz being modulated by the phase of oscillations at frequencies ranging from 1 to 20 Hz. J) Schematic illustration depicting the proposed mechanisms through which differentiated MGE INs integrate into the hippocampal neural circuit (SC and TA pathways) and modulate θ and γ oscillations. See Tables S8–S10 (Supporting Information) for statistics, including n values, p values, and statistical tests. **p < 0.01. ***p < 0.001.

References

    1. Cook D., Nuro E., Murai K. K., Dev. Neurobiol. 2014, 74, 147. - PMC - PubMed
    1. Ashley Jr C. T., Wilkinson K. D., Reines D., Warren S. T., Science 1993, 262, 563. - PubMed
    1. Entezam A., Biacsi R., Orrisn B., Saha T., Hoffman G., Grabczyk E., Nussbaum R. L., Usdin K., Gene 2007, 395, 125. - PMC - PubMed
    1. Huber K. M., Gallagher S. M., Warren S. T., Bear M. F., Proc. Natl. Acad. Sci. U.S.A. 2002, 99, 7746. - PMC - PubMed
    1. Li J., Pelletier M. R., Velazquez J. P., Carlen P. L., Mol. Cell Neurosci. 2002, 19, 138. - PubMed

Substances

LinkOut - more resources