. 2025 Feb 6;112(2):235-253.
doi: 10.1016/j.ajhg.2024.12.007. Epub 2025 Jan 16.

Characterizing substructure via mixture modeling in large-scale genetic summary statistics

Collaborators, Affiliations

Characterizing substructure via mixture modeling in large-scale genetic summary statistics

Hayley R Stoneman et al. Am J Hum Genet. .

Abstract

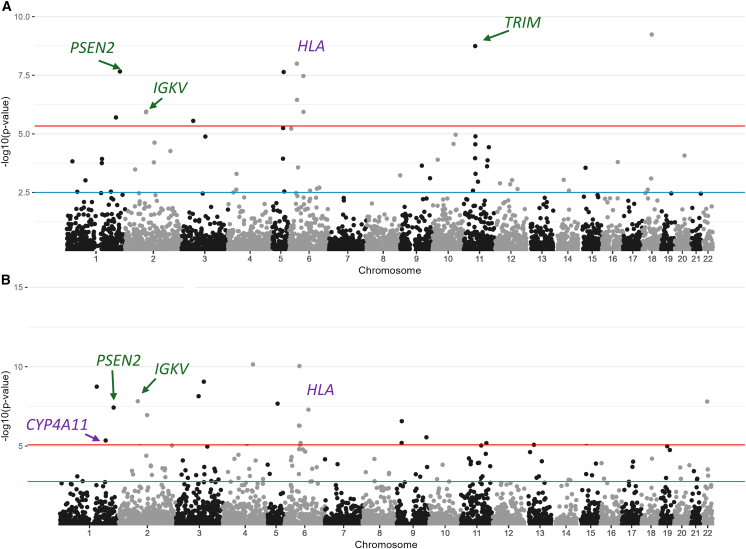
Genetic summary data are broadly accessible and highly useful, including for risk prediction, causal inference, fine mapping, and incorporation of external controls. However, collapsing individual-level data into summary data, such as allele frequencies, masks intra- and inter-sample heterogeneity, leading to confounding, reduced power, and bias. Ultimately, unaccounted-for substructure limits summary data usability, especially for understudied or admixed populations. There is a need for methods to enable the harmonization of summary data where the underlying substructure is matched between datasets. Here, we present Summix2, a comprehensive set of methods and software based on a computationally efficient mixture model to enable the harmonization of genetic summary data by estimating and adjusting for substructure. In extensive simulations and application to public data, we show that Summix2 characterizes finer-scale population structure, identifies ascertainment bias, and scans for potential regions of selection due to local substructure deviation. Summix2 increases the robust use of diverse, publicly available summary data, resulting in improved and more equitable research.

Keywords: admixed; confounding; equitable research; federated learning; genetic similarity; genetic summary data; harmonization; local ancestry; population stratification; selection; substructure; summary data.


Conflict of interest statement

Declaration of interests C.R.G. owns stock in 23andMe, Inc.

Figures

None
Graphical abstract
Figure 1
Figure 1
Summix-local accurately estimates local substructure proportions and detects regions where the local substructure differs from the global substructure in an AMR-like simulation (A) Accuracy (y axis) for Summix-local for 100 replicates per scenario using default simulation parameters (1,000 observed individuals, 500 individuals per reference group, window size: 1,500 variants) except when varying by observed sample size (left), reference sample size (middle), and window size defined by number of variants (right). The lower and upper hinges of boxes correspond to the 25th and 75th percentiles, respectively. Upper and lower whiskers are the largest and smallest values no further than 1.5× the inter-quartile range (IQR) from the hinge, and the center line represents the median. (B) Type I error (top) and power (bottom) for the Summix-local substructure scan for fast-catchup (left) and sliding window (right) algorithms across simulation scenarios as shown in (C) using LD-filtered (r2 < 0.2) chromosome 19 data. Yellow points represent the small value for the parameter scenario (with all other parameters as default), purple represents all default parameter values, and teal points represent the large value for the parameter scenario (with all other parameters as default). (C) Table of simulation scenarios evaluated in (B). The parameter settings are default except where the given parameter is changed to be small or large.
Figure 2
Figure 2
Local substructure scan in gnomAD AFR/AFRAM and Latino/AMR identifies potential regions of selection Summix-local using the fast-catchup algorithm and default parameters in gnomAD v.3.1.2. Red line is Bonferroni-corrected genome-wide significance (p < 4.21e−6 AFR [African], 8.40e−6 AMR [admixed American]) and blue is Bonferroni correction for the replication signals (p < 3.13e−3 AFR, 1.72e−3 AMR). Genes of interest discussed in the results are annotated; for a complete list of genes, see Table S10. Gene names in purple are replicated signals that were previously identified, while green are putative novel signals. (A) AFR/African American (AFR/AFRAM). (B) Latino/AMR.
Figure 3
Figure 3
Summix2 detects and adjusts for finer-scale genetic substructure Accuracy of Summix2 estimates for various simulation scenarios. (Note: “-like” nomenclature was omitted from x axis plot labels from B and C for simplicity). For all boxplots, lower and upper hinges of boxes correspond to the 25th and 75th percentiles, respectively. Upper and lower whiskers are the largest and smallest values no further than 1.5× the IQR from the hinge, and the center line represents the median. (A) Accuracy of Summix2 estimates for three simulation scenarios: equal proportions (0.25, 0.25, 0.25, and 0.25), varying proportions (0.1, 0.2, 0.3, and 0.4), and one zero proportion (0, 0.33, 0.33, and 0.33) across pairwise groups of increasing similarity (FST = 0.009, light green, low similarity; FST = 0.007, green, medium similarity; FST = 0.005, dark green, high similarity). (B) Accuracy in AFR/AFRAM-like simulation scenario. (C) Genetic substructure similarity map of Summix2 estimates for the AFR/AFRAM-like sample where edge thickness between nodes indicates pairwise similarity (thicker edges indicate higher similarity) as defined by pairwise FST and node size indicates magnitude of the Summix2 mixing proportion estimate for the given reference group. (D) Absolute difference between target AFR-like sample AFs and unadjusted (gray) or adjusted observed AFR/AFRAM-like AFs grouped by MAF bin (continental adjustment, blue; finer-scale estimate adjustment, green; finer-scale parameter adjustment, teal); zoomed-out version is shown in Figure S24A. The relative difference is shown in Figure S23A. (E) Finer-scale substructure proportions for AFR/AFRAM-like sample and AFR-like sample in (D); simulated proportions are shown in Table S13.
Figure 4
Figure 4
Allele frequency adjustment improves data harmonization Results for the 12,513 variants on chromosome 19 with gnomAD local substructure estimates and filtering for LD (r2 > 0.2) and MAF (>0.01). Absolute difference is shown by MAF bin (x axis). The unadjusted gnomAD AMR (gray) is compared to adjustments using gnomAD (global continental, dark red; local continental, pink) and Summix2 (global continental, blue; global finer-scale, green; local continental, light blue; local finer-scale, light green). The global substructure proportions of the observed and target data are shown in the pie charts. The GoF was substantially better (i.e., smaller) for the simulated targets (continental substructure: continental reference GoF = 0.100, finer-scale reference GoF = 0.673; finer-scale substructure: continental GoF = 1.223, finer-scale GoF = 0.188) compared to the real 1KG-PEL data (continental reference GoF = 5.488, finer-scale reference GoF = 5.0798), likely due to having a fully representative reference panel for the simulated target samples. For all boxplots, lower and upper hinges of boxes correspond to the 25th and 75th percentiles, respectively. Upper and lower whiskers are the largest and smallest values no further than 1.5× the IQR from the hinge, and the center line represents the median. (A) Absolute difference (y axis) after adjusting gnomAD AMR to 1KG-Peruvian by MAF bin (x axis). (B) Absolute difference (y axis) after adjusting gnomAD AMR to simulated Peruvian-like with continental-level substructure by MAF bin (x axis). (C) Absolute difference (y axis) after adjusting gnomAD AMR to simulated Peruvian-like with finer-scale substructure by MAF bin (x axis).
Figure 5
Figure 5
Detecting genetic similarity to individuals with prostate cancer in CCPM Biobank groups Genetic substructure estimates (y axis) from Summix2 for genetic similarity to individuals with prostate cancer in CCPM Biobank subsets stratified by age (x axis) using individuals with prostate cancer and control individuals as reference data for 138 variants from a 2018 prostate cancer PGS. In all images, the observed proportion of individuals with prostate cancer (blue) is compared to the estimated proportion genetically similar to the prostate cancer case reference data (orange) with jackknife 95% confidence intervals shown. (A) Genetic substructure estimates from Summix2 in CCPM Biobank males with prostate cancer (n = 1,322). There were too few males with prostate cancer under the age of 40 years (n < 10) to estimate substructure proportions. (B) Genetic substructure estimates from Summix2 in all CCPM Biobank males (n = 10,092). (C) Genetic substructure estimates from Summix2 in CCPM Biobank males without prostate cancer (n = 8,770). (D) Genetic substructure estimates from Summix2 in CCPM Biobank females (n = 16,594).

Update of

References

    1. Wojcik G.L., Murphy J., Edelson J.L., Gignoux C.R., Ioannidis A.G., Manning A., Rivas M.A., Buyske S., Hendricks A.E. Opportunities and challenges for the use of common controls in sequencing studies. Nat. Rev. Genet. 2022;23:665–679. doi: 10.1038/s41576-022-00487-4. - DOI - PMC - PubMed
    1. Sanderson E., Glymour M.M., Holmes M.V., Kang H., Morrison J., Munafò M.R., Palmer T., Schooling C.M., Wallace C., Zhao Q., Smith G.D. Mendelian randomization. Nat. Rev. Methods Primers. 2022;2 doi: 10.1038/s43586-021-00092-5. - DOI - PMC - PubMed
    1. Kullo I.J., Lewis C.M., Inouye M., Martin A.R., Ripatti S., Chatterjee N. Polygenic scores in biomedical research. Nat. Rev. Genet. 2022;23:524–532. doi: 10.1038/s41576-022-00470-z. - DOI - PMC - PubMed
    1. Hendricks A.E., Billups S.C., Pike H.N.C., Farooqi I.S., Zeggini E., Santorico S.A., Barroso I., Dupuis J. ProxECAT: Proxy External Controls Association Test. A new case-control gene region association test using allele frequencies from public controls. PLoS Genet. 2018;14 doi: 10.1371/journal.pgen.1007591. - DOI - PMC - PubMed
    1. Popejoy A.B., Fullerton S.M. Genomics is failing on diversity. Nature. 2016;538:161–164. doi: 10.1038/538161a. - DOI - PMC - PubMed

LinkOut - more resources